- *Corresponding Author:
- Y. S. Li
Department of Intensive Care Medicine, Emergency Department, Tongji Hospital, Tongji Medical College, Huazhong University of Science and Technology, Hankou, Wuhan 430030, China
E-mail: tjh_ysli@163.com
| This article was originally published in a special issue,“New Advancements in Biomedical and Pharmaceutical Sciences” |
| Indian J Pharm Sci 2022:84(2) Spl Issue “163-173” |
This is an open access article distributed under the terms of the Creative Commons Attribution-NonCommercial-ShareAlike 3.0 License, which allows others to remix, tweak, and build upon the work non-commercially, as long as the author is credited and the new creations are licensed under the identical terms
Abstract
Lung adenocarcinoma is one of the most common tumors in humans. By exploring the role of necroptosis in lung adenocarcinoma, we aimed to gather information which can be used to build a necroptosis-relatedgene- based diagnostic model that can play an auxiliary role in lung adenocarcinoma diagnosis and treatment. Necroptosis-related genes were selected from the Kyoto Encyclopedia of genes and genomes database. Differentially expressed genes in the tumor group and normal group were identified from The Cancer Genome Atlas/Genomic Data Commons database then analyzed by gene ontology, Kyoto Encyclopedia of genes and genomes and gene set enrichment analysis. Cox and Lasso regression analyses were used to screen out prognosis-related necroptosis-related genes from the differentially expressed genes and establish a necroptosis risk-scoring signature. The receiver operating characteristic curves were plotted and patients were divided into high-risk and low-risk groups according to the necroptosis risk-scoring signature. Kaplan- Meier survival curves were drawn and area under the curve, and decision curve analyses were calculated to evaluate the performance of the model. Then, internal and external dataset validations were performed. A total of 159 necroptosis-related genes were retrieved from the Kyoto Encyclopedia of genes and genomes database, 39 of which were differentially expressed in tumor tissues. Four necroptosis-related genes (interleukin-33, cytochrome B-245 beta chain, H2A.X variant histone and Readthrough (RNF103-CHMP3)) independently correlated with lung adenocarcinoma prognosis were screened by Lasso or Cox regression based on which prognostic model was established. The independent prognostic value of this model was verified by multivariate Cox regression analysis. In this model, the low-risk group showed significantly longer survival time than the high-risk group (p<0.01) and the model showed good predictive performance in both the internal and external validation sets. In this study, we explored the potential link between necroptosis and lung adenocarcinoma, established a necroptosis gene-based prognostic model and validated the independent prognostic value of the model.
Keywords
Joint representation learning, necroptosis, lung adenocarcinoma, nomogram, Kyoto Encyclopedia of genes and genomes database, gene ontology database
Lung cancer is the main cause of cancer-related deaths in China[1]. Lung Adenocarcinoma (LUAD) is the most common pathological type of lung cancer, accounting for 39.7 % of lung cancer cases[2]. The main risk factors for LUAD include second-hand smoke, pollution and occupational carcinogens[3], and the disease is also associated with hereditary susceptibility[4]. Despite great strides in the advancement of chemotherapy and targeted therapy for LUAD, Overall Survival (OS) is still low for most patients, with one of the main reasons for this being that most patients are diagnosed at an advanced stage. At present, clinically relevant prognostic indicators for LUAD include tumor size, metastasis and mutation load. However, the tumors are highly heterogeneous and there are great differences in therapeutic effect and prognosis even among patients with the same Tumor-Node-Metastasis (TNM) stage. Hence, the above indicators alone have poor specificity and cannot be used to accurately predict the prognosis of patients[5]. Therefore, we need to explore new biomarkers and construct new scoring criteria to provide a basis for the individual diagnosis and treatment of LUAD. In addition, LUAD cells can develop resistance to existing chemotherapy agents and targeted drugs in a variety of ways[6], and new therapeutic markers and targets are needed to achieve better therapeutic effects. Hence, the identification of abnormal genes has become a hot topic in recent years and studies of necroptosis are receiving increasing attention[7]. In conclusion, exploring the role of necroptosis in the pathogenesis of LUAD and establishing an improved prognostic model is of significance to the early diagnosis and treatment of LUAD.
Apoptosis is a common cell death pathway in organisms. Traditional chemotherapy drugs inhibit tumor growth by inducing apoptosis in tumor cells[8], but tumor cells can develop certain drug resistance strategies through the disruption of normal apoptosis mechanisms. As studies continue to investigate cell death mechanisms in-depth, more and more new cell death modes have been found; for example, Degterev et al.[9] first reported a unique cell death mode in vertebrates-necroptosis. Classical apoptosis depends on the activation of caspase, when caspase is deficient or inhibited, the apoptosis pathway is also inhibited, which is one of the bases for drug resistance in tumors[10]. However, necroptosis is a caspaseindependent mode of cell death. In necroptosis, the phosphorylation-signaling pathway mediated by Receptor Interacting Serine/Threonine Kinase 1/3 (RIPK1/RIPK3) activates the Mixed Lineage Kinase Domain Like Pseudokinase (MLKL)/phosphorylated MLKL (pMLKL), resulting in cell enlargement, organelle swelling, cell collapse after membrane perforation and the release of cellular contents. Consequently, an immune response is triggered and necrotic cells are eliminated by macropinocytotic corpuscles. When the classical apoptotic pathway is inhibited due to caspase inactivation, necroptosis is activated as a substitute. Therefore, it is believed that tumor cells that are resistant to apoptosis may be sensitive to cell death via necroptosis pathway activation[11]. These findings suggest that necroptosis and its regulatory mechanisms are potential LUAD treatment targets.
Previously, several studies have developed prognosis-related models for LUAD. However, few studies reported the relationship between necroptosis and LUAD, and to date, no prognostic models have been developed in this area. In this study, we investigated the correlation between necroptosis and LUAD using The Cancer Genome Atlas (TCGA) and Gene Expression Omnibus (GEO) databases. We established a Necroptosis-Related Gene (NRG) prognostic signature and examined its clinical value. We hope our study results can support the diagnosis and treatment of LUAD.
Materials and Methods
Data collection and processing:
NRGs were retrieved from the Kyoto Encyclopedia of Genes and Genomes (KEGG) database (https:// www.kegg.jp)[12]. Standardized Fragments per Kilobase of Transcript per Million Mapped Reads (FPKM) Ribonucleic Acid sequencing (RNA-seq) data and clinical data, excluding lost-to-follow-up patients, were downloaded from TCGA/Genomic Data Commons (GDC) database (https://portal.gdc. cancer.gov/) on October 31, 2021[13]. The dataset GSE19188 was downloaded from the GEO database for use as a gene validation set. All datasets in the present study were from public databases, thus ethical approval was not needed.
Differential expression analysis and enrichment analysis:
Differentially Expressed NRGs (DENGs) between LUAD and normal lung tissues were screened out using the “limma” package in the software R-4.0.3 and the expression profiles were standardized using the “edgeR” package. The screening standards of Differentially Expressed Genes (DEGs) were log2 |fc|>1 and p-value adjusted (padj)<0.05. The Grammar of Graphics (GGplot2)[14] and “Pheatmap” packages were used to plot the volcano plots and heat maps, which were used to visualize the DEGs. Subsequently, the “clusterProfiler” and “EnrichPlot” packages were utilized for Gene Ontology (GO) enrichment analysis, KEGG analysis, Gene Set Enrichment Analysis (GSEA) and visualization. Then, the phenotypic correlations of the DEGs were determined to explore the potential molecular mechanisms.
Establishment of necroptosis-related prognostic model:
After obtaining DENGs, Least absolute shrinkage and selection operator (Lasso) regression analysis was used to eliminate collinearity among the independent variables to further screen for DENGs and a Lasso trajectory chart was plotted[15]. Genes with non-zero regression coefficients were subjected to multivariate Cox analysis and the final prognostic risk scoring model was constructed. The risk score calculation formula was as follows: Risk score=Gene expression 1×Coef1+gene expression 2×Coef2+... +gene expression n×Coefn (Coef: Regression coefficient of gene in multivariate Cox regression analysis; n: Total number of NRGs correlated with prognosis). The risk score for each patient was calculated according to the formula and the patients were divided into a highrisk group and a low-risk group using the median risk score. Risk factor graphs and Kaplan-Meier survival curves were drawn to analyze and compare the OS of the two groups. The “timeROC” package was used to plot the time-dependent Receiver Operator Characteristic (ROC) curves and the Area Under the Curve (AUC) of sample OSs at 1 y, 3 y and 5 y was calculated to evaluate the predictive prognostic ability of the model. The higher the AUC, the better the model performance was. Subsequently, risk score and other clinical information, such as age, gender and stage, were incorporated into the observation indicators. Univariate and multivariate Cox analysis of the correlation between each factor and the OS was conducted to determine the independent prognostic factors of LUAD and a forest plot and nomogram were plotted according to the results. Finally, the relationship between each clinical parameter and the risk score was analyzed. Cox models of TNM, nomogram and Necroptosis Risk Scoring Signature (NRSS) were constructed and Decision Curve Analysis (DCA) for 1 y, 3 y and 5 y survival was conducted to evaluate the clinical utility of NRSS[16]. Moreover, the actual probability of LUAD patient’s survival and the model-predicted probability were fitted by drawing calibration diagrams to judge the evaluation effect of NRSS on the prediction of actual results.
Validation of NRSS:
The LUAD patients were randomly divided into a training set (n=263) and a validation set (n=263), and the risk score for each patient was calculated using the scoring formula. Patients in both the training and validation sets were divided into high-risk and low-risk groups for internal validation based on the median risk scores. A Kaplan-Meier survival curve was used to compare the OS between the two groups and AUC was used to evaluate the predictive ability of the model.
Next, GSE19188 was selected from the GEO database as the external verification set. According to the above risk-scoring formula, the risk scores of the LUAD samples in this verification set were calculated and the patients were divided into high and low-risk groups. The same method was used to evaluate the predictive performance of the prognostic risk model. The “survival”, “R-Script Decision Curve Analysis for survival data (STDCA)” and “pROC” packages were used for this process.
Statistical analysis:
Statistical analyses were performed with R software (Version 3.5.1). When the two groups conformed to normality but not homogeneity of variance, Welch’s t-test was selected to compare the groups. When the two groups did not conform to normality, the Wilcoxon-Mann-Whitney test was used for comparison. Survival curves were generated using the Kaplan-Meier method and compared by logrank test. Multivariate analysis was performed using the Cox proportional hazard model. All statistical tests were bilateral, with p<0.05 being statistically significant.
Results and Discussion
A total of 159 NRGs were collected from the KEGG database and the messenger RNA (mRNA) expression data of 535 LUAD tissues and 59 normal tissues were obtained from the TCGA database (fig. 1A-fig. 1E). Using log2|fc|>1 and padj<0.01 as criteria, 5382 DEGs were screened out. Among the 5382 DEGs, 39 DENGs were found (fig. 1A), including 26 up-regulated genes (Calcium/Calmodulin Dependent Protein Kinase II Beta (CAMK2B), Tumour Necrosis Factor (TNF) Receptor Associated Factor (TRAF) 5, Janus Kinase 3 (JAK3), Interferon Gamma (IFNG), Phospholipase A2 Group IVA (PLA2G4A), Z-DNA Binding Protein 1 (ZBP1), TRAF2, PLA2G4D, Charged Multivesicular Body Protein 4C (CHMP4C), Interferon Beta 1 (IFNB1), H2A Clustered Histone (H2AC) 6, H2A.W Histone (H2AW), H2AC20, H2AC21, H2A.X Variant Histone (H2AX), H2AC13, H2AC11, H2AC7, H2AC18, RNF103- CHMP3 Readthrough (RNF103-CHMP3), H2AC12, H2AC14, H2AC16, H2AC8, H2AC4, H2AC17) and 13 down-regulated genes (Glycogen Phosphorylase, Muscle associated (PYGM), CAMK2A, Mitogen- Activated Protein Kinase 10 (MAPK10), Interleukin (IL) 1 Alpha (IL1A), TNF Alpha Induced Protein 3 (TNFAIP3), IL1B, Toll Like Receptor 4 (TLR4), IL- 33, IFNA21, IFNA5, Arachidonate 15-Lipoxygenase (ALOX15), Cytochrome B-245 Beta chain (CYBB), PLA2G4F). Grouping boxplots were plotted to reveal differences in the expression of the 39 DENGs between tumor tissues and adjacent tissues (fig. 1B). A volcano plot was generated for 5382 DEGs (fig. 1C).
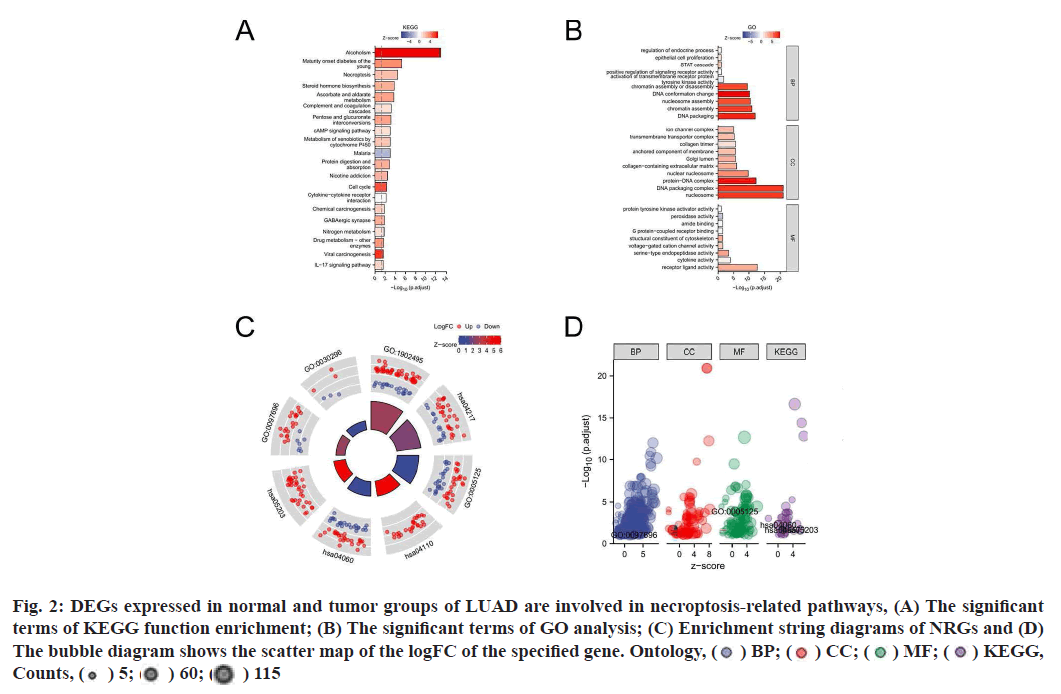
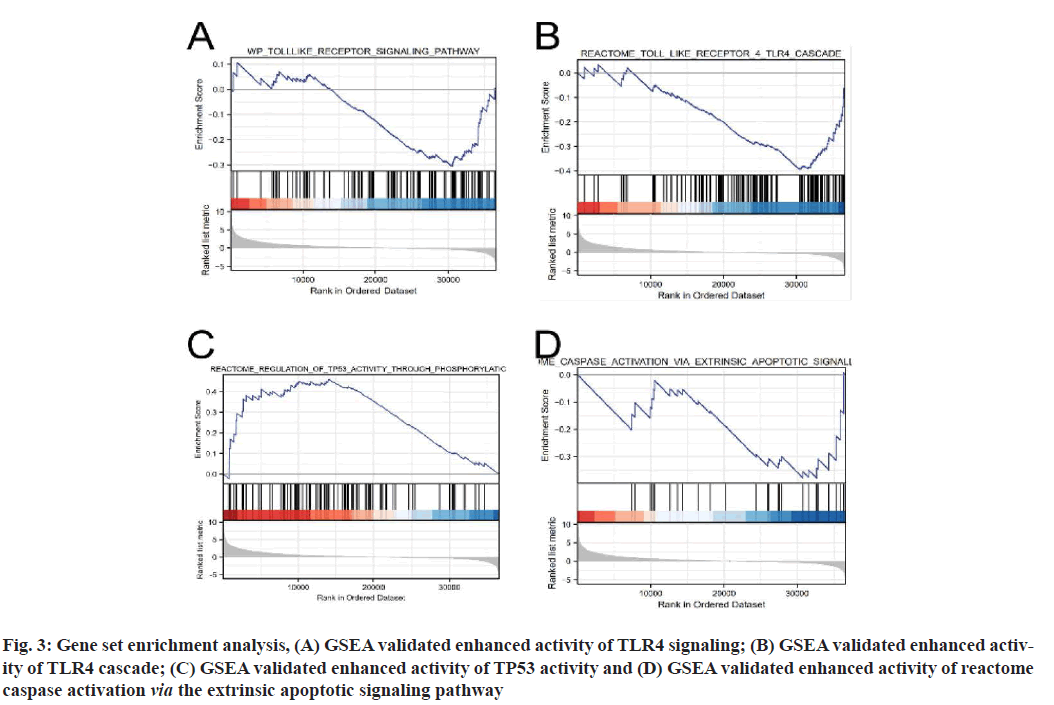
Functional enrichment analysis was performed on DEGs to provide an understanding of their biological roles. The most enriched terms were necroptosis, the cyclic Adenosine Monophosphate (cAMP) signaling pathway, cell cycle and the IL-17 signaling pathway. In these enrichment analyses, the Z-scores were combined to evaluate the role of DEGs in these pathways (fig. 2). In addition, in the GSEA analysis, the genes were significantly enriched in phenotypes such as TLR4, regulation of Tumor Protein P53 (TP53) activity and reactome caspase activation via the extrinsic apoptotic signaling pathway (fig. 3). Thus, these findings revealed a link between the occurrence of cancer and various genes that regulate the way cells die, including those involved in necroptosis.
Fig. 2:DEGs expressed in normal and tumor groups of LUAD are involved in necroptosis-related pathways, (A) The significant
terms of KEGG function enrichment; (B) The significant terms of GO analysis; (C) Enrichment string diagrams of NRGs and (D)
The bubble diagram shows the scatter map of the logFC of the specified gene. Ontology, ( ) BP; (
 ) CC; (
 ) MF; (
 ) KEGG,
Counts, (
 ) 5; (
 ) 60; (
 ) 115
) 115
Fig. 3:Gene set enrichment analysis, (A) GSEA validated enhanced activity of TLR4 signaling; (B) GSEA validated enhanced activity of TLR4 cascade; (C) GSEA validated enhanced activity of TP53 activity and (D) GSEA validated enhanced activity of reactome caspase activation via the extrinsic apoptotic signaling pathway
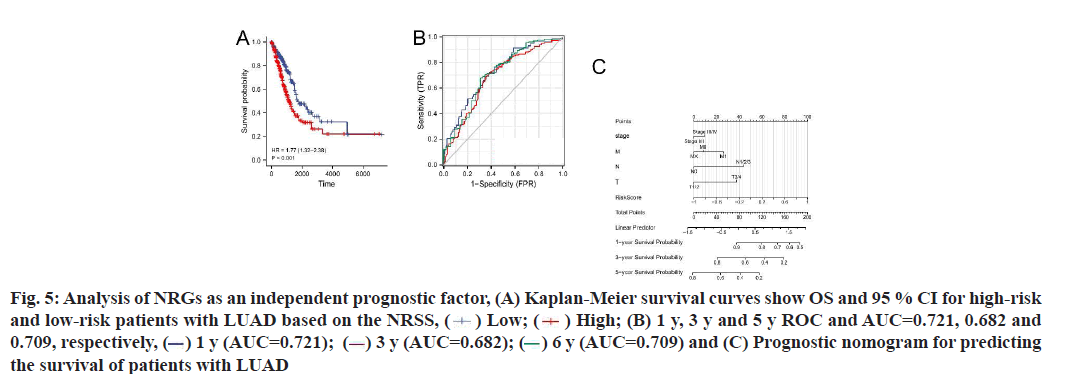
Construction and prognostic evaluation of NRSS was shown below. Univariate Cox regression analysis was performed on 39 DENGs and seven NRGs (PYGM, TLR4, IL-33, CHMP4C, CYBB, H2AX, RNF103- CHMP3) were found to be significantly correlated with prognosis. Lasso regression analysis was carried out for the above seven NRGs to exclude collinear interference and variable trajectory charts were generated (fig. 1D and fig. 1E). Based on the charts, the optimal penalty coefficient of the model was confirmed to be 4 and four NRGs were screened out, namely IL-33, CYBB, H2AX and RNF103-CHMP3. These genes were confirmed to be independent prognostic factors of LUAD by multivariate Cox regression analysis and their expression levels in tumor tissues and normal tissues were mapped (fig. 4A). Combined with the corresponding Coef, it was confirmed that NRSS=(−0.056×expression level of IL-33)− (0.057×expression level of CYBB)+(0.270×expression level of H2AX)+(0.651×expression level of RNF103- CHMP3). The risk score of each patient was calculated and the median risk value was used as the cut-off point to divide the patients into a high-risk score group (n=263) and low-risk score group (n=263). The heat map, risk score plot and survival outcome plot based on risk score were generated (fig. 4B and fig. 4C). It was clear that, as the score increased, there was a significant rise in overall mortality rate. To evaluate the performance of the NRSS, Kaplan-Meier analysis was performed on the OS of both groups. The OS of the high-risk group was significantly lower than that of the low-risk group (Hazard Ratio (HR)=1.77, 95 % Confidence Interval (CI)=1.32-2.38, p<0.001, fig. 5A). The time-dependent ROC curves are shown in fig. 5B. The AUC values for 1 y, 3 y and 5 y survival were 0.721, 0.682 and 0.709 respectively, indicating the robustness and accuracy of the model in predicting the prognosis of patients.
Fig. 5:Analysis of NRGs as an independent prognostic factor, (A) Kaplan-Meier survival curves show OS and 95 % CI for high-risk
and low-risk patients with LUAD based on the NRSS, ( ) Low; (
 ) High; (B) 1 y, 3 y and 5 y ROC and AUC=0.721, 0.682 and
0.709, respectively, (
 ) 1 y (AUC=0.721); (
 ) 3 y (AUC=0.682); (
  ) 6 y (AUC=0.709) and (C) Prognostic nomogram for predicting
the survival of patients with LUAD
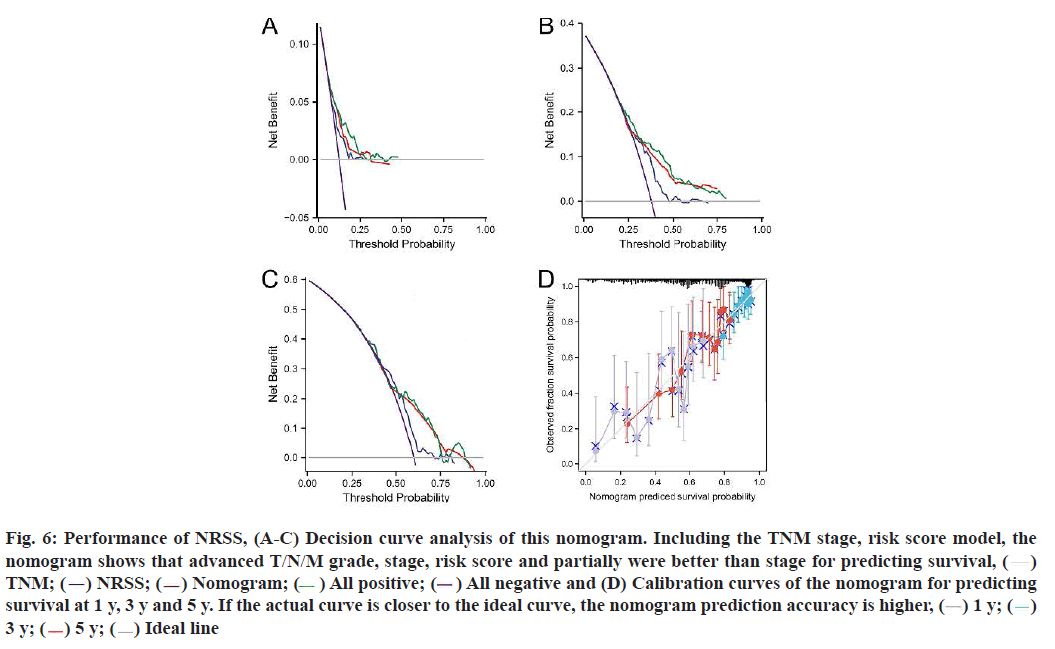
The results of univariate and multivariate Cox regression analyses showed there were significant differences in risk score (fig. 5C), indicating that risk score had an independent prognostic value and could be used as an independent prognostic factor for LUAD patients. In addition, the T and N tumor stages may also be independent prognostic factors for LUAD patients, thus we constructed a necroptosis-related nomogram to predict the 1 y, 3 y and 5 y survival rates of the patients. The C-indexes for the established nomogram, NRSS and TNM-stage were 0.678, 0.647 and 0.618, respectively (Table 1). Both the DCA results for 1 y, 3 y and 5 y OS (fig. 6A-fig. 6C) and the C-index showed that NRSS had better predictive power than traditional TNM staging. However, the nomogram, which combined multiple clinical information, had the most robust predictive accuracy. The calibration curves of the nomogram, which was used to predict the 1 y, 3 y and 5 y survival, also showed that the actual curve closely followed the ideal curve, demonstrating its high predictive accuracy (fig. 6D).
| Cohort | Variable | C-index (95 % CI) |
|---|---|---|
| LUAD | TNM-stage | 0.618 (0.594-0.642) |
| NRSS | 0.647 (0.623-0.670) | |
| Nomogram | 0.678 (0.654-0.702) |
Table 1: The C-Index of TNM-Stage, NRSS and Nomogram
Fig. 6: Performance of NRSS, (A-C) Decision curve analysis of this nomogram. Including the TNM stage, risk score model, the
nomogram shows that advanced T/N/M grade, stage, risk score and partially were better than stage for predicting survival, ( )
TNM; (
 ) NRSS; (
 ) Nomogram; (
 ) All positive; (
 ) All negative and (D) Calibration curves of the nomogram for predicting
survival at 1 y, 3 y and 5 y. If the actual curve is closer to the ideal curve, the nomogram prediction accuracy is higher, (
 ) 1 y; (
 )
3 y; (
 ) 5 y; (
 ) Ideal line
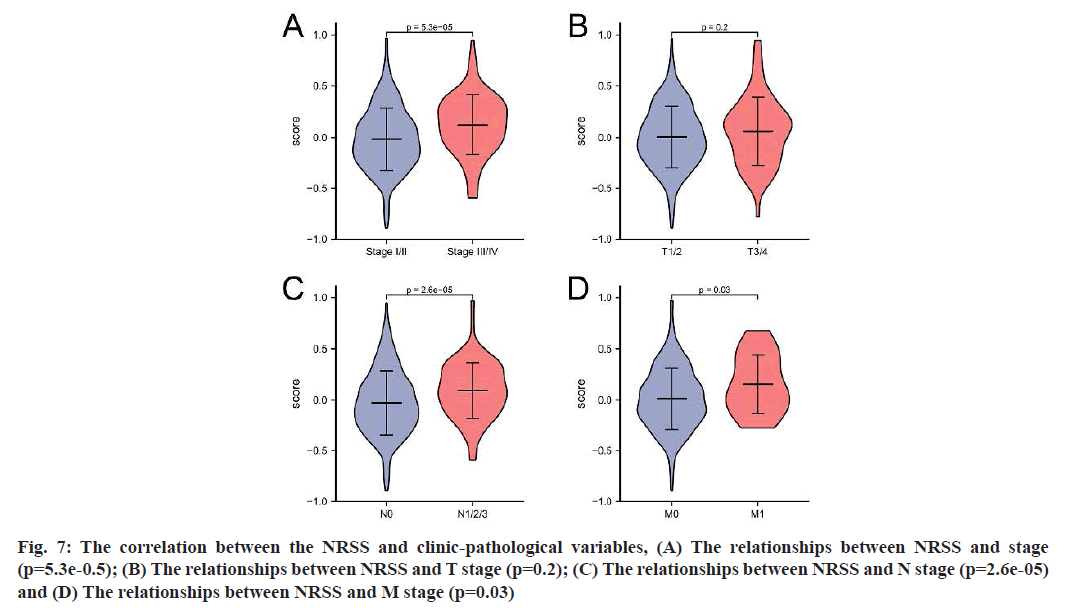
The TCGA-LUAD dataset was used to further investigate whether the model could predict the prognosis of patients with different clinical characteristics, including tumor size, lymph node metastasis and tumor stage. According to the results (fig. 7), the risk score for stage III/IV was higher than that for stage I/II (p=5.3e-05); the score for patients with N1/2/3 was higher than that for patients with N0 (p=2.6e-05) and the risk score for M1 patients was higher than that for M0 patients, with a significant difference between the two groups (p=0.03).
Fig. 7: The correlation between the NRSS and clinic-pathological variables, (A) The relationships between NRSS and stage (p=5.3e-0.5); (B) The relationships between NRSS and T stage (p=0.2); (C) The relationships between NRSS and N stage (p=2.6e-05) and (D) The relationships between NRSS and M stage (p=0.03)
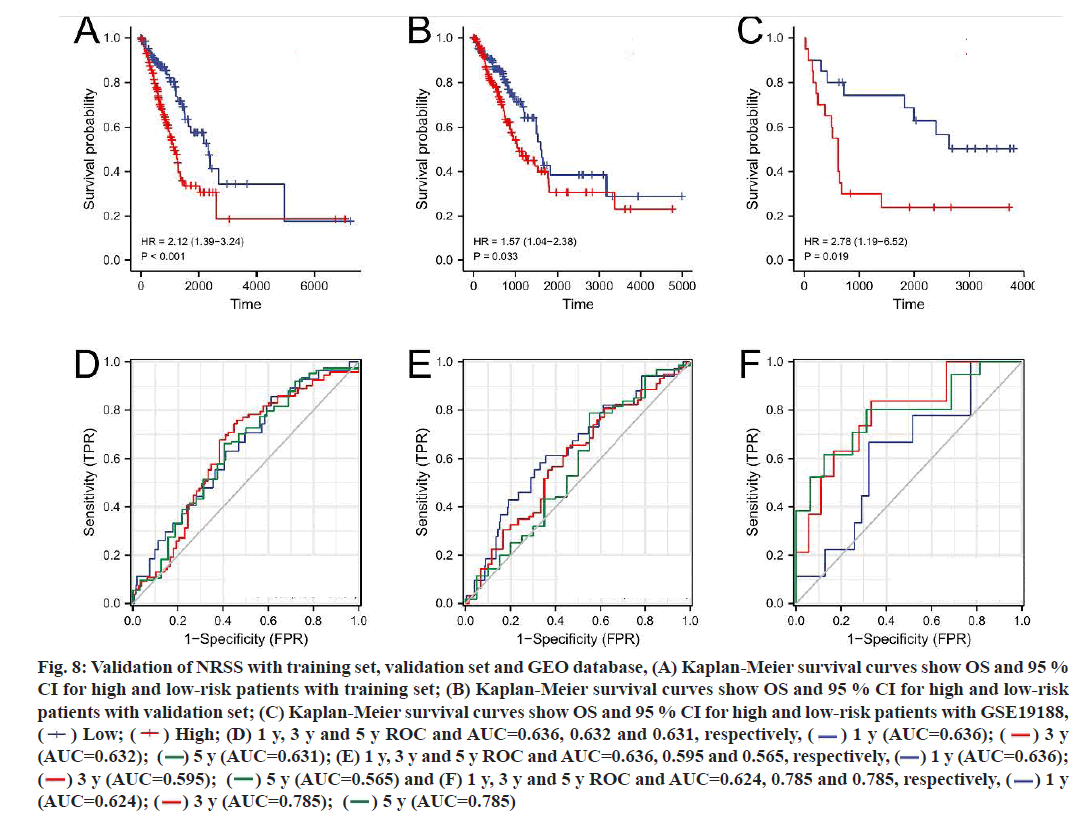
To verify the applicability of prognostic features to the OS, LUAD patients were divided into a training set (n=263) and a validation set (n=263) using the random number method. The risk score of each patient was calculated according to the formula and patients were divided into high-risk and low-risk groups according to the median value of the risk score (fig. 8A- fig. 8F). Consistent with the results of the entire dataset, patients with high risk scores had lower OS than patients with low risk scores in both groups (fig. 8A and fig. 8B). In the training set, the AUC of the 1 y, 3 y and 5 y survival were 0.636, 0.632 and 0.631, respectively (fig. 8D). In the validation set, the AUC of 1 y, 3 y and 5 y were 0.636, 0.595 and 0.565, respectively (fig. 8E).
Fig. 8:Validation of NRSS with training set, validation set and GEO database, (A) Kaplan-Meier survival curves show OS and 95 %
CI for high and low-risk patients with training set; (B) Kaplan-Meier survival curves show OS and 95 % CI for high and low-risk
patients with validation set; (C) Kaplan-Meier survival curves show OS and 95 % CI for high and low-risk patients with GSE19188,
( ) Low; (
 ) High; (D) 1 y, 3 y and 5 y ROC and AUC=0.636, 0.632 and 0.631, respectively, (
 ) 1 y (AUC=0.636); (
 ) 3 y
(AUC=0.632); (
 ) 5 y (AUC=0.631); (E) 1 y, 3 y and 5 y ROC and AUC=0.636, 0.595 and 0.565, respectively, (
 ) 1 y (AUC=0.636);
(
 ) 3 y (AUC=0.595); (
 ) 5 y (AUC=0.565) and (F) 1 y, 3 y and 5 y ROC and AUC=0.624, 0.785 and 0.785, respectively, (
 ) 1 y
(AUC=0.624); (
 ) 3 y (AUC=0.785); (
 ) 5 y (AUC=0.785)
45 patients with LUAD in the GSE19188 dataset from the GEO database were selected as the external validation set. The Kaplan-Meier survival curve for the LUAD patients showed that those with high risk scores had lower OS than patients with low risk scores, with significant differences (p=0.019). The AUC values for the 1 y, 3 y and 5 y survival ranged from 0.624 to 0.785, indicating that the NRSS had good predictive performance for the external validation set (fig. 8C and fig. 8F).
Lung cancer is the leading cause of cancer-related death worldwide, with a 5 y survival rate of 15 %[17]. Among the various pathological forms, LUAD is the most common, accounting for 39.7 % of lung cancer cases and some patients display genetic susceptibility to the form[4,18]. LUAD has low malignancy and develops slowly, but the OS rate of most patients remains low. There are two main reasons for this situation. The first is the existence of micrometastasis, i.e., hematogenous and lymphatic metastases can appear when lung lesions are small, resulting in the loss of surgical opportunity[19]. The second reason involves gene mutations and drugresistance events. With the discovery of driving genes such as EGFR, the development and application of drugs for patients with EGFR-mutant LUAD in recent years[20] has improved their prognosis to a certain extent. However, in the course of applying such targeted drug therapy in the clinical arena, more and more cases of drug resistance due to gene mutation have been reported[21]. Therefore, new biomarkers to assess the prognosis and survival of LUAD patients and to develop new antitumor drugs should be explored.
Necroptosis, which is characterized by both necrosis and apoptosis, is a type of cell death that was first described in recent years[9] and is jointly regulated by RIPK1, RIPK3 and MLKL[22]. Necroptosis has been shown to be a double-edged sword in cancer progression[23] depending on the type of tumor and its stage of development. For example, due to the low expression of RIPK3 and MLKL, most tumor cells exhibit resistance to necroptosis, which facilitates tumor growth[24,25]. On the other hand, tumor cells can activate death receptors 6 to induce endothelial necroptosis[26], which promotes tumor cell extravasation and metastasis[27,28]. Therefore, the relationship between necroptosis and LUAD pathogenesis is of great significance to LUAD treatment.
In this study, NRGs were collected from the KEGG database and DEGs were screened out using LUAD RNA-seq data and survival information from TCGA. GO and KEGG enrichment analyses indicated that these genes were mainly enriched in signaling pathways that regulate the cell cycle, necroptosis, cAMP and IL- 17. GSEA revealed that these genes were significantly enriched in phenotypes that included TLR4, regulation of TP53 activity and reactome caspase activation via the extrinsic apoptotic signaling pathway. In the Cox and Lasso regression analyses, four NRGs (IL-33, CYBB, H2AX, RNF103-CHMP3) were screened out and the NRSS was constructed.
IL-33 expression has been negatively correlated with lung cancer progression[29]. In LUAD, increased IL- 33 increases the number of Dendritic Cells (DCs)[30]. By increasing the expression of DC-function-related genes, including antigen-presenting genes (Human Leukocyte Antigen (HLA)-Heterodimer consisting of an Alpha chain (DMA), HLA-Heterodimer consisting of Beta chain (DMB) and Cluster of Differentiation 74 (CD74)) and genes for cytokines (IL-1β, IL-6 and TNF), IL-33 induces DC maturation and regulates their function, mediating the immune regulation of LUAD and inhibiting its progression[31]. It is said that the IL-33-targeted drug REGN3500 (SAR440340) has completed a phase II clinical trial. It is hoped that the inhibition of IL-33 can block type 1 and type 2 inflammation, thus achieving the goal of treating asthma. However, according to our findings, blocking IL-33 expression may lead to necroptosis inhibition and increase lung cancer risk and severity, which should be a concern in the development of such drugs. CYBB is a major component of the oxidase system of phagocytes and participates in the killing of various immune cells and previous studies have demonstrated a negative correlation between CYBB expression levels and LUAD prognosis[32], CYBB deficiency can lead to chronic granulomatosis, in which neutrophils reduce Nicotinamide Adenine Dinucleotide Phosphate (NADPH) oxidase activity, at which point neutrophils are able to engulf bacteria but cannot kill them in phagocytic vacuoles. We hypothesize that this situation may also occur in LUAD, resulting in reduced clearance of tumor cells[33]. The phospho-histone H2A.X (Ser139), can induce necroptosis by stimulation with apoptosisinducing factor[34] and Ubiquitin-Specific Peptidase 22 (USP22) can induce the cisplatin resistance in LUAD by regulating H2AX-mediated DNA-damage repair[35]. The protein encoded by the CHMP3 gene was found to be up-regulated in non-small cell lung cancer and has neuroendocrine differentiation, which is associated with poor prognosis[36]. These genes should also be the focus of future drug development.
Kaplan-Meier analysis based on the NRSS proved that patients with high risk scores had a worse prognosis than those with low risk scores. Time-dependent ROC proved that the model had good sensitivity and specificity for the prognostic prediction of LUAD, which was verified in the internal datasets and the external dataset GSE19188. At the same time, univariate and multivariate Cox regression analyses were performed on the risk scores and other clinical predictors, demonstrating that the risk score had independent prognostic value and can be used as an independent prognostic factor for LUAD patients. TNM stage is an internationally recognized predictor of clinical prognosis. In the current study, NRSS had more advantages than TNM stage from the perspective of DCA analysis. However, the model is still in the preliminary establishment stage and this was a retrospective study with a small sample size. Thus, large-scale prospective clinical trial data are needed to verify whether the predictive ability of the signature is better than that of TNM stage. The results of the correlation analysis between risk score and clinical features suggested that risk score was closely related to N stage, M stage and prognosis, but the causal relationship among them needs to be further investigated.
Compared with previous studies, for example[37], our screening criteria are different. We screen genes based on the relationship between necroptosis and LUAD to establish a more distinctive prognostic model, which facilitates more individualized assessment and treatment of patients. In addition, we constructed the nomograph considering clinical factors such as patients age, gender, smoking status and tumor status, so as to more comprehensively evaluate the prognostic survival probability of LUAD patients, which was verified externally, making the model more accurate.
In conclusion, an NRSS for LUAD was constructed in this study based on NRGs through Lasso and Cox regression analyses and the model was verified by DCA. Compared with the ROC curve, which evaluated the model using sensitivity and specificity, DCA is considered to provide more information on a models clinical utility. This model was found to be relatively reliable and had an independent prognostic value and clinical relevance and can provide a reference for the individualized diagnosis and treatment of LUAD patients. No prediction model has been constructed based on NRGs in similar studies and many NRGs can regulate the occurrence and development of tumors. Evaluating the expression of NRGs in tumor tissues has great prospects for predicting survival prognosis and providing new therapeutic targets. This study firstly filled the gap in our knowledge of NRSS in LUAD to achieve a more accurate prognostic assessment for LUAD patients and provide an important reference for personalized treatment. Secondly, this study verified the reliability of the constructed risk model using internal and external datasets. The predictive efficiency validation (mean AUC>0.600) of the model suggests that it has moderate predictive performance in other independent datasets. Unfortunately, there were some limitations to our study. First, all data analyzed in this study came from public databases and large-scale clinical trials are still needed to evaluate the predictive power of the risk model. Second, the risk-related genes used for modeling in this study have not been verified via in vivo and in vitro experiments.
Acknowledgements:
The authors gratefully acknowledge the KEGG and TCGA database, which made the data available.
Conflict of interests:
The authors have no conflicts of interest to declare.
References
- Li D, He C, Ye F, Ye E, He H, Chen G, et al. p62 overexpression promotes bone metastasis of lung adenocarcinoma out of LC3-dependent autophagy. Front Oncol 2021;11:1380.
[Crossref] [Google Scholar] [PubMed]
- Chen W, Zheng R, Baade PD, Zhang S, Zeng H, Bray F, et al. Cancer statistics in China, 2015. CA Cancer J Clin 2016;66(2):115-32.
[Crossref] [Google Scholar] [PubMed]
- Wang A, Kubo J, Luo J, Desai M, Hedlin H, Henderson M, et al. Active and passive smoking in relation to lung cancer incidence in the women's health initiative observational study prospective cohort. Ann Oncol 2015;26(1):221-30.
[Crossref] [Google Scholar] [PubMed]
- Herbst RS, Morgensztern D, Boshoff C. The biology and management of non-small cell lung cancer. Nature 2018;553(7689):446-54.
- Wang S, Wong ML, Hamilton N, Davoren JB, Jahan TM, Walter LC. Impact of age and comorbidity on non–small-cell lung cancer treatment in older veterans. J Clin Oncol 2012;30(13):1447-55.
[Crossref] [Google Scholar] [PubMed]
- Arcila ME, Oxnard GR, Nafa K, Riely GJ, Solomon SB, Zakowski MF, et al. Rebiopsy of lung cancer patients with acquired resistance to EGFR inhibitors and enhanced detection of the T790M mutation using a locked nucleic acid-based assay. Clin Cancer Res 2011;17(5):1169-80.
[Crossref] [Google Scholar] [PubMed]
- Kim HJ, Hwang KE, Park DS, Oh SH, Jun HY, Yoon KH, et al. Shikonin-induced necroptosis is enhanced by the inhibition of autophagy in non-small cell lung cancer cells. J Transl Med 2017;15(1):1-2.
[Crossref] [Google Scholar] [PubMed]
- Sarosiek KA, Chonghaile TN, Letai A. Mitochondria: Gatekeepers of response to chemotherapy. Trends Cell Biol 2013;23(12):612-9.
[Crossref] [Google Scholar] [PubMed]
- Degterev A, Huang Z, Boyce M, Li Y, Jagtap P, Mizushima N, et al. Chemical inhibitor of nonapoptotic cell death with therapeutic potential for ischemic brain injury. Nat Chem Biol 2005;1(2):112-9.
[Crossref] [Google Scholar] [PubMed]
- Marengo B, De Ciucis C, Ricciarelli R, Pronzato MA, Marinari UM, Domenicotti C. Protein kinase C: An attractive target for cancer therapy. Cancers 2011;3(1):531-67.
[Crossref] [Google Scholar] [PubMed]
- Thapa RJ, Nogusa S, Chen P, Maki JL, Lerro A, Andrake M, et al. Interferon-induced RIP1/RIP3-mediated necrosis requires PKR and is licensed by FADD and caspases. Proc Natl Acad Sci USA 2013;110(33):E3109-18.
[Crossref] [Google Scholar] [PubMed]
- Kanehisa M, Goto S. KEGG: Kyoto encyclopedia of genes and genomes. Nucleic Acids Res 2000;28(1):27-30.
[Crossref] [Google Scholar] [PubMed]
- Chandran UR, Medvedeva OP, Barmada MM, Blood PD, Chakka A, Luthra S, et al. TCGA expedition: A data acquisition and management system for TCGA data. PLoS One 2016;11(10):e0165395.
[Crossref] [Google Scholar] [PubMed]
- Maag JL. gganatogram: An R package for modular visualisation of anatograms and tissues based on ggplot2. F1000Res 2018;7:1576.
[Crossref] [Google Scholar] [PubMed]
- Yu G, Wang LG, Han Y, He QY. clusterProfiler: An R package for comparing biological themes among gene clusters. Omics 2012;16(5):284-7.
[Crossref] [Google Scholar] [PubMed]
- Zhang Z, Rousson V, Lee WC, Ferdynus C, Chen M, Qian X, et al. Decision curve analysis: A technical note. Ann Transl Med 2018;6(15):308.
[Crossref] [Google Scholar] [PubMed]
- Hocking WG, Hu P, Oken MM, Winslow SD, Kvale PA, Prorok PC, et al. Lung cancer screening in the randomized prostate, lung, colorectal, and ovarian (PLCO) cancer screening trial. J Natl Cancer Inst 2010;102(10):722-31.
[Crossref] [Google Scholar] [PubMed]
- Schuller HM, Al-Wadei HA, Majidi M. Gamma-aminobutyric acid, a potential tumor suppressor for small airway-derived lung adenocarcinoma. Carcinogenesis 2008;29(10):1979-85.
[Crossref] [Google Scholar] [PubMed]
- Ma YC, Fan WJ, Rao SM, Gao L, Bei ZY, Xu ST. Effect of Furin inhibitor on lung adenocarcinoma cell growth and metastasis. Cancer Cell Int 2014;14(1):1-6.
[Crossref] [Google Scholar] [PubMed]
- Lee Y, Han JY, Kim HT, Yun T, Lee GK, Kim HY, et al. Impact of EGFR tyrosine kinase inhibitors versus chemotherapy on the development of leptomeningeal metastasis in never smokers with advanced adenocarcinoma of the lung. J Neurooncol 2013;115(1):95-101.
[Crossref] [Google Scholar] [PubMed]
- Li L, Wang T, Hu M, Zhang Y, Chen H, Xu L. Metformin overcomes acquired resistance to EGFR TKIs in EGFR-mutant lung cancer via AMPK/ERK/NF-κB signaling pathway. Front Oncol 2020:1605.
[Crossref] [Google Scholar] [PubMed]
- Sarhan J, Liu BC, Muendlein HI, Li P, Nilson R, Tang AY, et al. Caspase-8 induces cleavage of gasdermin D to elicit pyroptosis during Yersinia infection. Proc Natl Acad Sci USA 2018;115(46):E10888-97.
[Crossref] [Google Scholar] [PubMed]
- Wang Z, Guo LM, Zhou HK, Qu HK, Wang SC, Liu FX, et al. Using drugs to target necroptosis: Dual roles in disease therapy. Histol Histopathol 2018;33(8):773-89.
[Crossref] [Google Scholar] [PubMed]
- Davies KA, Tanzer MC, Griffin MD, Mok YF, Young SN, Qin R, et al. The brace helices of MLKL mediate interdomain communication and oligomerisation to regulate cell death by necroptosis. Cell Death Differ 2018;25(9):1567-80.
[Crossref] [Google Scholar] [PubMed]
- Nugues AL, El Bouazzati H, Hetuin D, Berthon C, Loyens A, Bertrand E, et al. RIP3 is downregulated in human myeloid leukemia cells and modulates apoptosis and caspase-mediated p65/RelA cleavage. Cell Death Dis 2014;5(8):e1384.
[Crossref] [Google Scholar] [PubMed]
- Strilic B, Yang L, Albarrán-Juárez J, Wachsmuth L, Han K, Müller UC, et al. Tumour-cell-induced endothelial cell necroptosis via death receptor 6 promotes metastasis. Nature 2016;536(7615):215-8.
[Crossref] [Google Scholar] [PubMed]
- Jiao D, Cai Z, Choksi S, Ma D, Choe M, Kwon HJ, et al. Necroptosis of tumor cells leads to tumor necrosis and promotes tumor metastasis. Cell Res 2018;28(8):868-70.
[Crossref] [Google Scholar] [PubMed]
- Seifert L, Werba G, Tiwari S, Giao Ly NN, Alothman S, Alqunaibit D, et al. The necrosome promotes pancreatic oncogenesis via CXCL1 and Mincle-induced immune suppression. Nature 2016;532(7598):245-9.
[Crossref] [Google Scholar] [PubMed]
- Zhang J, Chen Y, Chen K, Huang Y, Xu X, Chen Q, et al. IL-33 drives the antitumour effects of dendritic cells via upregulating CYLD expression in pulmonary adenocarcinoma. Artif Cells Nanomed Biotechnol 2019;47(1):1335-41.
- Diao Y, Geng W, Fan X, Cui H, Sun H, Jiang Y, et al. Low CD1c+ myeloid dendritic cell counts correlated with a high risk of rapid disease progression during early HIV-1 infection. BMC Infect Dis 2015;15(1):1-8.
- Yang M, Feng Y, Yue C, Xu B, Chen L, Jiang J, et al. Lower expression level of IL-33 is associated with poor prognosis of pulmonary adenocarcinoma. PLoS One 2018;13(3):e0193428.
[Crossref] [Google Scholar] [PubMed]
- Long W, Li Q, Zhang J, Xie H. Identification of key genes in the tumor microenvironment of lung adenocarcinoma. Med Oncol 2021;38(7):1-4.
[Crossref] [Google Scholar] [PubMed]
- Marzollo A, Conti F, Rossini L, Rivalta B, Leonardi L, Tretti C, et al. Neonatal manifestations of chronic granulomatous disease: MAS/HLH and necrotizing pneumonia as unusual phenotypes and review of the literature. J Clin Immunol 2021:1-3.
[Crossref] [Google Scholar] [PubMed]
- Baritaud M, Cabon L, Delavallée L, Galán-Malo P, Gilles ME, Brunelle-Navas MN, et al. AIF-mediated caspase-independent necroptosis requires ATM and DNA-PK-induced histone H2AX Ser139 phosphorylation. Cell Death Dis 2012;3(9):e390.
- Wang A, Ning Z, Lu C, Gao W, Liang J, Yan Q, et al. USP22 induces cisplatin resistance in lung adenocarcinoma by regulating γH2AX-mediated DNA damage repair and Ku70/bax-mediated apoptosis. Front Pharmacol 2017;8:274.
[Crossref] [Google Scholar] [PubMed]
- Wang Z, Wang X. miR‐122‐5p promotes aggression and epithelial‐mesenchymal transition in triple‐negative breast cancer by suppressing charged multivesicular body protein 3 through mitogen‐activated protein kinase signaling. J Cell Physiol 2020;235(3):2825-35.
[Crossref] [Google Scholar] [PubMed]
- Al-Dherasi A, Huang QT, Liao Y, Al-Mosaib S, Hua R, Wang Y, et al. A seven-gene prognostic signature predicts overall survival of patients with lung adenocarcinoma (LUAD). Cancer Cell Int 2021;21(1):1-6.
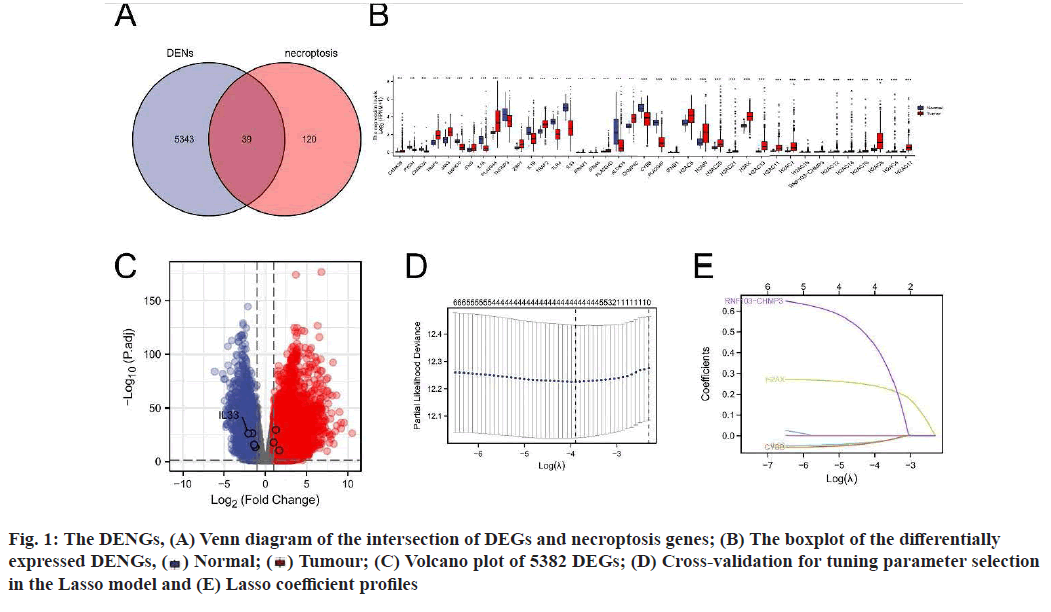
 ) Normal; (
 ) Tumour; (C) Volcano plot of 5382 DEGs; (D) Cross-validation for tuning parameter selection
in the Lasso model and (E) Lasso coefficient profiles

 ) Normal; (
 ) Tumor;
(B) The heat map of 4 NRGs in patients with LUAD and (C) The risk score, survival status of 4 NRGs in patients with LUAD,
Risk group, (
 ) Low; (
 ) High; Status, (
 ) 0; (
 ) 1
) 1 