- *Corresponding Author:
- K. R. Iyer
Department of Pharmaceutical Chemistry, Bombay College of Pharmacy, Kalina, Santacruz (E) Mumbai 400 098, India
E-mail: krishna.iyer@bcp.edu.in
| Date of Received | 14 October 2021 |
| Date of Revision | 28 April 2022 |
| Date of Acceptance | 25 January 2023 |
| Indian J Pharm Sci 2023;85(1):53-63 |
This is an open access article distributed under the terms of the Creative Commons Attribution-NonCommercial-ShareAlike 3.0 License, which allows others to remix, tweak, and build upon the work non-commercially, as long as the author is credited and the new creations are licensed under the identical terms
Abstract
We have investigated the effects of methanol, acetonitrile, dimethyl sulphoxide or dioxane on enzyme kinetic parameters (Km and Vmax) of p-nitrophenol hydroxylation, phenacetin deethylation and metoprolol metabolism in rat liver microsomes, at different solvent concentrations. In the case of p-nitrophenol hydroxylation, methanol (0.1 %-0.75 % v/v) and dimethyl sulphoxide (0.01 %-0.075 % v/v) showed 1.3 and 2.5-fold increase respectively, in the Km with a less marked effect on the Vmax. In contrast, dimethyl sulphoxide (0.1 %-0.75% v/v) showed a 1.96-fold decrease in the Vmax. Unlike, methanol and dimethyl sulphoxide, acetonitrile showed activation of the p-nitrophenol hydroxylation activity as indicated by a 0.7-fold decrease in the Km. In the case of metoprolol metabolism, dioxane resulted in a 1.5 to 3.1-fold increase in the Km of all the three metabolite formation pathways in concentration dependent manner, with less marked effect on Vmax of the reaction. Interestingly, while acetonitrile did not affect the Km for metabolite 1 and 2 formation, the Km of metabolite 3 formation was decreased in a concentration dependent manner again with little effect on all the three Vmax values. Further, methanol had little to no effect on the Vmax of metabolite 1 and 2 formation while metabolite 3 formation was increased by 2-fold. The Km of all three metabolite formations was found to be decreased in presence of methanol. The phenacetin deethylation activity in rat liver microsomes followed atypical kinetics. Methanol and dimethyl sulphoxide did not affect the auto activation kinetics at concentration range studied. Dimethyl sulphoxide and dioxane appeared to be unsuitable for characterizing the Cytochrome450 mediated reactions because they showed a very significant effect on the Vmax/Km ratio, starting at concentrations of 0.025 % v/v and 0.25 % v/v, respectively. Methanol and acetonitrile at concentration <0.5 % v/v appeared to be acceptable solvents for solubilization of substrates metabolized by Cytochrome450s.
Keywords
Cytochrome450, p-nitrophenol, phenacetin, metoprolol, rat liver microsomes, methanol, enzyme kinetics, dimethyl sulphoxide, acetonitrile, high-performance liquid chromatography, Km and Vmax
The poor aqueous solubility of majority of lead molecules in the drug discovery programs necessitates the use of various water miscible organic solvents as co-solvents to obtain desired dissolved concentrations in a variety of aqua based in vitro assays[1]. More specifically, assays like metabolic stability, metabolite profiling, Cytochrome (CYP) inhibition or induction, uridine glucuronyl transferases inhibition, reaction phenol typing experiments are all aqueous buffer-based assays. These assays provide crucial information in drug discovery like identifying routes of metabolism, evaluation of drug-drug interaction potential and prediction of the human clearance of lead molecules and are important for prioritizing and making a gono- go decision on the progress of the lead molecule. Dimethyl Sulphoxide (DMSO), Methanol (MeOH) and\or Acetonitrile (ACN) are regularly used as cosolvents for the solubilization of the poorly soluble molecules, typically at final concentration of 1 %-2 % v/v.
The above stated solvents have been reported to alter the activity of enzymes involved in biotransformation of drugs[2-6], especially the CYP450 enzymes, that are the predominant drug metabolizing enzyme family[7]. These studies have reported effects of organic solvents on the in vitro CYP450 activities in human liver microsomes[2-6], hepatocytes[4], complementary Deoxyribonucleic Acid (cDNA) expressed microsomes[2] and Rat Liver Microsomes (RLM)[8-10]. All these reports have investigated effect of organic solvents on CYP450 enzyme activity using suitable probe substrate reaction. The effects of solvents are expressed as the percentage of change in the activity of the CYP450 enzymes, in presence of different organic solvents, at varying concentrations, with respect to the solvent free incubations. Although, it is obvious that changes in activity caused by organic solvents could be a result of changes in enzyme kinetic parameters (either the Michealis-Menten constant (Km) and/ or the maximum Velocity (Vmax) of the enzyme reaction), the effect of organic solvents on enzyme kinetics has been sparsely investigated.
In the present study, we have investigated effect of MeOH, ACN, DMSO and/or Dioxane (Diox) on the kinetic parameters of p-Nitrophenol (PNP) hydroxylation, metoprolol metabolism and phenacetin deethylation activity in RLM. This mechanistic study would allow for the dissection of the influence of these solvents either at the level of enzyme substrate complex formation (changes in Km) and/or at the catalysis step (changes in Vmax).
Materials and Methods
Metoprolol Succinate (METO), Pindolol and Paracetamol (PARA) were obtained as gift samples from Indian Pharmaceutical Combine Association (IPCA) Laboratories Ltd., Mumbai, Piramal Life Science Pvt. Ltd., Mumbai, and MKR Drug Testing Laboratory, Mumbai, respectively. Phenacetin was purchased from Himedia Laboratories Pvt. Ltd, Mumbai. Nicotinamide Adenine Dinucleotide Phosphate (NADPH) reduced tetra sodium salt and salicylamide were obtained from SRL Chemicals Ltd. Mumbai. p-Nitrocatechol (PNC) was obtained from Lancaster chemicals, Mumbai. PNP, caffeine anhydrous (AR), perchloric acid (70 % v/v) AR, ethylene diamine tetraacetic acid AR, dipotassium hydrogen phosphate AR and Diox AR were obtained from S. D. Fine- Chem Ltd. Mumbai. ACN High-Performance Liquid Chromatography (HPLC) grade and MeOH, HPLC grade were obtained from Qualigens Ltd., Mumbai. DMSO were obtained from Merck India Ltd. RLM were prepared in house using livers obtained from the animals sacrificed as a part of other experiments which were approved by the institutional ethical committee from department of pharmacology, Bombay college of pharmacy, Mumbai. RLM were prepared using calcium aggregation method[11] and characterized for protein and CYPP450 content as described by Patil et al.[9]. All other chemicals used in the present study were of analytical grade.
Effects of organic solvents on the enzyme kinetic parameters (Km and Vmax) of PNP hydroxylation, metoprolol metabolism and phenacetin deethylation activity:
The effect of MeOH, ACN and DMSO or Diox on enzyme kinetic parameters (Km and Vmax) of PNP hydroxylation, metoprolol metabolism and phenacetin deethylation activities in RLM at different solvent concentrations were investigated. In the case of PNP hydroxylation activity a tenfold lower concentration of DMSO was also studied owing to its pronounced inhibitory effect on PNP hydroxylation (preliminary studies, data not shown). In all the three studies, CYP450 concentration and incubation time was optimized such that the product formation was linear and initial velocity conditions were maintained.
PNP hydroxylation activity:
The effect of ACN, DMSO and MeOH on Km and Vmax of PNP hydroxylation activity was evaluated by incubating different concentration of PNP (16, 32, 64, 128, 256 or 512 μM) in the presence of 0, 0.1, 0.25, 0.5 or 0.75 % v/v respectively, of organic solvent. 10 ml of PNP (0.8, 1.6, 3.2, 6.4, 12.8 or 25.6 mM) containing 0, 5, 12.5, 25 or 37.5 % v/v of organic solvent were incubated with 65 μl of RLM (final CYP450 content 1.05 nmol/ml). Final volume of reaction was adjusted to 500 μl with 0.05 M phosphate buffer, pH 7.4. The reaction was initiated by addition of 50 μl of 6 mM NADPH and maintained at 37° on water bath shaker for 30 min. The reaction was then terminated by addition of 250 μl perchloric acid (0.6 M). Then, 50 μl of 350 μg/ ml salicylamide as internal standard was added to each tube and samples were stored at -70° until analysis. For analysis, ammonium sulfate (~500 mg) was added to each tube. Samples were then extracted using 4 ml diethyl ether and organic layer was allowed to separate. A dry ice-acetone bath was prepared and the samples were placed in the bath for about 20 s. After freezing of the bottom aqueous layer, upper ether layer was decanted and collected in 15 ml glass centrifuge tubes. The ether layer was then evaporated on a water bath at 40°. The residue was reconstituted in 200 μl of mobile phase. HPLC analysis of the samples were carried out using a Dionex HPLC instrument equipped with P680 HPLC pump, ASI 100 automated sample injector and Ultra Variable-pressure Detector (UVD) 340U Photo Diode Array (PDA) detector. Stationary phase used was a reverse phase Thermo Hypersil BDS, C18 (250×4.6 mm, 5 μM) column. The analytes were eluted using mobile phase containing 0.1 % v/v formic acid and ACN in the ratio 65:35 at flow rate of 1 ml/min and detected at 345 nm. The concentration of the metabolite (PNC) formed in the reaction was determined by the standard curve of PNC, prepared in similar manner as of the reaction mixture. Each experiment was conducted in duplicate. Retention times of salicylamide, PNC and PNP were 4.5, 5.0 and 7.1 min, respectively.
Metoprolol metabolism activity:
The effect of ACN, Diox and MeOH on Km and Vmax of METO metabolism activity was evaluated by incubating different concentration of METO (5, 10, 20, 30, 40, 60 or 80 μM) containing 0, 0.1, 0.25, 0.5 or 0.75 % v/v of solvents. 10 ml of different concentrations of METO (0.25, 0.5, 1, 1.5, 2, 3 or 4 mM) containing 0, 5, 12.5, 25 or 37.5 % v/v of organic solvents were incubated with 15 μl of RLM (final CYP450 content 0.25 nmol/ ml). The volume of reaction was adjusted to 500 μl with 0.05 M phosphate buffer, pH 7.4. The reaction was initiated by addition of 50 μl of 6 mM NADPH and maintained at 37° on water bath shaker for 30 min. The reaction was then terminated by addition of 100 μl of 4.2 % v/v perchloric acid. Then, 50 μl of Pindolol (0.4 mg/ml) as internal standard was added to each tube. Samples were stored at -70° until analysis. For analysis, samples were then thawed and 350 μl of HPLC mobile phase was added. The tubes were then centrifuged at 7000 xg for 10 min and 50 μl of the supernatant was injected onto HPLC for analysis. A Jasco HPLC instrument equipped with PU2080 plus HPLC pump, manual Rheodyne injector with a fluorescence detector (FP2080 plus) was used and chromatograms were acquired using Borwin 1.50 software. Stationary phase used was a reverse phase XTERRA Waters, C18 (250×4.6 mm, 5 μM) column. Mobile phase containing 0.5 % v/v triethylamine pH 3.0 (adjusted with orthophosphoric acid) and ACN was used in the ratio of 85:15. The analytes were eluted at flow rate of 1 ml/min and detected at excitation and emission wavelength of 228 and 310 nm, respectively. The incubation of METO with RLM resulted in three metabolites termed as Metabolite (MET) 1, MET2 and MET3. The effect of organic solvents on enzyme kinetics of these three metabolite’s formation was studied using metabolite/ pindolol (IS) ratios comparisons. Each experiment was conducted in duplicate. The retention times of MET1, MET2 and MET3, Pindolol and METO were 5.6, 6.3, 8.5, 11.1 and 28.0 min, respectively.
Phenacetin deethylation activity:
The effect of DMSO and MeOH on Km and Vmax of phenacetin deethylation activity was evaluated by incubating different concentrations of phenacetin (10, 25, 50, 100, 200, 400 or 800 μM) containing 0, 0.1, 0.25, 0.5 or 0.75 % v/v DMSO or MeOH, respectively. 20 ml of phenacetin (0.25, 0.625, 1.25, 2.5, 5 or 10 mM) containing different concentration of each organic solvent (0, 2.5, 6.25, 12.5 or 18.75 % v/v) were incubated with 100 μl of RLM (final CYP450 content 1.63 nmol/ ml). The volume of reaction was adjusted to 500 μl with 0.05 M phosphate buffer, pH 7.4. The reaction was initiated by addition of 50 μl of 6 mM NADPH and terminated at the end of 20 min of incubation by addition of 250 μl of 6 % v/v perchloric acid. Finally, 50 μl of caffeine (15 μg/ml) was added in each tube. Samples were stored at -70° until analysis. For analysis, samples were thawed and centrifuged at 7000 xg for 10 min and 100 μl of supernatant was injected onto HPLC analysis. A Dionex HPLC instrument equipped with P680 HPLC pump, ASI 100 automated sample injector, UVD 340U PDA detector was used and chromatograms were acquired on Chromo Leon client 6.80 SP2 version software. Stationary phase used was a reverse phase Thermo Hypersil BDS, C18 (250×4.6 mm, 5 μM) column. Mobile phase consisted of ACN and water in the ratio of 10:90 v/v. The analytes were eluted at flow rate of 1 ml/min and detected at 245 nm. The concentration of the metabolite (paracetamol, PARA) formed in the reaction was determined by the standard curve of PARA, prepared in similar manner as of the reaction mixture. Each experiment was conducted in duplicate. Retention times of PARA, caffeine and phenacetin were 5.7, 9.7 and 20.9 min, respectively.
Results and Discussion
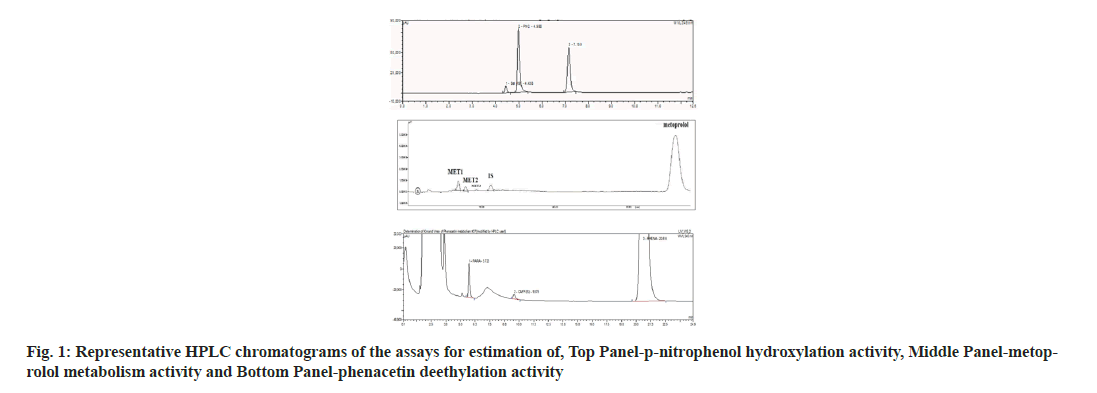
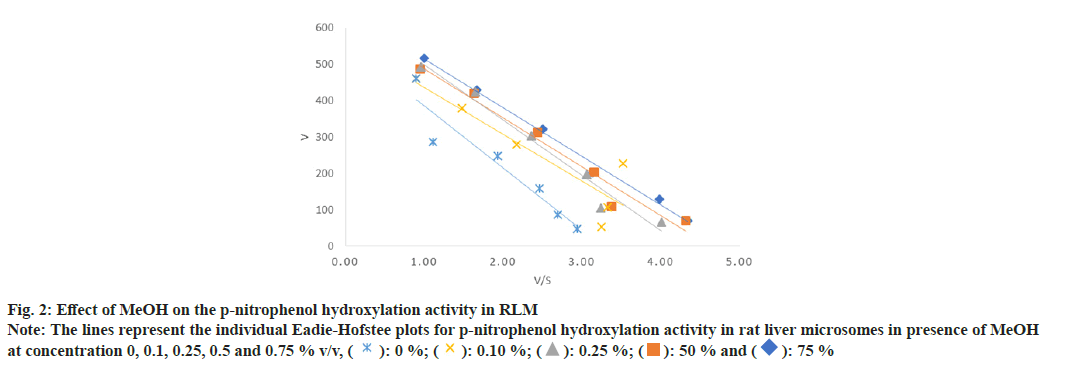
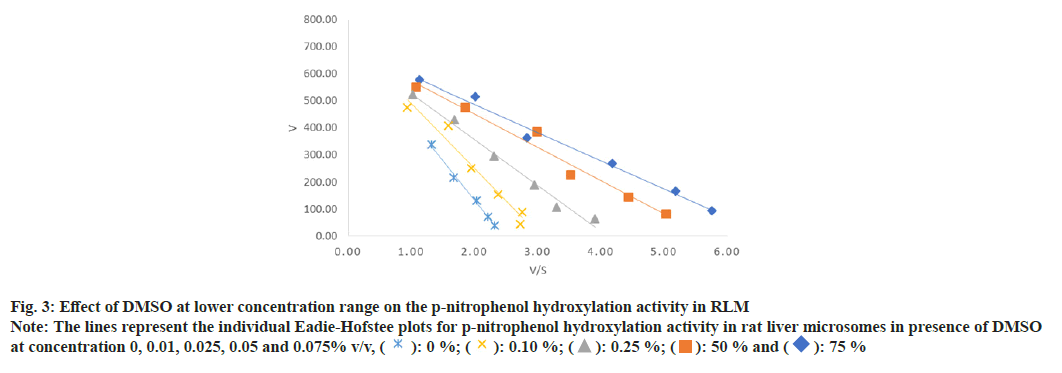
In case of PNP hydroxylation, effect of MeOH and ACN at increasing concentration (0, 0.1, 0.25, 0.5 and 0.75 % v/v) was studied, while DMSO was studied at two concentration ranges (0, 0.01, 0.025, 0.05 and 0.075 % v/v) and (0, 0.1, 0.25, 0.5 and 0.75 % v/v) due to its high inhibition activity. In case of metoprolol metabolism, effects of MeOH, ACN and Diox at increasing concentration (0, 0.1, 0.25, 0.5 and 0.75 % v/v) were studied. In case of phenacetin deethylation, effect of MeOH and DMSO at increasing concentration (0, 0.1, 0.25, 0.5 and 0.75 % v/v) was studied. Top panel-the retention times of salicylamide (SAL, IS), PNC and PNP were 4.5, 5.0 and 7.1 min. Middle Panel-the retention times of MET1, MET2, MET3, IS and metoprolol were 5.6, 6.3, 8.5, 11.1 and 28 min, respectively. Bottom panel-the retention times of PARA, caffeine and phenacetin were 5.7, 9.7 and 20.9 min are shown in fig. 1. The enzyme kinetic parameters Km and Vmax were determined using linear regression analysis of Eadie-Hofstee plot. PNP hydroxylation and in metoprolol metabolism all three metabolite’s formation followed Michaelis-Menten kinetics while, phenacetin deethylation followed atypical kinetics (auto activation kinetics). In case of PNP hydroxylation, MeOH at 0.75 % v/v and DMSO at 0.075 % v/v concentration showed around 1.3 and 2.5 fold increase in the Km, respectively, with relatively less effect on the Vmax i.e. 1.2 and 1.1 fold reduction as shown in Table 1 and Table 2. Consequently, a decrease in the Vmax/Km ratio was observed in a concentration dependent manner up to 1.5 and 2.9 fold in case of MeOH at 0.75 and DMSO at 0.075 % v/v concentration, respectively. Further, DMSO at 0.75 % showed a 2-fold decrease in the Vmax and 4.8-fold increase in Km leading to a 9.5 fold decrease in Vmax/Km ratio as shown in Table 2. Unlike, MeOH and DMSO, ACN showed activation of the PNP hydroxylation activity as indicated by the Km falling to 0.7 of the original value with a consequent increase in Vmax/Km ratio as shown in Table 1. Overall, MeOH and DMSO both resulted in a decrease in Vmax/ Km ratio while ACN caused an increase in Vmax/Km ratio. The representative Eadie- Hofstee plots of PNP hydroxylation activity in presence of MeOH, ACN and DMSO are shown in fig. 2-fig. 5.
| Organic solvent % v/v | MeOH | ACN | ||||||||||
|---|---|---|---|---|---|---|---|---|---|---|---|---|
| Km | Fold change | Vmax | Fold change | Vmax/Km | Fold change | Km | Fold change | Vmax | Fold change | Vmax/Km | Fold change | |
| 0 | 129 | - | 637 | - | 4.94 | - | 118 | - | 624 | - | 5.29 | - |
| 0.1 | 130 | 1.0 | 611 | 1.0 | 4.7 | 1.1 | 83 | 0.7 | 598 | 1.0 | 7.2 | 0.7 |
| 0.25 | 143 | 1.1 | 620 | 1.0 | 4.34 | 1.1 | 95 | 0.8 | 692 | 0.9 | 7.28 | 0.7 |
| 0.5 | 140 | 1.1 | 580 | 1.1 | 4.14 | 1.2 | 96 | 0.8 | 670 | 0.9 | 6.98 | 0.8 |
| 0.75 | 165 | 1.3 | 549 | 1.2 | 3.33 | 1.5 | 86 | 0.7 | 590 | 1.1 | 6.86 | 0.8 |
Table 1: Enzyme Kinetic Parameters (Km And Vmax) for P-Nitrophenol Hydroxylation at Varying Concentration of Meoh and Acn
Note: Fold change represented for Vmax and Vmax/Km indicate reduction in the values compared to control while for Km represents fold increase in the values compared to control
| Organic solvent % v/v | Km | Fold change | Vmax | Fold change | Vmax/Km | Fold change |
|---|---|---|---|---|---|---|
| 0 | 111 | 775 | 7.1 | |||
| 0.01 | 114 | 1.0 | 676 | 1.1 | 5.93 | 1.2 |
| 0.025 | 172 | 1.5 | 699 | 1.1 | 4.06 | 1.7 |
| 0.05 | 235 | 2.1 | 720 | 1.1 | 3.06 | 2.3 |
| 0.075 | 276 | 2.5 | 683 | 1.1 | 2.47 | 2.9 |
| 0.1 | 348 | 3.1 | 730 | 1.1 | 2.1 | 3.4 |
| 0.25 | 381 | 3.4 | 517 | 1.5 | 1.36 | 5.2 |
| 0.5 | 441 | 4.0 | 493 | 1.6 | 1.12 | 6.3 |
| 0.75 | 528 | 4.8 | 395 | 2.0 | 0.75 | 9.5 |
Table 2: Enzyme Kinetic Parameters (Km And Vmax) for P-Nitrophenol Hydroxylation at Varying Concentration of Dmso
Note: Fold change represented for Vmax and Vmax/Km indicate reduction in the values compared to control while for Km represents fold increase in the values compared to control
Fig. 2: Effect of MeOH on the p-nitrophenol hydroxylation activity in RLM
Note: The lines represent the individual Eadie-Hofstee plots for p-nitrophenol hydroxylation activity in rat liver microsomes in presence of MeOH
at concentration 0, 0.1, 0.25, 0.5 and 0.75 % v/v, ( ): 0 %; (
 ): 0.10 %; (
 ): 0.25 %; (
 ): 50 % and (
 ): 75 %
Fig. 3: Effect of DMSO at lower concentration range on the p-nitrophenol hydroxylation activity in RLM
Note: The lines represent the individual Eadie-Hofstee plots for p-nitrophenol hydroxylation activity in rat liver microsomes in presence of DMSO
at concentration 0, 0.01, 0.025, 0.05 and 0.075% v/v, ( ): 0 %; (
 ): 0.10 %; (
 ): 0.25 %; (
 ): 50 % and (
 ): 75 %
Fig. 4: Effect of DMSO on the p-nitrophenol hydroxylation activity in RLM
Note: The lines represent the individual Eadie-Hofstee plots for p-nitrophenol hydroxylation activity in rat liver microsomes in presence of DMSO
at concentration 0, 0.1, 0.25, 0.5 and 0.75% v/v, ( ): 0 %; (
 ): 0.10 %; (
 ): 0.25 %; (
 ): 50 % and (
 ): 75 %
Fig. 5: Effect of ACN on the p-nitrophenol hydroxylation activity in RLM
Note: The lines represent the individual Eadie-Hofstee plots for p-nitrophenol hydroxylation activity in rat liver microsomes in presence of ACN at
concentration 0, 0.1, 0.25, 0.5 and 0.75% v/v, ( ): 0 %; (
 ): 0.10 %; (
 ): 0.25 %; (
 ): 50 % and (
 ): 75 %
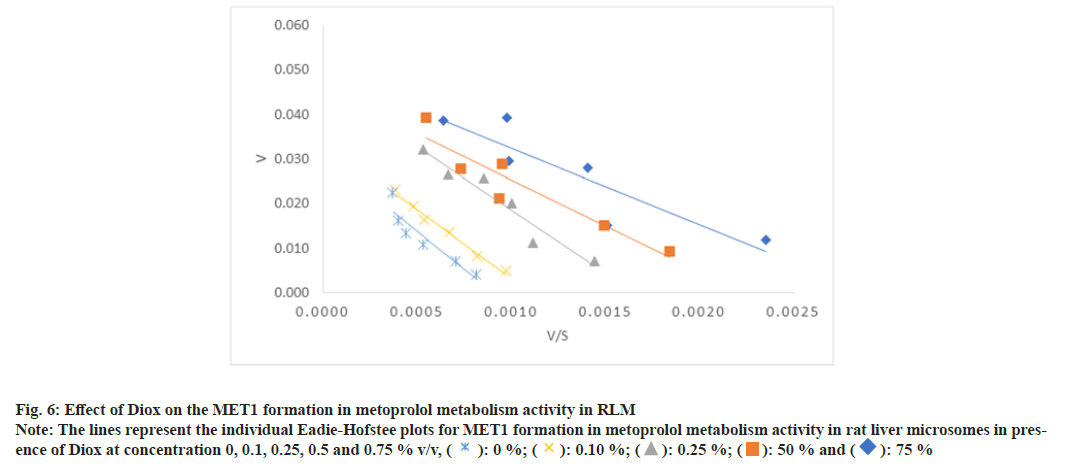
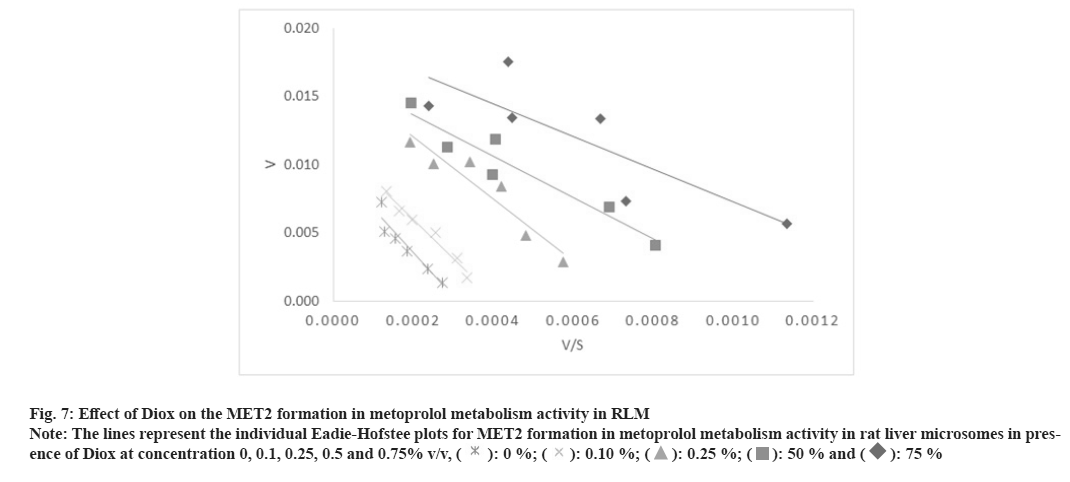
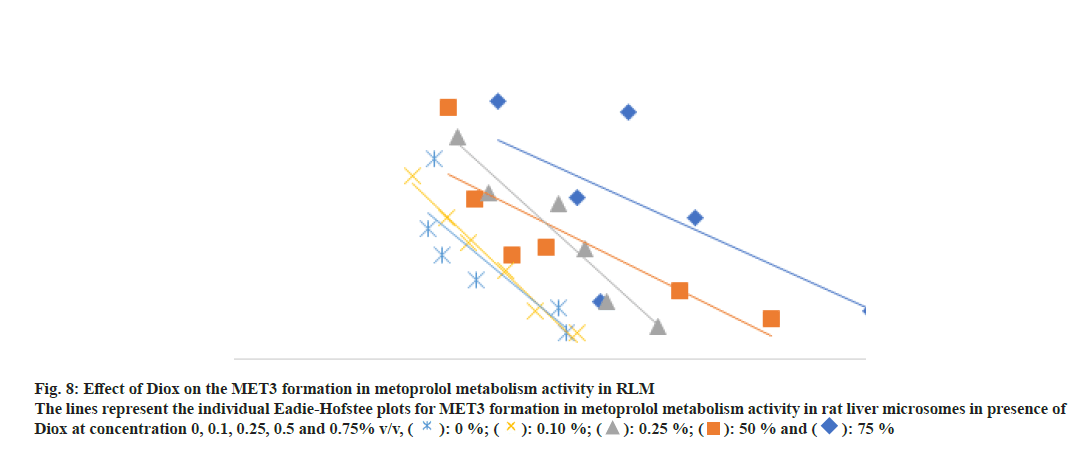
In the case of metoprolol metabolism, Diox showed a 1.5 to 3.1 fold increase in the Km for the formation of all three metabolites in a concentration dependent manner with a lesser effect on Vmax of the reaction (1.2 to 1.8 fold decrease), thus yielding a 1.8 to 5.6 fold decrease in Vmax/Km ratio as shown in Table 3-Table 5. The representative Eadie-Hofstee plots for metoprolol metabolism activity in RLM are shown in fig. 6-fig. 8. ACN did not affect the Km of MET2 formation while Km of MET1 formation was slightly increased by a factor of 1.6 and Km for MET3 formations by a factor of 0.5 of the original value till 0.5 % v/v ACN in a concentration dependent manner. ACN had less marked effect on Vmax values of all three metabolite formation rates. The Vmax/Km ratio for formation of all three metabolite did not vary in presence of ACN. Further, MeOH had little effect on the Vmax of MET1 and MET2 formation, however, the Vmax of MET3 formation was found to be decreased 2-fold. In general, the Km values for all three metabolite formation pathways were found to be decreased as compared to control incubation. The respective Eadie-Hofstee plots for enzyme kinetic parameter determination in presence of MeOH and ACN are not shown here, for sake of brevity.
| Organic solvent % v/v | Km | Fold change | Vmax | Fold change | Vmax/Km | Fold change |
|---|---|---|---|---|---|---|
| MeOH | ||||||
| 0 | 31.5 | 0.025 | 0.0008 | |||
| 0.1 | 33.0 | 1.0 | 0.023 | 1.1 | 0.0007 | 1.1 |
| 0.25 | 27.0 | 0.9 | 0.024 | 1.0 | 0.0009 | 0.9 |
| 0.5 | 22.3 | 0.7 | 0.02 | 1.3 | 0.0009 | 0.9 |
| 0.75 | 19.6 | 0.6 | 0.023 | 1.1 | 0.0012 | 0.7 |
| ACN | ||||||
| 0 | 22.0 | 0.023 | 0.0010 | |||
| 0.1 | 23.7 | 1.1 | 0.023 | 1.0 | 0.0010 | 1.1 |
| 0.25 | 25.7 | 1.2 | 0.024 | 1.0 | 0.0009 | 1.1 |
| 0.5 | 28 | 1.3 | 0.024 | 1.0 | 0.0009 | 1.2 |
| 0.75 | 35.0 | 1.6 | 0.023 | 1.0 | 0.0007 | 1.6 |
| Diox | ||||||
| 0 | 18.6 | 0.054 | 0.003 | |||
| 0.1 | 19.4 | 1.0 | 0.047 | 1.1 | 0.002 | 1.2 |
| 0.25 | 33.7 | 1.8 | 0.053 | 1.0 | 0.002 | 1.8 |
| 0.5 | 28.1 | 1.5 | 0.032 | 1.7 | 0.001 | 2.6 |
| 0.75 | 36.0 | 1.9 | 0.032 | 1.7 | 0.001 | 3.3 |
Table 3: Enzyme Kinetic Parameters (Km And Vmax) for Met1 Formation of Metoprolol Metabolism at Varying Concentration of Organic Solvents
Note: Fold change represented for Vmax and Vmax/Km indicate reduction in the values compared to control while for Km represents fold increase in the values compared to control
| Organic solvent % v/v | Km | Fold change | Vmax | Fold change | Vmax/Km | Fold change |
|---|---|---|---|---|---|---|
| MeOH | ||||||
| 0 | 14.7 | 0.005 | 0.00034 | |||
| 0.1 | 21.4 | 1.5 | 0.005 | 1.0 | 0.00023 | 1.5 |
| 0.25 | 16.7 | 1.1 | 0.005 | 1.0 | 0.00030 | 1.1 |
| 0.5 | 10.9 | 0.7 | 0.004 | 1.3 | 0.00037 | 0.9 |
| 0.75 | 7.5 | 0.5 | 0.003 | 1.7 | 0.00040 | 0.9 |
| ACN | ||||||
| 0 | 11.3 | 0.011 | 0.00098 | |||
| 0.1 | 14.3 | 1.3 | 0.011 | 1.0 | 0.00077 | 1.3 |
| 0.25 | 12.2 | 1.1 | 0.010 | 1.1 | 0.00082 | 1.2 |
| 0.5 | 13.8 | 1.2 | 0.011 | 1.0 | 0.00080 | 1.2 |
| 0.75 | 15.0 | 1.3 | 0.010 | 1.1 | 0.00067 | 1.5 |
| Diox | ||||||
| 0 | 11.1 | 0.018 | 0.00163 | |||
| 0.1 | 10.7 | 1.0 | 0.013 | 1.4 | 0.00121 | 1.3 |
| 0.25 | 26.8 | 2.4 | 0.018 | 1.0 | 0.00067 | 2.4 |
| 0.5 | 22.6 | 2.0 | 0.01 | 1.8 | 0.00044 | 3.7 |
| 0.75 | 34.4 | 3.1 | 0.01 | 1.8 | 0.00029 | 5.6 |
Table 4: Enzyme Kinetic Parameters (Km And Vmax) for Met2 Formation of Metoprolol Metabolism at Varying Concentration of Organic Solvents
Note: Fold change represented for Vmax and Vmax/Km indicate reduction in the values compared to control while for Km represents fold increase in the values compared to control
| Organic solvent % v/v | Km | Fold change | Vmax | Fold change | Vmax/Km | Fold change |
|---|---|---|---|---|---|---|
| MeOH | ||||||
| 0 | 65.5 | 0.008 | 0.00012 | |||
| 0.1 | 26.4 | 0.4 | 0.004 | 2.0 | 0.00015 | 0.8 |
| 0.25 | 43.3 | 0.7 | 0.007 | 1.1 | 0.00016 | 0.8 |
| 0.5 | 12.4 | 0.2 | 0.003 | 2.7 | 0.00024 | 0.5 |
| 0.75 | 28.7 | 0.4 | 0.004 | 2.0 | 0.00014 | 0.9 |
| ACN | ||||||
| 0 | 40.2 | 0.008 | 0.00020 | |||
| 0.1 | 23.9 | 0.6 | 0.006 | 1.3 | 0.00025 | 0.8 |
| 0.25 | 28.9 | 0.7 | 0.006 | 1.3 | 0.00021 | 1 |
| 0.5 | 20.3 | 0.5 | 0.005 | 1.6 | 0.00025 | 0.8 |
| 0.75 | 62.2 | 1.5 | 0.01 | 0.8 | 0.00016 | 1.2 |
| Diox | ||||||
| 0 | 40.7 | 0.012 | 0.00029 | |||
| 0.1 | 38.7 | 1.0 | 0.010 | 1.2 | 0.00026 | 1.1 |
| 0.25 | 75.7 | 1.9 | 0.014 | 0.9 | 0.00019 | 1.6 |
| 0.5 | 56.6 | 1.4 | 0.009 | 1.3 | 0.00016 | 1.9 |
| 0.75 | 61.9 | 1.5 | 0.010 | 1.2 | 0.00016 | 1.8 |
Table 5: Enzyme Kinetic Parameters (Km And Vmax) for Met3 Formation of Metoprolol Metabolism at Varying Concentration of Organic Solvents
Note: Fold change represented for Vmax and Vmax/Km indicate reduction in the values compared to control while for Km represents fold increase in the values compared to control
Fig. 6: Effect of Diox on the MET1 formation in metoprolol metabolism activity in RLM
Note: The lines represent the individual Eadie-Hofstee plots for MET1 formation in metoprolol metabolism activity in rat liver microsomes in presence
of Diox at concentration 0, 0.1, 0.25, 0.5 and 0.75 % v/v, ( ): 0 %; (
 ): 0.10 %; (
 ): 0.25 %; (
 ): 50 % and (
 ): 75 %
Fig. 7: Effect of Diox on the MET2 formation in metoprolol metabolism activity in RLM
Note: The lines represent the individual Eadie-Hofstee plots for MET2 formation in metoprolol metabolism activity in rat liver microsomes in presence
of Diox at concentration 0, 0.1, 0.25, 0.5 and 0.75% v/v, ( ): 0 %; (
 ): 0.10 %; (
 ): 0.25 %; (
 ): 50 % and (
 ): 75 %
Fig. 8: Effect of Diox on the MET3 formation in metoprolol metabolism activity in RLM
The lines represent the individual Eadie-Hofstee plots for MET3 formation in metoprolol metabolism activity in rat liver microsomes in presence of
Diox at concentration 0, 0.1, 0.25, 0.5 and 0.75% v/v, ( ): 0 %; (
 ): 0.10 %; (
 ): 0.25 %; (
 ): 50 % and (
 ): 75 %
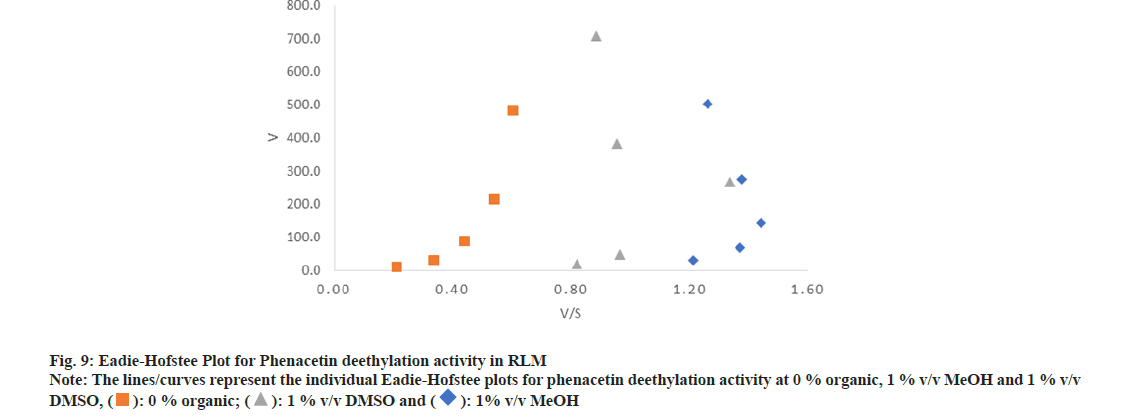
In the case of phenacetin deethylation activity, MeOH and DMSO did not affect the auto activation kinetics at the concentration range studied. A representative Eadie-Hofstee plot for phenacetin deethylation activity showing auto activation phenomenon was identified by hook shaped curve as shown in fig. 9. However, substantial inhibitory effect was observed on the amount of paracetamol formed in presence of DMSO compared to MeOH, as evident by the leftward shift in the curve in Eadie-Hofstee plot (fig. 9).
The organic solvents selected in the present study for evaluation of their effects on enzyme kinetics were based on the results of our preliminary studies. Based on those results, organic solvents with least, intermediate and most inhibitory activity were selected. In case of PNP hydroxylation activity, ACN, MeOH and DMSO were selected, as ACN showed activation, MeOH showed concentration dependent inhibitory effect but to a much lesser extent compared to DMSO[9]. In case of metoprolol metabolism activity, ACN, MeOH and Diox were selected, as ACN and MeOH showed less inhibition and Diox showed the highest inhibitory potential[10]. For phenacetin metabolism, MeOH and DMSO were selected as the former was reported to show less inhibition while latter was found to show a high inhibitory effect on phenacetin metabolism[8,12].
In order to understand the mechanistic basis for the effect of organic solvents on CYP450 activities, we evaluated the effect of organic solvents on the kinetic parameters, Km and Vmax of PNP hydroxylation, metoprolol metabolism and phenacetin deethylation activity in RLM. In the classic steady state equation (Michaelis Menten equation), Km for a given enzyme-substrate pair is derived as the ratio of rate constants of the reaction [(k1+k2)/k1)], while Vmax is the product of rate constant of the catalysis step and total enzyme concentration (k2 (Et)). Thus, any effect observed on the Km will indicate effect on either binding of substrate and/or its catalysis and any effect observed on Vmax will be indicative of an alteration in k2 or (kcat) or the total enzyme content. Another interesting aspect of solvent effects on CYP450 activity is that the effects of solvents are known to vary with the substrate/enzyme pair. Tang et al.[6], have reported that ACN shows a substrate dependent effect on CYP2C9 activity in human liver microsomes.
They reported that ACN increased diclofenac hydroxylation and tolbutamide hydroxylation activity but decreased celecoxib hydroxylation activity. Further, hydroxylation of phenytoin was found to be relatively resistant to ACN, indicating arguably that the effect of organic solvents is more at the level of substrate than at the level of enzyme. Metoprolol incubation with RLM gave three metabolites. If the overall effect of organic solvent remained same for each metabolite formation, it would suggest that the effect is more at the substrate level than at the enzyme level. On the other hand, if varying effects of organic solvents are observed for each metabolite formation, then it would be suggestive that these organic solvents either alter the binding of substrate to the enzyme active site and/or catalysis. Also, the differential effects on the formation of each metabolite may reveal the involvement of multiple isoforms involved in catalysis. The effect of organic solvents on the kinetics of formation of all three metabolites was therefore studied.
Phenacetin deethylation did not follow Michaelis- Menten kinetics, as it was evident from the hook shaped curve in Eadie-Hofstee plot. Thus, Km and Vmax of this reaction could not be estimated with the optimized experimental conditions. The MeOH and DMSO at the concentration range studied did not change the reaction kinetics, however, in comparison with MeOH, DMSO showed substantial inhibitory effect on the rate of paracetamol formation in a concentration dependent manner at the concentration range studied.
In case of PNP hydroxylation activity, both MeOH and the low concentration range of DMSO showed increase in the Km with a less marked effect on Vmax. In contrast, DMSO at higher concentration range showed increase in Km with substantial decrease in Vmax. Unlike, MeOH and DMSO, ACN showed activation of the PNP hydroxylation activity as indicated by a decrease in the Km.
In case of metoprolol metabolism activity, Diox showed increase in the Km of MET1, MET 2 and MET3 formations in concentration dependent manner with little effect on Vmax of all metabolites. While, ACN did not affect Km and Vmax of MET2 formations, a slight increase in Km of MET1 formation was seen. Interestingly, Km of MET3 formation was slightly decreased. In presence of MeOH, we did not observe any specific concentration dependent change in Km for formation of all three metabolites. However, the Km values were decreased as compared to control incubation. In most of the cases, pronounced effect was observed on Km and not on Vmax of the reaction indicating that the organic solvent had lesser effects on the catalysis event of enzymatic reaction. In particular, ACN caused decrease in Km for PNP hydroxylation and MET3 formation from metoprolol (with little effect on MET1 and MET2 formation) indicating that solvent does affect the active site of CYP450 enzymes resulting in altered binding of substrate. This was also evident from the findings of Kumar et al.[13], who have shown that the binding of nelfinavir to CYP3A4 enzyme improves in presence of ethanol. Kumar et al.[13], reported that the spectral dissociation constant of nelfinavir decreases from 0.227 to 0.041 μM in presence of 20 mM ethanol. Similarly, Backes et al.[14] found that binding of ethyl benzene to the RLM varies with the organic solvents (apparent binding constant of ethyl benzene was found to be 28, 23, 16 and 25 mM in presence of MeOH, ethanol, ACE and n-propyl acetate, respectively) thus, indicating that the solvents seem to affect the first step of catalysis i.e. binding of the substrate to the active site of CYP450.
Recently, Rokitta et al.[15] also studied the effects of MeOH, ethanol, ACN and DMSO (1 % to 4 % v/v) on Km and Vmax for the in vitro metabolism of midazolam to 1-hydroxymidazolam and caffeine to Para xanthine. However, unlike our study they used recombinant CYP3A4 and CYP1A2. The authors found that ACN enhanced the rate of Para xanthine formation by CYP1A2 as indicated by increase in Vmax value (and a decrease in Km value) while other solvents had decreased both Km and Vmax value and overall, there was no significant change in Vmax/Km ratio of Para xanthine formation. In the case of midazolam, metabolite formation by CYP3A4 was decreased in presence of DMSO. However; other solvents did not affect the rate of 1-hydroxy midazolam formation as indicated by the changes in Vmax. The authors also noted that the organic solvents at concentration range studied did not have any systematic effect on the Km of midazolam metabolism. Overall, the authors concluded that “effects of solvents may influence enzyme kinetic parameters beyond a mere change in apparent activity”. Further they stated “What remains is the determination to which extent these effects affect the in vitro-in vivo extrapolations and which solvents are most appropriate”.
More recently, the role of transporters in absorption, distribution and elimination is getting significant attention. In this regard, the effect of organic solvents on drug transporters is not documented. However the nonionic surfactant[16] and polyethylene glycol[17] are known to influence activity of transporters in cancer coli-2 cell lines. In future, it may be of interest to evaluate whether organic solvents also have an effect on the drug transporters. We feel that organic solvents may also modulate transporter activity. Overall, DMSO and Diox appeared to be unsuitable solvents for characterizing the CYP450 mediated reactions because they showed significant effect on the Vmax/Km ratio (an indicator of intrinsic clearance). MeOH and ACN at concentration range <0.5 % v/v appeared to be acceptable solvents for substrate solubilization while evaluating CYP450 activity. Further, in many cases, pronounced effect was observed on Km and not on Vmax of a reaction indicating that the solvent had lesser effects on the catalysis event of enzymatic reaction. The organic solvents which were identified as strong inhibitors of the reaction have affected the Vmax of reaction in addition to effect on the Km. Overall, the effect of organic solvents on CYP450 activity probably represents a combined effect which includes disruption of the phospholipid bilayer housing CYP450 system, alteration of binding of substrate with the active site of enzyme, enzyme inactivation, also in some cases competitive metabolism and metabolism dependent inhibition. However, the exact mechanism and the relative contribution of above stated factors on the activity of the CYP450 enzyme are difficult to deconvolute. Clearly, the data suggests that solvents have very complicated effect on the activity of CYP450s and one must be very cautious about the choice of solvents and its concentration while performing such studies.
Acknowledgement:
SHK is a Bristol Myers Squibb (BMS) Research Fellow, DD is an AMRF fellow and authors thank BMS for financial support.
Conflict of interest:
The authors declared no conflict of interests.
References
- Savjani KT, Gajjar AK, Savjani JK. Drug solubility: Importance and enhancement techniques. ISRN Pharm 2012;2012:195727.
[Crossref] [Google Scholar] [PubMed]
- Busby WF, Ackermann JM, Crespi CL. Effect of methanol, ethanol, dimethyl sulfoxide, and acetonitrile on in vitro activities of cDNA-expressed human cytochromes P-450. Drug Metabol Dispos 1999;27(2):246-9.
[Google Scholar] [PubMed]
- Chauret N, Gauthier A, Nicoll-Griffith DA. Effect of common organic solvents on in vitro cytochrome P450-mediated metabolic activities in human liver microsomes. Drug Metabol Dispos 1998;26(1):1-4.
[Google Scholar] [PubMed]
- Easterbrook J, Lu C, Sakai Y, Li AP. Effects of organic solvents on the activities of cytochrome P450 isoforms, UDP-dependent glucuronyl transferase, and phenol sulfotransferase in human hepatocytes. Drug Metabol Dispos 2001;29(2):141-4.
[Google Scholar] [PubMed]
- Hickman D, Wang JP, Wang Y, Unadkat JD. Evaluation of the selectivity of in vitro probes and suitability of organic solvents for the measurement of human cytochrome P450 monooxygenase activities. Drug Metabol Dispos 1998;26(3):207-15.
[Google Scholar] [PubMed]
- Tang C, Shou M, Rodrigues AD. Substrate-dependent effect of acetonitrile on human liver microsomal cytochrome P450 2C9 (CYP2C9) activity. Drug Metabol Dispos 2000;28(5):567-72.
[Google Scholar] [PubMed]
- Wienkers LC, Heath TG. Predicting in vivo drug interactions from in vitro drug discovery data. Nat Rev Drug Discov 2005;4(10):825-33.
[Crossref] [Google Scholar] [PubMed]
- Li D, Han Y, Meng X, Sun X, Yu Q, Li Y, et al. Effect of regular organic solvents on cytochrome P450-mediated metabolic activities in rat liver microsomes. Drug Metabol Dispos 2010;38(11):1922-5.
[Crossref] [Google Scholar] [PubMed]
- Patil PG, Kamble SH, Shah TS, Iyer KR. Effect of water miscible organic solvents on p-nitrophenol hydroxylase (CYP2E1) activity in rat liver microsomes. Indian J Pharm Sci 2015;77(3):283-9.
[Crossref] [Google Scholar] [PubMed]
- Shah TS, Kamble SH, Patil PG, Iyer KR. Effect of water-miscible organic solvents on CYP450-mediated metoprolol and imipramine metabolism in rat liver microsomes. Indian J Pharm Sci 2015;77(4):382.
[Crossref] [Google Scholar] [PubMed]
- Walawalkar PS, Serai PS, Iyer KR. Isolation and catalytic competence of different animal liver microsomal fractions prepared by calcium-aggregation method. Indian J Pharm Sci 2006;68(2):262-5.
- Nirogi R, Kandikere V, Bhyrapuneni G, Ponnamaneni RK, choudary Palacharla R, Manoharan A. Effect of dimethyl sulfoxide on in vitro cytochrome P4501A2 mediated phenacetin O-deethylation in human liver microsomes. Drug Metabol Dispos 2011;39(11):2162-4.
[Crossref] [Google Scholar] [PubMed]
- Kumar S, Earla R, Jin M, Mitra AK, Kumar A. Effect of ethanol on spectral binding, inhibition, and activity of CYP3A4 with an antiretroviral drug nelfinavir. Biochem Biophy Res Commun 2010;402(1):163-7.
[Crossref] [Google Scholar] [PubMed]
- Backes WL, Canady WJ. The interaction of hepatic cytochrome P-450 with organic solvents. The effect of organic solvents on apparent spectral binding constants for hydrocarbon substrates. J Biol Chem 1981;256(14):7213-27.
[Crossref] [Google Scholar] [PubMed]
- Rokitta D, Pfeiffer K, Streich C, Gerwin H, Fuhr U. The effect of organic solvents on enzyme kinetic parameters of human CYP3A4 and CYP1A2 in vitro. Toxicol Mech Methods 2013;23(8):576-83.
[Crossref] [Google Scholar] [PubMed]
- Rege BD, Kao JP, Polli JE. Effects of nonionic surfactants on membrane transporters in Caco-2 cell monolayers. Eur J Pharma Sci 2002;16(4-5):237-46.
[Crossref] [Google Scholar] [PubMed]
- Hugger ED, Audus KL, Borchardt RT. Effects of poly (ethylene glycol) on efflux transporter activity in Caco-2 cell monolayers. J Pharm Sci 2002;91(9):1980-90.
[Crossref] [Google Scholar] [PubMed]
