- *Corresponding Author:
- Yan Ke
Department of Traditional Chinese Medicine, Shanghai University of Traditional Chinese Medicine, Cailun, Shanghai 201203, China
E-mail: dengjianyu1027@163.com
| This article was originally published in a special issue, “Recent Progression in Pharmacological and Health Sciences” |
| Indian J Pharm Sci 2024:86(2) Spl Issue “154-166” |
This is an open access article distributed under the terms of the Creative Commons Attribution-NonCommercial-ShareAlike 3.0 License, which allows others to remix, tweak, and build upon the work non-commercially, as long as the author is credited and the new creations are licensed under the identical terms
Abstract
The effective polysaccharide differentiation-inducing factor-1 was obtained by separating the traditional Chinese medicine Duchesnea indica. In vitro, differentiation-inducing factor-1 significantly inhibited the migration and invasion of HT-29 cells; it can significantly inhibit the expression of transforming growth factor-beta induced the decrease of E-cadherin and inhibited the increase of N-cadherin expression; at the same time, it can significantly inhibit the phosphorylation process of suppressor of mothers against decapentaplegic 2 and suppressor of mothers against decapentaplegic 3 and reduce the protein expression. In in vivo experiment, the number of liver metastatic nodules and the volume of tumor tissue in the administration group (differentiation-inducing factor-1-L and differentiation-inducing factor-1-H, positive) were lower than those in the model group (p<0.05). Differentiation-inducing factor-1 can improve the liver tissue of nude mice, maintain the complete structure and reduce the number of heterosexual nuclei. Western blot showed that the expression of E-cadherin increased significantly and the expression of N-cadherin decreased under the action of differentiation-inducing factor-1. Differentiation-inducing factor-1 can significantly inhibit the migration and invasion of HT-29 cells in vitro. In vivo experiments further prove that differentiation-inducing factor-1 can reduce the number and volume of tumors in vivo, and inhibit the metastasis of HT-29 cells in vivo. The mechanism may be through suppressor of mothers against decapentaplegic pathway.
Keywords
Duchesnea indica, polysaccharide differentiation-inducing factor-1, colon cancer, metastasis, transforming growth factor-beta, epithelial mesenchymal cell
Colorectal Cancer (CRC) is one of the most common malignant tumors in the digestive system. Its incidence rate and mortality rate are the top three incidence rate and mortality rate in the world[1]. In the course of development, the liver is the main place of blood circulation metastasis[2]. In terms of treatment, radical resection of primary focus is the most effective treatment method, but 30 %-50 % of postoperative patients still have metastasis and recurrence[3,4]. Therefore, determine the mechanism of colon cancer metastasis and the effective drug target inhibit the occurrence of liver metastasis of colon cancer, and then further intervene.
The Epithelial-Mesenchymal Transition (EMT) plays an important role in the occurrence and development of colon cancer. With the occurrence of EMT, E-cadherin, Zonula Occludens-1 (ZO-1), cytokeratin and other proteins decreased gradually. The expression of interstitial cell marker proteins N-cadherin and Matrix Metalloproteinases (MMPs) increased gradually. According to relevant studies, the occurrence of EMT may involve multiple signal transduction pathways, such as Transforming Growth Factor-Beta (TGF-β)/Suppressor of Mothers Against Decapentaplegic (SMAD) pathway, Wnt/β-Catenin pathway, Phosphoinositide 3-Kinase (PI3K)/Protein Kinase B (AKT) pathway etc.,[5] in which TGF-β1 has been recognized as the most clear and symbolic signal factor of EMT[6]. SMAD mediates TGF-β1 in EMT, it sends out important transmembrane signal, which is through TGF-β1 and receptor II can be achieved by binding with each other. After the signal transduction is turned on, the relevant cell signal transduction molecules (SMAD2 and SMAD3) are activated and combined with other cell signal transduction molecules (SMAD4), and finally form a trimer into the nucleus, which is combined with the site through Deoxyribonucleic Acid (DNA) transcription, so as to play its role[7].
Duchesnea indica (D. indica) (Andr) Focke is a perennial herb belonging to the genus raspberry of Rosaceae. The whole herb is used as medicine. Its alias is sanpifeng and shehancao. It has the functions of clearing heat and detoxification, promoting blood circulation, dispersing blood stasis and astringent hemostasis[8]. It can also treat snakebite[9], apply it to treat sore, etc., it also has significant effects in anti-tumor, bacteriostasis, hypotension, antioxidant, etc.,[10-16]. Polysaccharide is also an important component of D. indica, relevant studies have shown that the total polysaccharide of D. indica has inhibitory effect on varicella zoster virus, and a neutral polysaccharide isolated from D. indica, has strong inhibitory effect on Human Ovarian Cancer Cells (SKOV-3) and Human Liver Cancer Cells (Hep-G2) in vitro[17,18]. Current relevant studies have shown that alcohol extract and phenolic extract of D. indica have good inhibitory effects on liver cancer, ovarian cancer, oral cancer and cervical cancer[17,19-21]. However, the inhibitory effect of D. indica polysaccharide on colon cancer has not been reported. The previous screening of our research group found that the total polysaccharide of D. indica had a certain inhibitory effect on the metastasis of colon cancer HT-29 cells. Therefore, the polysaccharide of D. indica was further isolated and purified. Based on the epithelial mesenchymal transformation model and nude mouse stem metastasis model, the inhibitory effect and mechanism of D. indica polysaccharide on colon cancer were explored. Study the related mechanism of action, understand the multi-target direction of its action, improve the effectiveness and safety of traditional Chinese medicine D. indica in clinical antitumor application, and provide theoretical data basis for the later development of D. indica.
Materials and Methods
Materials and animals:
Human colon cancer HT-29 cell was purchased from Shanghai Cell Institute. Female Bagg Albino (BALB/c) nude mice (4 w old and weighing 17~23 g) were obtained from Shanghai Branch of Beijing Weitong Lihua Experimental Animal Co., Ltd. During the administration, all animals were maintained in standard vinyl cages with air filter tops in a filtered laminar air flow room at 25° on a 12 h light/dark cycle. Water and food were autoclaved and provided for all animals. The use of animals was approved by the Institutional Animal Care Committee of Shanghai University of Traditional Chinese Medicine and firmly adhered to the Ethical Guidelines for the Care and Use of Animals (Ethical No: pzshutcm191213008).
The whole plant of D. indica (Product No: 181112) was purchased from Kangqiao Medicinal Materials Electuary Co. Ltd. in Shanghai, China. A Diethylaminoethyl Cellulose (DEAE-C) column was purchased from Yeli (Shanghai, China). A Superdex gel filtration chromatography column was purchased from Pharmacia (New Jersey, United States of America (USA)). Cell Counting Kit-8 (CCK-8), Bicinchoninic Acid (BCA) assay protein quantification kit (Beyotime Biotechnology); N-cadherin (Abcam, No: GR3284699-6); E-cadherin, SMAD2/3 and p-SMAD2/3 (American cell singling); Dulbecco's Modified Eagle Medium (DMEM) was obtained from HyClone (Logan, Utah, USA). Fetal Bovine Serum (FBS) was obtained from GIBCO (Grand Island, New York, USA). TGF-β1 was purchased from PeproTech (New Jersey, USA). The human colon adenocarcinoma cell line (HT-29) was purchased from the Chinese Academy of Sciences. All of the chemicals used were of an analytical grade.
Extraction and purification of polysaccharides:
Differentiation-Inducing Factor (DIF)-1 was obtained after water extraction, alcohol precipitation and freeze-drying. 5 g of DIF was weighed and dissolved in 100 ml of distilled water. After it was fully dissolved by ultrasound, the supernatant was centrifuged (10 000 rpm, 15 min). The supernatant was eluted with 0.2 M sodium chloride solution by DEAE Sepharose Fast Flow chromatography, and then detected by phenol sulfuric acid method. After 48 h of reduced pressure concentration and dialysis with flowing water, the corresponding polysaccharide was obtained by lyophilization: 0.2 M Sodium chloride (NaCl) fraction DIF2. DIF2 content was determined by sulfuric acid phenol method.
DIF2 sugar component analysis:
Take several 10 ml ampoules, weigh 2 mg of DIF2 sample, add it into the ampoules, add 3 ml of 2 M trifluoroacetic acid solution, package the ampoules, and then hydrolyze at 120° for 2 h. The hydrolysate is added with methanol and evaporated under reduced pressure for several times. Then, 30 mg Sodium borohydride (NaBH4) and 1 ml of water were added for reaction for 6 h-8 h. During this period, methanol and glacial acetic acid mixed solution (5:1) were added several times, and the solvent was evaporated to dryness under reduced pressure until it became powder. Then, methanol was added again and evaporated to dryness for 3 times, and dried at 105° for 10 min. Add 3 ml of acetic anhydride, acetylate at 105° for 1 h, and then add 1 ml of water to shake immediately to terminate the reaction. Finally, the acetyl compound was extracted with 3 ml of chloroform, washed with water for 3 times, and the chloroform layer was dried with anhydrous sodium sulfate, and then analyzed by Gas Chromatography/ Mass Spectrometry (GC/MS).
Cytotoxicity assay:
A CCK-8 (Yeasen, China) was used to evaluate the cytotoxicity of SBPW3 on human CRC cells. CCK-8 is widely used for drug screening, cell proliferation and toxicity detection. Cells (5×10⁴ cells/well) were first seeded in 96-well flat-bottomed plates for 24 h, and then DIF2 was added at final concentrations of 0, 25, 50, 100, 200, 400 and 800 μg/ml for another 36 h. As soon as the treatment was completed, 20 μl of CCK-8 solution was added to each well and incubated for 4 h in a cell incubator (Eppendorf, Germany). Finally, the absorbance of the samples that were taken from each well was measured on a microplate reader (Molecular Devices, USA) at 450 nm; data were normalized to determine the percentage of the surviving cells of each treated group compared to that of the untreated group.
Scratch experiment:
Take HT-29 cells in logarithmic growth period, wash them twice with Phosphate Buffer Solution (PBS), add trypsin to complete digestion, add serum-free DMEM to terminate digestion, and prepare the cells with a concentration of 1×10⁶ cells/ml of cell suspension. 2 ml of cell suspension was added to the 6-well plate, and after adherence, 200 μl the sterile gun head is perpendicular to the bottom of the 6-well plate, scribe according to the scribe direction, rinse with PBS for 3 times, wash off the cells that fall off after the scratch, add 2 ml FBS free DMEM, and take the first positioning photo under the microscope, and record it as 0 h. They were divided into blank group, model group, DIF2-L and DIF2-H groups, and TGF-β1 and DIF2 test solution to a final volume of 4 ml TGF-β1. The final concentrations of 1 and DIF2 were 10 ng/ml, 100 μg/ml and 200 μg/ml, and then put it into the cell incubator (37°, 5 % Carbon dioxide (CO2)) for 36 h. Take out the photo and record it as 36 h. Use ImageJ to analyze the number and distance of cell migration, i.e. the migration area=S0-S36 (S0 is the scratch blank area after 0 h of culture, and S36 is the scratch blank area after 36 h of culture)
Transwell invasion assay:
The invasive ability of human CRC cells was analyzed by transwell permeable inserts, permitting accurate, repeatable invasion assays. When placed in the well of a multi-well tissue culture plate, these inserts create a two-chamber system separated by the cell permeable membrane. The polycarbonate membranes (8 μm, Corning, USA) were inserted into 24-well plates. The membranes were pre-coated with 100 μl of Matrigel matrix (BD, USA, 1:3 dilution), and the Matrigel matrix was solidified for (2-3) h in incubator at 37° in a humidified 5 % CO2 incubator. HT-29 cells that were treated with DIF2 were collected. Cells (200 μl, 1×10⁶ cells/ml) were loaded into the upper chambers, which were filled with serum-free medium, and 500 μl of complete medium was added to the lower chambers. After incubation at 37° for another 36 h, the cells were fixed with 4 % paraformaldehyde for 30 min and then stained with crystal violet for 30 min. After cells were gently washed with PBS, the cells on the upper side of the polycarbonate membranes were wiped off, and the cells that had migrated to the lower side of the polycarbonate membranes were photographed with a microscope.
Western blot analysis:
The proteins expressed by the HT-29 cells were measured by Western blotting. HT-29 cells (5×10⁵ cells) were inoculated in cell culture dishes (60 mm, Corning, USA). After 16 h at 37°, the cells were cultured in complete medium with TGF-β1 (10 ng/ ml) or with different doses of DIF2 (100, 200 μg/ ml) for another 36 h. The medium was removed by an automatic suction pump, and the cells were washed 3 times with PBS. Cell proteins were extracted using Radio-Immunoprecipitation Assay (RIPA) buffer supplemented with protease and phosphatase inhibitors. Total protein concentrations were detected using a BCA protein quantification kit (Yeasen, China). The total proteins were fractionated by Sodium Dodecyl Sulfate-Polyacrylamide Gel Electrophoresis (SDS-PAGE) and then electro- transferred onto Polyvinylidene Fluoride (PVDF) membranes. After blocking with 5 % dried skim milk powder for 2 h at room temperature, the membranes were incubated with primary antibodies (E-cadherin, N-cadherin, Snail, Zinc finger E-box Binding homeobox-1 (ZEB-1), SMAD2, SMAD3, p-SMAD2 and p-SMAD3) overnight at 4°. Then, the membranes were washed 3 times with Tris-Buffered Saline with 0.1 % Tween® 20 detergent (TBST) and incubated with secondary antibodies for 2 h at room temperature.
Colon cancer liver metastasis model establishment and drug treatment:
Colon cancer HT-29 cells were transfected under the splenic capsule and returned to the portal vein through the splenic vein, to form metastatic tumors in the liver rapidly. The nude mice were randomly divided into 5 groups, 9 in each group, which were blank group, model group, DIF2-L group (100 mg/ kg), DIF2-H group (200 mg/kg) and positive drug group (oxaliplatin 10 mg/kg). The blank group was sham operation group, and the other four groups were operation group. 0.9 % normal saline was injected into the spleen of nude mice in the sham operation group, and HT-29 transfected cells were injected into the spleen of nude mice in the operation group. Administration 24 h after operation (blank group and model group, i.p. 200 μl 0.9 % Normal Saline (NS); DIF2-L and DIF2-H groups, 100/200 mg/kg, i.p. 200 μl; positive drug group, i.p. 200 μl 10 mg/kg, 72 h. After 30 d, the nude mice were killed, and the liver, spleen and tumor tissues were dissected to observe whether there were metastatic foci in the liver of the nude mice and the number of metastatic tumors (Phi (Φ) ≥1 mm), record the size of tumor tissue (volume=(length×width)/2), respectively stored in methanol and liquid nitrogen[22].
Fluorescent in vivo imaging:
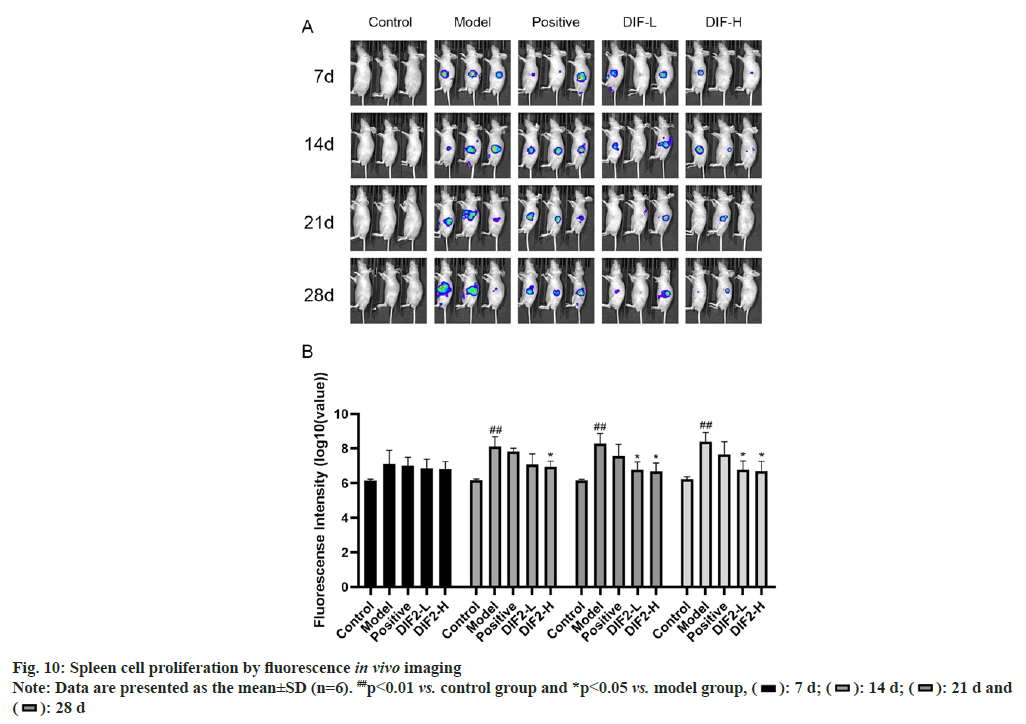
The first to fourth live imaging observations of spleen proliferation were performed on the 7th, 14th, 21st and 28th d of normal feeding, and the first to third live imaging observations of liver metastasis were completed on the 14th, 21st and 28th d of feeding. First, the potassium fluorescein, the fluorescein substrate, was injected into the abdominal cavity of nude mice, and then put into a gas anesthesia box (isoflurane) 10 min later. After the anesthesia is completed, the nude mice are put into the imaging chamber, and the special photons emitted from the nude mice are automatically photographed. The imaging can show the location and intensity of the special photons in the nude mice. Finally, the SlideBook 4.0 software was used to analyze the results. The survival time of tumor formation in nude mice was taken as the independent variable, and the fluorescence intensity of tumor in nude mice was taken as the dependent variable to observe the changes in the number of tumors in nude mice.
Hematoxylin and Eosin (H&E) staining:
Take the liver tissue of nude mice with H&E staining. After undergoing dehydration, transparency, wax immersion, embedding, sectioning, staining, and sealing, the tissue structure of various groups and the quantity of heterotypic cells can be observed under a microscope.
Statistical analysis:
Data are described as the mean±Standard Deviation (SD) and were analyzed by two-tailed student’s t-test. The limit of statistical significance was p<0.05. Statistical analysis was performed using Statistical Package for the Social Sciences (SPSS)/Win11.0 software (SPSS, Inc., Chicago, Illinois, USA).
Results and Discussion
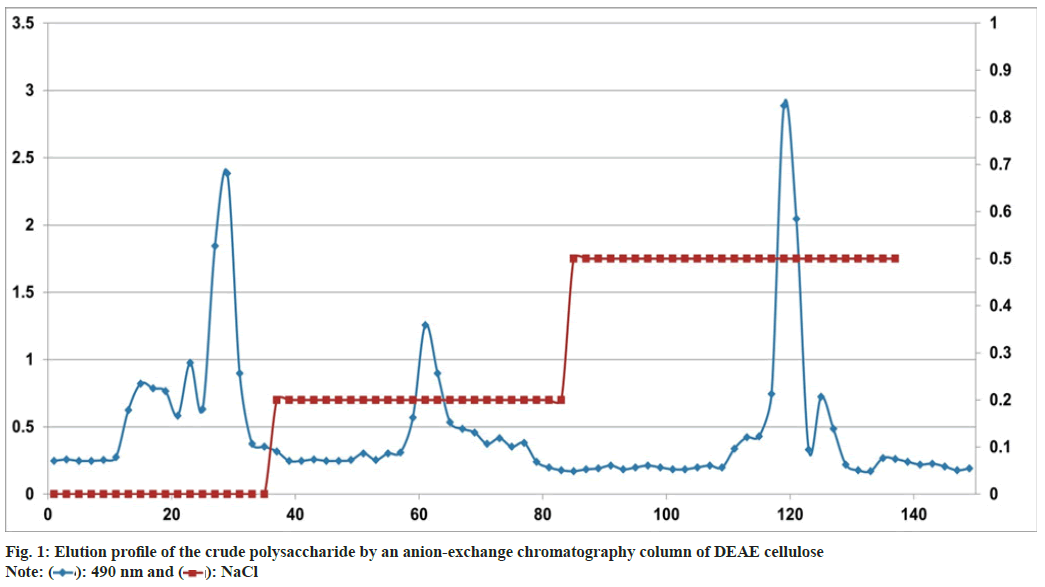
The crude polysaccharide (DIF) was obtained by hot water extraction, precipitation with ethanol and lyophilization. The yield of DIF was 73.85 % of the dried material. DIF was further purified by an anion-exchange chromatography column of DEAE cellulose. The column was eluted with distilled water or a stepwise gradient of NaCl aqueous solutions (0.2, 0.5, and 1 M) at a flow rate of 4 ml/ min, and the eluents (10 ml/tube) were collected using an automatic collector. The DEAE column chromatogram of the DIF was shown in fig. 1. The absorbance of the polysaccharides was detected at 490 nm. The elution curves of DIF were generated based on the absorbance and the number of the tube. DIF was separated into five fractions based on the peaks of the graph, referred to as DIFW (water), DIF2 (0.2 M NaCl), DIF5 (0.5 M NaCl), and DIF10 (1 M NaCl).
The chromatogram of the monosaccharide composition of DIF2, and the molar ratios of the monosaccharides was shown in fig. 2. SBPW3 was composed of rhamnose, arabinose, xylose, glucose and galactose with an approximate molar ratio of 12.4:40.2:13.3:3.5:30.7.
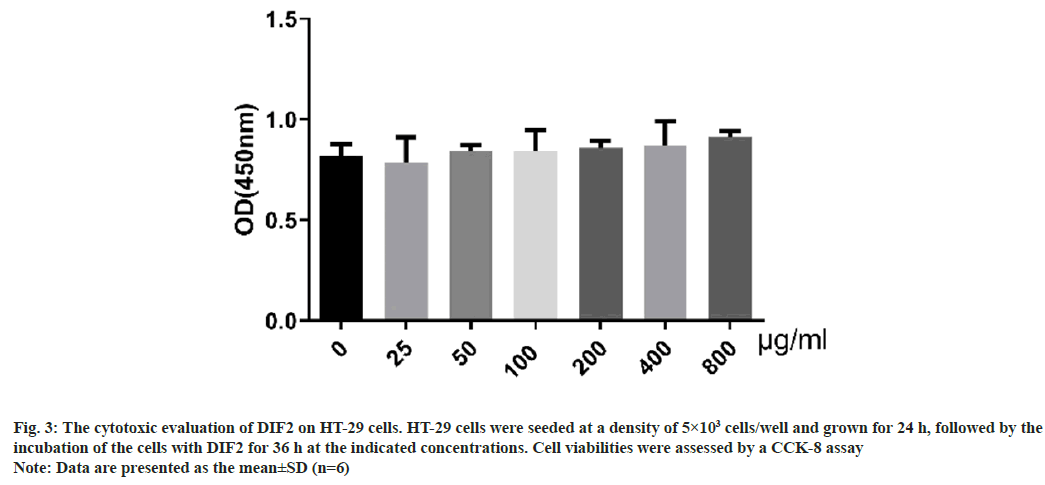
The result of CCK-8 test was shown in fig. 3. When the dose of DIF2 is from 0 to 800 μg/ml (0, 25, 50, 100, 200, 400 and 800 μg/ml), there was no significant cytotoxicity to HT-29 cells at different concentrations of DIF2.
Fig. 3: The cytotoxic evaluation of DIF2 on HT-29 cells. HT-29 cells were seeded at a density of 5×10³ cells/well and grown for 24 h, followed by the
incubation of the cells with DIF2 for 36 h at the indicated concentrations. Cell viabilities were assessed by a CCK-8 assay
Note: Data are presented as the mean±SD (n=6)
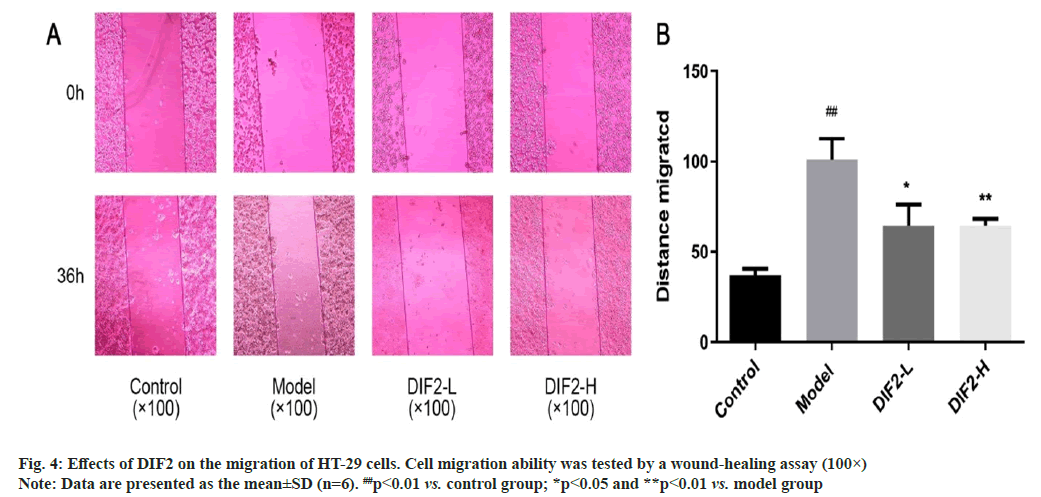
The experimental group was divided into blank group, model group, DIF2-L (100 μg/ml) group, DIF2-H (200 μg/ml) group, according to the results in fig. 4, the migration distance of the model group was significantly increased compared with the blank group, indicating that the modeling was successful. Dosing group (DIF2-L group and DIF2-H group) added TGF-β1 and DIF2 test solution respectively, compared with the model group, the migration area was reduced, and the migration was significantly inhibited. Then use ImageJ analysis software to calculate the blank area, i.e., migration area=S0-S36. From the statistical results, DIF2-L group and DIF2-H group can inhibit the migration of HT-29 cells.
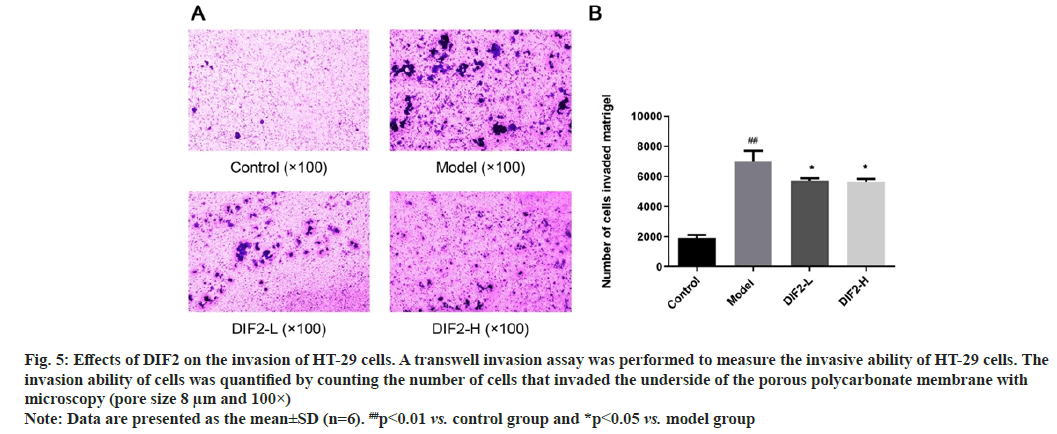
The experimental group was divided into blank group, model group, DIF2-L (100 μg/ml) group, DIF2-H (200 μg/ml) group, according to the results shown in fig. 5, after 36 h of culture and staining, the number of cells invading into the lower chamber in the model group was significantly higher than that in the blank group, indicating that the model was successful. TGF was added to the dosing group respectively-β 1 and DIF2 test solution, the number of invasive cells in the drug adding group (DIF2-L group and DIF2-H group) were significantly reduced compared with the model group, indicating that the drug adding group had a significant inhibition effect on HT-29 cells invading the lower compartment. The number of invasive cells was calculated by ImageJ analysis software. The statistical results showed that both DIF2-L group and DIF2-H group could inhibit the invasion of HT-29 cells.
Fig. 5: Effects of DIF2 on the invasion of HT-29 cells. A transwell invasion assay was performed to measure the invasive ability of HT-29 cells. The
invasion ability of cells was quantified by counting the number of cells that invaded the underside of the porous polycarbonate membrane with
microscopy (pore size 8 μm and 100×)
Note: Data are presented as the mean±SD (n=6). ##p<0.01 vs. control group and *p<0.05 vs. model group
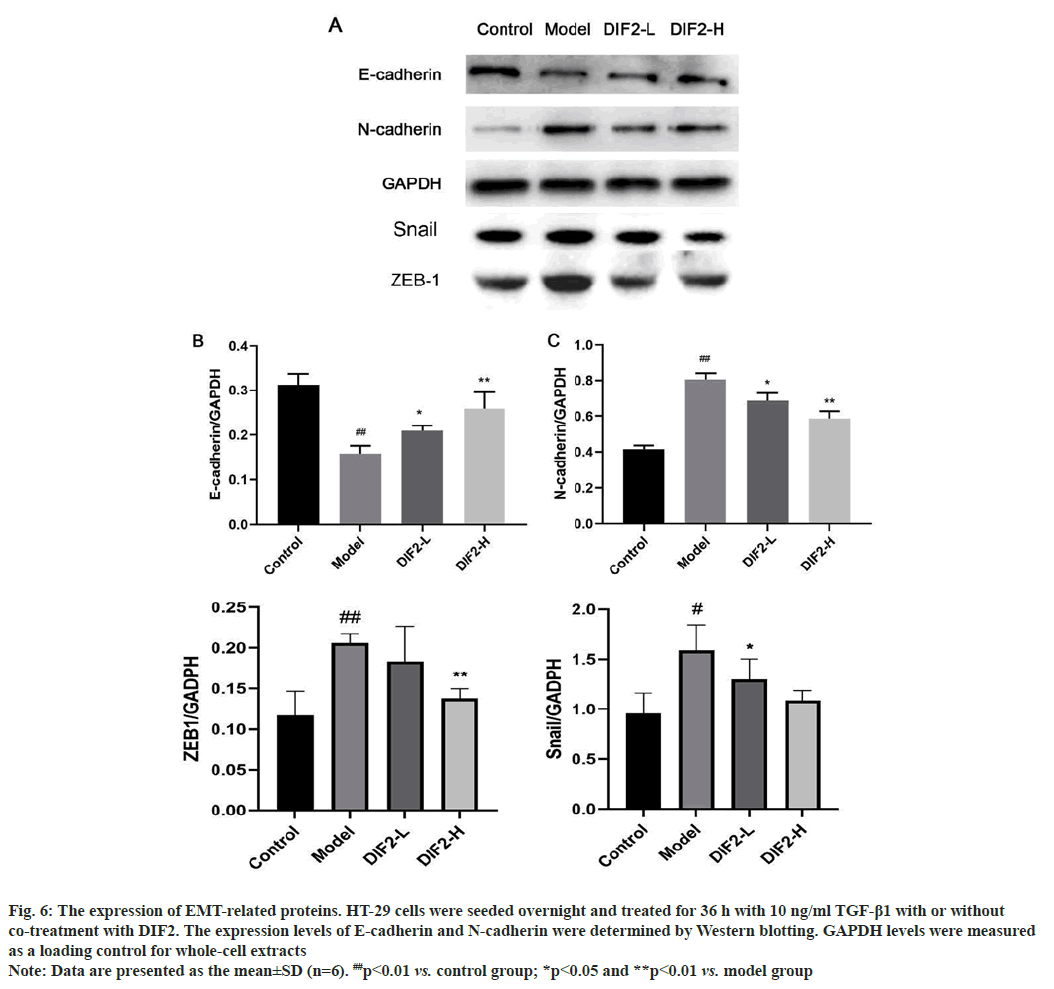
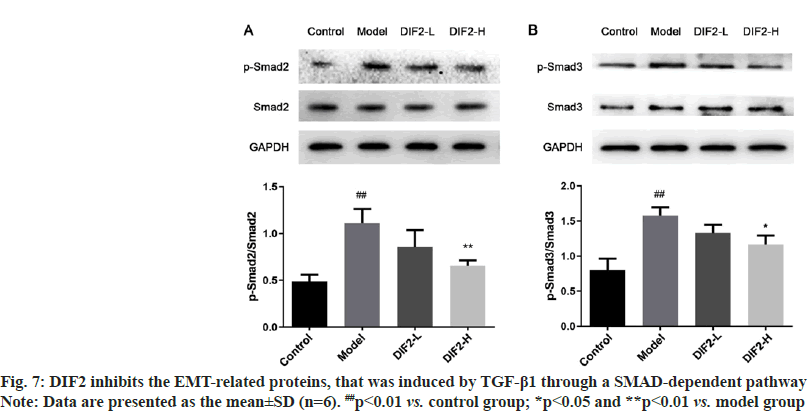
TGF-β1 induced EMT model was intervened by DIF2, and the expression and content changes of related marker proteins were detected by Western blot. As shown in fig. 6, E-cadherin, the epithelial marker protein of the model group, decreased significantly compared with the blank group. N-cadherin, the stromal cell marker protein and snail, ZEB-1 protein increased significantly compared with the blank group, indicating that the modeling was successful. The expression of E-cadherin in DIF2-L and DIF2-H groups increased compared with the model group, and the expression of N-cadherin, snail and ZEB-1 in DIF2-L and DIF2-H groups decreased significantly compared with the model group, and formed good dose dependence. Therefore, it is believed that DIF2 has a significant inhibitory effect on TGF-β1 induced EMT model as shown in fig. 7.
Fig. 6: The expression of EMT-related proteins. HT-29 cells were seeded overnight and treated for 36 h with 10 ng/ml TGF-β1 with or without
co-treatment with DIF2. The expression levels of E-cadherin and N-cadherin were determined by Western blotting. GAPDH levels were measured as a loading control for whole-cell extracts
Note: Data are presented as the mean±SD (n=6). ##p<0.01 vs. control group; *p<0.05 and **p<0.01 vs. model group
EMT is not a cell-autonomous process; EMT requires signals to initiate the process and to drive the transformation. Studies have shown that TGF-β mainly induces EMT through the classical SMAD- dependent pathways, and TGF-β plays a role in these pathway by binding to serine/threonine kinase receptors of TGF-β type I and type II, and TGF-β further phosphorylates the downstream SMAD (SMAD2 and SMAD3). The activated R-SMAD form trimer complexes with the common mediator SMAD4 and play a role in the nucleus that can induce the reprogramming of related genes by activating the expression of EMT transcription factors.
To study the effects of DIF2 on EMT-related pathways, we also analyzed proteins related to the SMAD pathway. The expression of phosphorylated protein of SMAD2 and SMAD3 in DIF2-L and DIF2-H groups was lower than that in the model group, and formed a good dose dependence in fig. 7. It is speculated that DIF2 may regulate epithelial mesenchymal transformation through SMAD pathway.
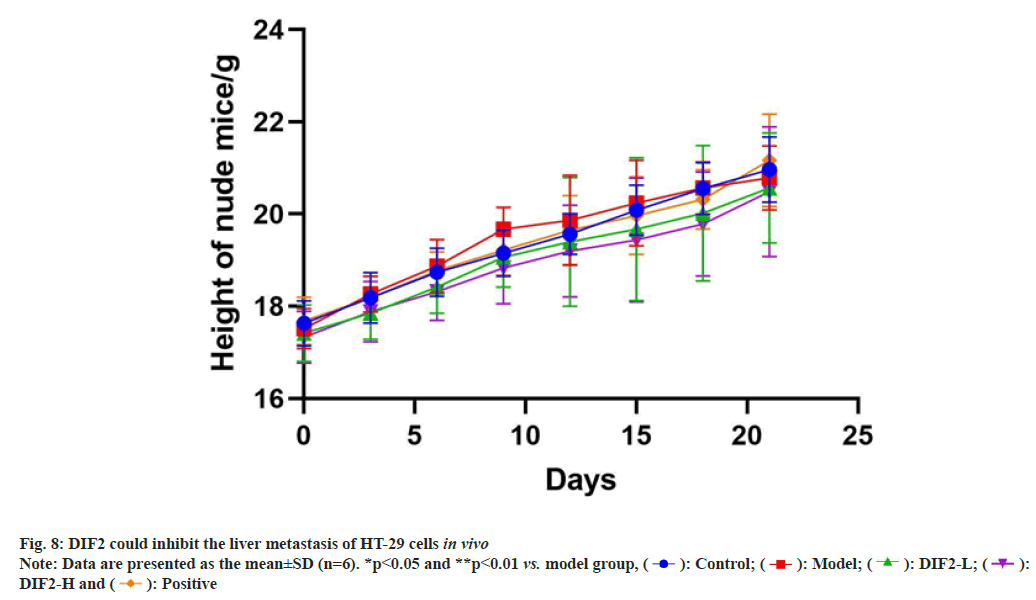
According to fig. 8, nude mice were weighed every 3 d, revealing a significant decrease in weight growth rate for the model group after the 9th d. However, the DIE2-L and DIE2-H groups continued to show stable weight increase. Statistical analysis indicated that DIE2 is capable of regulating body weight in nude mice with colon cancer.
Liver metastasis=Area of tumour transferred on liver/liver area×100 %
As shown in fig. 9, the nude mice were killed after cervical dislocation and dissected, and the liver tissue was taken out. The naked mice in the model group, DIF2-L group and DIF2-H group showed metastatic lesions (yellow arrow mark). The number of liver metastatic nodules in nude mice in DIF2-L group and DIF2-H group was less than that in model group. After counting the number of individuals with liver metastasis, it can be concluded that the number of liver metastasis nodules in the medication group (DIF2-L, DIF2-H, positive) is lower than that in the model group. Remove the tumor nodules from the liver tissue and measure the size of the nodules. Statistics showed that the tumor tissue volume of the drug group (DIF2-L group, DIF2-H group and positive drug group) was significantly lower than that of the model group.
As shown in fig. 10, on the 7th d of normal administration and feeding, there was no significant difference in the proliferation of cells in the spleen between the administration group (DIF2-L group, DIF2-H group, positive drug group) and the model group. On the 21st d and 28th d, fluorescence imaging showed that both low dose and high dose could inhibit the proliferation of HT-29 cells in vivo, but the difference between low dose and high dose could not be compared only through in vivo imaging.
As shown in fig. 11, according to the normal administration and the 14th d of feeding, there was no significant difference in liver metastasis between the administration group (DIF2-L group, DIF2-H group, positive drug group) and the model group. On the 28th d, both low dose and high dose of intraventricular fluorescence imaging could inhibit HT-29 cell metastasis in vivo, but the difference between low dose and high dose could not be compared only through in vivo imaging.
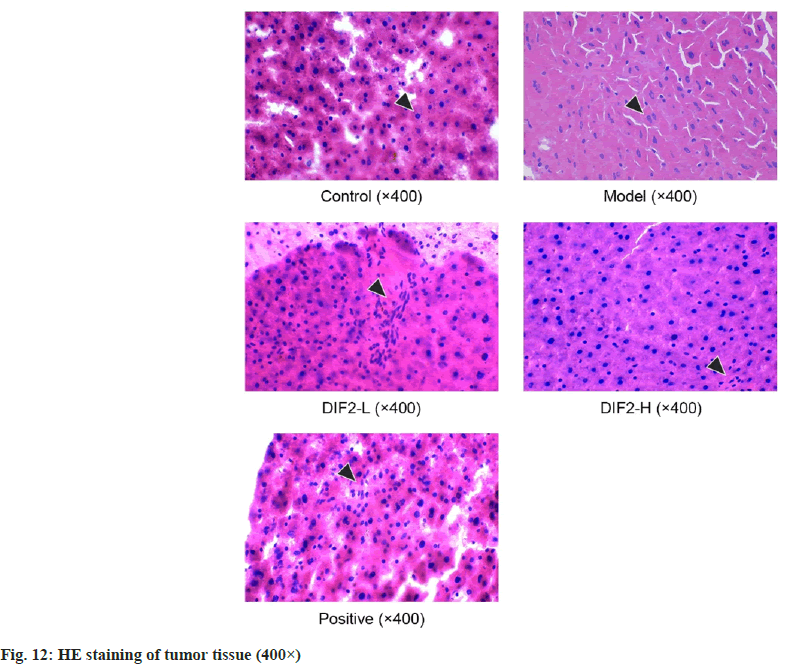
The H&E staining results are shown in fig. 12, the arrows in the figure refer to HT-29 nuclei. In this experiment, normal cells in the blank group are arranged orderly, and the nuclear structure is complete and clear. In the model group, the cells were arranged and scattered, and the shape of the nucleus changed, showing heteromorphism. Compared with the model group, the cells of DIF2-L, DIF2-H and positive drug groups were gradually arranged closely, and the nucleus had some heterotypic changes. Compared with the model group, there were a large number of normal cells in the three drug groups, and the structure was complete and clear, and the number of heterotypic cells was significantly reduced. The results show that the greater the heterotypic continuity, the greater the difference between the tumor tissues and cells and the corresponding normal tissues and cells. Heterotypic continuity is a manifestation of the tumor tissues and cells with the disorder of estrangement and differentiation. The greater the heterotypic continuity, the lower the maturity and differentiation of the tissues and cells[23].
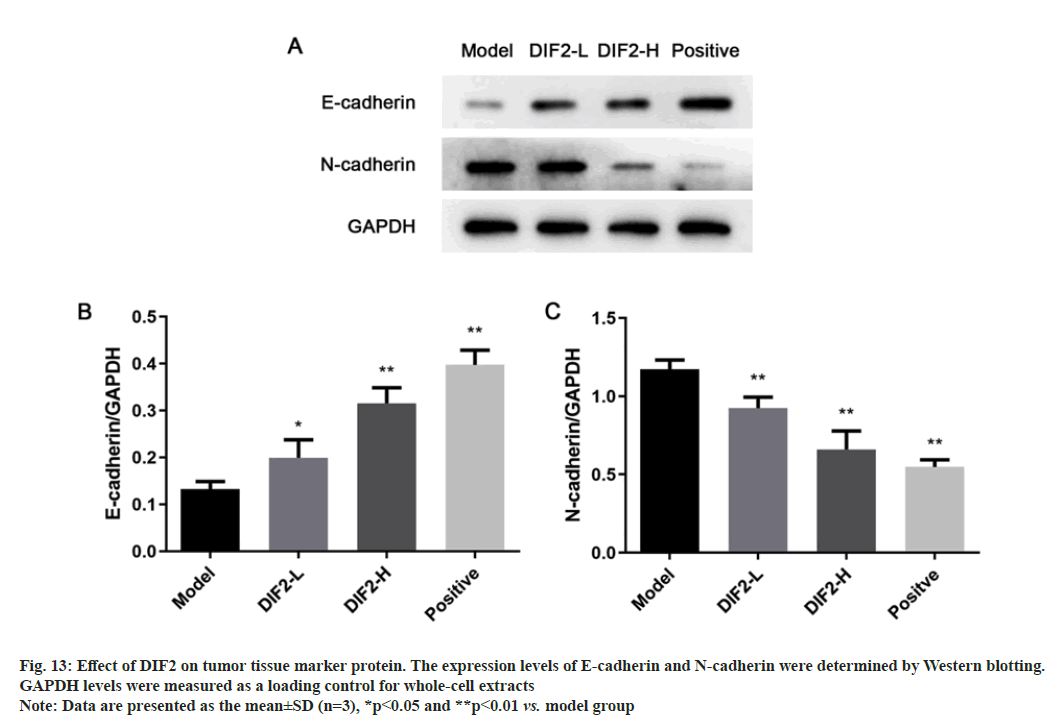
The content and expression of E-cadherin and N-cadherin related to EMT in tumor tissues of different groups of nude mice were detected by Western blot. Since the blank group is a sham operation group and there is no tumor tissue in the body, the experimental group is divided into model group, DIF2-L (100 mg/kg) group and DIF2-H (200 mg/kg) group. As shown in fig. 13, the expression of E-cadherin increased significantly, while that of N-cadherin decreased. Therefore, DIF2 can inhibit HT-29 cell metastasis in vivo.
In recent years, with the formation of elderly cities or communities, the increase of human Body Mass Index (BMI), and the acceleration of life rhythm, the forms of life entertainment and social interaction have changed, and some people’s diet and living habits have changed accordingly, leading to the increasing trend of colon cancer every year. China has become the country with the highest incidence of malignant tumors in the digestive system[24], which has seriously affected people’s survival living and healthy environment.
D. indica is widely distributed in China with abundant resources and low requirements for environment and soil[15]. It is distributed in the south of Liaoning and the Yangtze River basin, and also recorded in Europe and America. Natural plant polysaccharides are a kind of natural active ingredients to maintain life activities. In recent years, studies have found that polysaccharides have multiple pharmacological effects, such as anti-tumor, anti-oxidation, anti- virus, etc., with small toxic and side effects, and have gradually become one of the research hotspots from a wide range of sources. In this experiment, we isolated and purified DIF2 from DIF.
In the tumor microenvironment, the occurrence of EMT can separate normal epithelial cells, so that cells without the ability of metastasis and invasion can fall off from the primary focus, invade the basement membrane, follow the blood circulation of the whole body, and finally transfer to other tissues and organs at the distal end[25]. During the process, epithelial cell marker proteins show a decreasing trend. The loss of E-cadherin makes epithelial cells obtain mesenchymal cell characteristics, and produces a high degree of liquidity and flexibility. In this transformation process, the mesenchymal cell marker protein showed an upward trend, and the expression of N-cadherin, as a neural type cadherin mesenchymal cell, was significantly increased.
In this experiment, it is confirmed that 0-800 μg/ml DIF2 has no toxic effect on cells, so the drug select dose of 100 μg/ml and 200 μg/ml for subsequent experiments. The scratch test and transwell cell invasion test confirmed that DIF2 had a good inhibitory effect on HT-29 cell’s proliferation, migration and invasion, and formed good dose dependence.
EMT is a complex network, involving different signal paths. TGF-β/SMAD pathway is the classical pathway of EMT, TGF-β signal is transduced by transmembrane type I and type II serine/threonine kinase receptors and their downstream effector SMAD protein. Ligand stimulation of serine/ threonine kinases of type I and II receptors leads to the binding and activation of receptor complexes on the cell membrane, thereby phosphorylating and activating receptor regulated SMADs[26]. SMAD2 and SMAD3, as related signal molecules, cause expression changes through phosphorylation. By activating TGF-β receptor, and then phosphorylate and activate SMAD2/3 transcription factor driving target gene transcription for signal transduction[27]. In the pathways induced, it is finally attributed to the discovery that DIF2 can inhibit the phosphorylation of SMAD2 and SMAD3 to achieve the change of protein content in this experiment, suggesting that the process of DIF-2 inhibiting EMT may be through TGF-β/SMAD path implementation.
In the nude mouse model of liver metastasis, DIF2 has a significant inhibitory effect on HT-29, which can reduce the number and volume of tumors. In vivo imaging results show that DIF2-L and DIF2-H both inhibit tumor cell proliferation and effective in inhibiting tumor cell metastasis and invasion.
Funding:
This study was supported by research projects within Budget project of Shanghai University of Traditional Chinese Medicine to investigate the effect of Banxia Baizhu-Tianma decoction on vascular function injury induced by sleep deprivation based on microRNA-21/ p38 MAPK pathway (2021LK031).
Conflict of interests:
The authors declared no conflict of interests.
References
- Bray F, Ferlay J, Soerjomataram I, Siegel RL, Torre LA, Jemal A. Global cancer statistics 2018: GLOBOCAN estimates of incidence and mortality worldwide for 36 cancers in 185 countries. CA Cancer J Clin 2018;68(6):394-424.
[Crossref] [Google Scholar] [PubMed]
- Fan J, Gu J, Qin XY, Wang XS, Xu JM, Zhang SZ. Chinese guidelines for the diagnosis and comprehensive treatment of colorectal liver metastases (version 2020). Chin J Clin Med 2021;20:129-44.
- Wu ZD, Wu ZH, Zheng S, An H, Wang JP. Surgery. People's Medical Publishing House. 7th ed. Beijing; 2010.
- Lieberman DA, Rex DK, Winawer SJ, Giardiello FM, Johnson DA, Levin TR. Guidelines for colonoscopy surveillance after screening and polypectomy: A consensus update by the US multi-society task force on colorectal cancer. Gastroenterology 2012;143(3):844-57.
[Crossref] [Google Scholar] [PubMed]
- Zhao PF, Lv YH, Yang JY. Research progress in epithelial-mesenchymal transition signaling pathways and targeted therapy for colorectal cancer. Int J Dig Dis 2020;40:104-8.
- Xu J, Lamouille S, Derynck R. TGF-β-induced epithelial to mesenchymal transition. Cell Res 2009;19(2):156-72.
[Crossref] [Google Scholar] [PubMed]
- Fuxe J, Vincent T, Garcia de Herreros A. Transcriptional crosstalk between TGFβ and stem cell pathways in tumor cell invasion: Role of EMT promoting SMAD complexes. Cell Cycle 2010;9(12):2363-74.
[Crossref] [Google Scholar] [PubMed]
- Li M, He J, Ma BZ, Liang YY, Zhang SJ, Zhang XL. Research progress on chemical composition and antitumor pharmacological effects of Duchesnea indica. Eval Anal Drug Use Hosp China 2017;17:595-600.
- Xiang BL, Xiong Y, Chen CN, Long M, Zhu XY, He YQ. A preliminary study on inhibition of the ethanol extract from Duchesnea indica on proteolytic enzymes from Deinagkistrodon acutus venom. J Chongqing Univ 2019;36:105-48.
- Wan JZ, Wang CJ, Liu CX, Li HL. Climate change may alter genetic diversity of Duchesnea indica, a clonal plant species. Biochem System Ecol 2016;66:114-22.
- Blagodatskaya E, Littschwager J, Lauerer M, Kuzyakov Y. Plant traits regulating N capture define microbial competition in the rhizosphere. Eur J Soil Biol 2014;61:41-8.
- Liu SJ, Wang LP, Liang B. Study on the bacteriostatic and antioxidant activity of Duchesnea indica extract. J Leshan Univ 2015;20:29-32.
- Du SF, Cui YX, Yao MY, Wang X, Kong J, Pang R. Duchesnea indica extract in vitro anti-herpes simplex virus effect preliminary report. Shandong J Tradit Chin Med 2014;33:484-6.
- Yu DD, Yan H, Wu H, Feng JT, Zhang X. Isolation and identification of larvicidal constituents from Duchesnea indica (Andr) Focke against Mosquito. Acta Agric Boreali-Occidentalis Sin 2015;24:156-60.
- Ma YT. Cultivation technology and garden application of Duchesnea indica. South China Agric 2014;8:4-5.
- Qin SY, Liu W, Zhang YY, Chen XH, Lao J, Bi KS. Preliminary study on the anti-tumor effect of the extracts of four traditional Chinese medicines. Northwest Pharm J 2007;22:16-8.
- Yang WE, Ho YC, Tang CM, Hsieh YS, Chen PN, Lai CT, et al. Duchesnea indica extract attenuates oral cancer cells metastatic potential through the inhibition of the matrix metalloproteinase-2 activity by down-regulating the MEK/ERK pathway. Phytomedicine 2019;63:152960.
[Crossref] [Google Scholar] [PubMed]
- Xiang B, Yu X, Li B, Xiong Y, Long M, He Q. Characterization, antioxidant, and anticancer activities of a neutral polysaccharide from Duchesnea indica (Andr.) Focke. J Food Biochem 2019;43(7):e12899.
[Crossref] [Google Scholar] [PubMed]
- Wu YJ, Wang CN, Liu JT, Li HZ, Yuan XH. The effect of oleanolic acid in the Herba Duchesnese indica on SMMC-7721 cells line. Chin J Biochem Pharm 2011;32:45-9.
- Peng B, Chang Q, Wang L, Hu Q, Wang Y, Tang J, et al. Suppression of human ovarian SKOV-3 cancer cell growth by Duchesnea phenolic fraction is associated with cell cycle arrest and apoptosis. Gynecol Oncol 2008;108(1):173-81.
[Crossref] [Google Scholar] [PubMed]
- Chen PN, Yang SF, Yu CC, Lin CY, Huang SH, Chu SC, et al. Duchesnea indica extract suppresses the migration of human lung adenocarcinoma cells by inhibiting epithelial-mesenchymal transition. Environ Toxicol 2017;32(8):2053-63.
[Crossref] [Google Scholar] [PubMed]
- Naito S, von Eschenbach AC, Giavazzi R, Fidler IJ. Growth and metastasis of tumor cells isolated from a human renal cell carcinoma implanted into different organs of nude mice. Cancer Res 1986;46(8):4109-15.
[Google Scholar] [PubMed]
- Li YL, Wen JF, Tang JW. Pathology. People's Medical Publishing House. 7th ed. Beijing; 2010.
- Zheng Y, Wang ZZ. Interpretation of global colorectal cancer statistics. Zhonghua Liu Xing Bing Xue Za Zhi 2021;42(1):149-52.
[Crossref] [Google Scholar] [PubMed]
- Thiery JP. Epithelial-mesenchymal transitions in tumour progression. Nat Rev Cancer 2002;2(6):442-54.
[Crossref] [Google Scholar] [PubMed]
- Xie F, Zhang Z, van Dam H, Zhang L, Zhou F. Regulation of TGF-β superfamily signaling by SMAD mono-ubiquitination. Cells 2014;3(4):981-93.
[Crossref] [Google Scholar] [PubMed]
- Ard S, Reed EB, Smolyaninova LV, Orlov SN, Mutlu GM, Guzy RD, et al. Sustained SMAD2 phosphorylation is required for myofibroblast transformation in response to TGF-β. Am J Respir Cell Mol Biol 2019;60(3):367-9.
[Crossref] [Google Scholar] [PubMed]
 NaCl
NaCl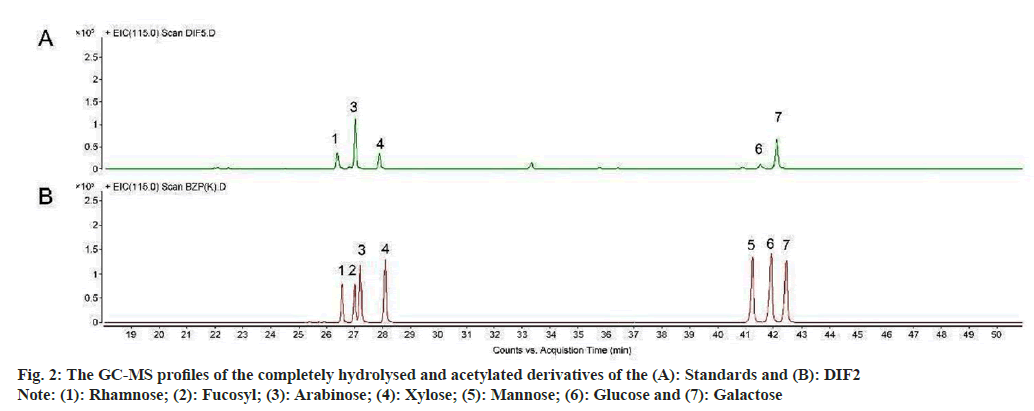
 DIF2-H and
  Positive
 21 d and
  28 d
28 d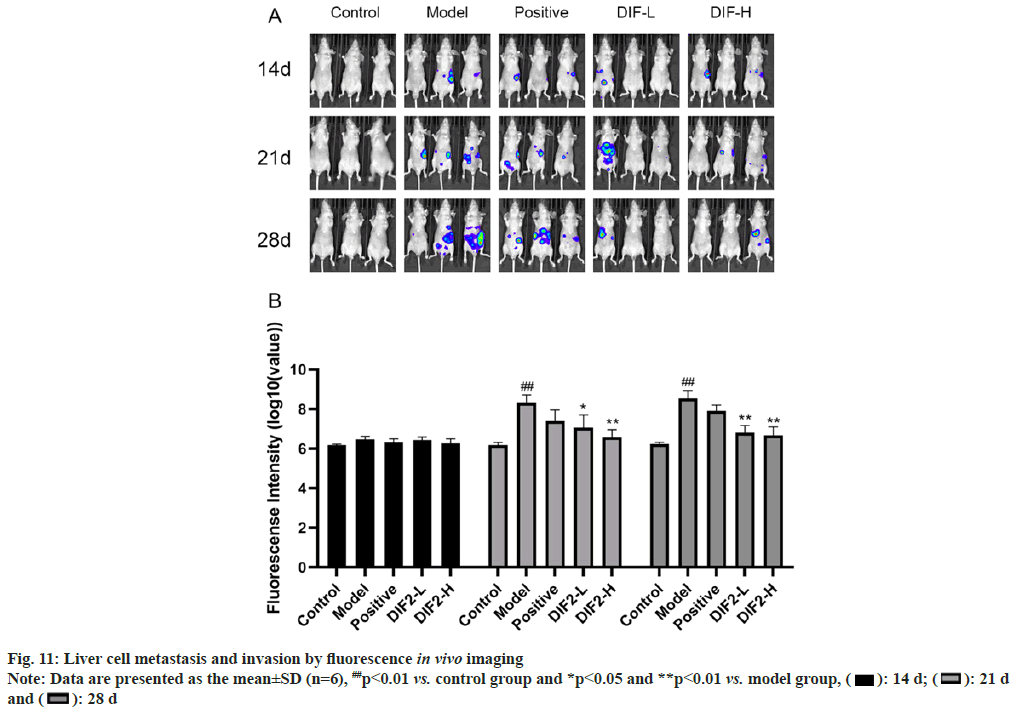
 21 d and
  28 d
28 d