- *Corresponding Author:
- Nashunbayaer
Department of Histology and Embryology, School of Basic Medical Sciences, Inner Mongolia Medical University, 010110, China
E-mail: nashunbayaer@163.com
| This article was originally published in a special issue,“Clinical Advancements in Life Sciences and Pharmaceutical Research” |
| Indian J Pharm Sci 2024:86(5) Spl Issue “74-81” |
This is an open access article distributed under the terms of the Creative Commons Attribution-NonCommercial-ShareAlike 3.0 License, which allows others to remix, tweak, and build upon the work non-commercially, as long as the author is credited and the new creations are licensed under the identical terms
Abstract
Obesity can lead to an elevated risk of asthma, however, the associated mechanism between them remains largely unclear. The present work analyzed how diet-induced obesity affects tumor necrosis factor alpha expression and its protein expression in the lungs of Bama mini pigs following ovalbumin treatment. Altogether 20 mini pigs were randomized into 4 groups (5 pigs in each group) namely, control with normal diet, ovalbumin-sensitization with normal diet, control with high-fat diet and ovalbumin-sensitization with high-fat diet. Mini pigs were raised using high-fat diet or standard pellets for 23 mo; in the final month, they were sensitized and challenged with saline or ovalbumin. After these treatments, lungs were collected to detect tumor necrosis factor-alpha messenger ribonucleic acid through real-time polymerase chain reaction assay. Body weight, lipid profiles and obesity indices were elevated in diet-induced obesity groups. Additionally, tumor necrosis factor-alpha and messenger ribonucleic acid expression significantly elevated in ovalbuminsensitization groups compared with the remaining groups (p<0.001). Besides, tumor necrosis factor-alpha and messenger ribonucleic acid expression of sensitization+high-fat diet group evidently elevated relative to remaining groups (p<0.001). According to our findings, high-fat diet upregulated tumor necrosis factoralpha, messenger ribonucleic acid and tumor necrosis factor-alpha protein expression within the experimental asthma model. Moreover, obesity-related asthma probably results in local pro-inflammatory factor activation and release.
Keywords
Asthma, tumor necrosis factor, obesity, ketamine, xylazine, methacholine
Obesity and its related metabolic diseases have been the global health issues, which gradually become the pandemic. There are >500 million people affected by overweight or obesity[1]. Obesity and asthma show increasing incidence rates over the last 10 y. Obesity has been identified as the key factor related to asthma[2]. Typically, asthma exhibits an increased prevalence among obese adults relative to lean counterparts. Besides, obesity leads to 2.3 and 2.0-fold elevated asthma risk among adults and children, separately[3,4]. For people with obesity and asthma have poor response to representative asthma medications, thereby resulting in the increased utilization of asthma-related healthcare and reduced life quality[5,6]. As estimated by the World Health Organization (WHO), there are >230 million asthmatic patients and this number keeps increasing; however, efficient prevention measures are lacking for the time being[7]. Epidemiological results have Asthma, tumor necrosis factor, obesity, ketamine, xylazine, methacholine
Obese asthmatic cases are usually deemed as serious and under poor control[8,9], which may be associated with their lower responsiveness to corticosteroids and distinct (less atopic) inflammatory phenotype[10]. Numerous inflammatory factors (either pro- or antiinflammatory ones), like adiponectin, adipokine leptin, visfatin and resistin together with chemokines and cytokines such as monocyte chemoattractant protein, Tumor Necrosis Factor-Alpha (TNF-α) and Interleukin (IL)-6 are generated and released by the adipose tissue[11] which is considered to be the active endocrine organ that can produce various inflammatory cytokines. Such adipose tissuereleased cytokines, which are also referred to as adipocytokines, can trigger and amplify inflammatory processes, thereby causing or exacerbating obesityrelated conditions[11-14]. Typical adipocytokines include leptin, TNF-α, IL-6 and IL-23, which can not only cause chronic low-grade inflammation within different organs[15], but also participate in lung disease pathogenesis[16].
Mini pigs share similar physiological features and organ sizes with humans, where they are identified as the ideal models. Mini pigs of diverse types are fed with high-fat, cholesterol and sucrose or combination diet for generating human obesity model. For instance, Clark et al.[17] utilized mini pigs as a model for studying how Diet-Induced Obesity (DIO) affected types of skeletal muscle fibers. Nonetheless, such models can be established in just few weeks or months and mimic human disease process. In this study, Bama mini pigs were selected to construct models for mimicking human obesity as well as its related metabolic diseases through chronic dietary induction. Our work might facilitate the relation of obesity with asthma by focusing to determine TNF-α protein expression within lung tissues and evaluating its messenger Ribonucleic Acid (mRNA) expression differences between lean and obese mini pigs using an experimental asthma model.
Materials and Methods
Animal model:
Humane care was provided to all the animals following guide for care and use of laboratory animals. Each procedure gained approval from Animal Care and Use Committee of Animal Center of Southern Medical University (Approval No: SYXK 2011-0074).
Prior to this study, 6 mo Bama mini pigs were classified into 4 groups to receive 23 mo treatment with 5 animals in each group. Mini pigs were raised in cages under 22°, with 40 %-70 % humidity and 12/12 h light-dark cycle; they were allowed to freely drink water and eat food during adaptive feeding and experimental processes. Following 1 w adaptive feeding, 20 mini pigs were randomized into 4 groups, namely Control (C) with Normal Diet (ND) (C+ND), Ovalbumin (OVA), Sensitization (S) with ND (S+ND), C with High-Fat Diet (C+HFD) and OVA-S with HFD. Briefly, in C+HFD and S+HFD groups (DIO model), all mini pigs were raised using HFD which comprised of 45 % fat-derived energy, 20 % protein-derived energy and 35 % carbohydrate-derived energy at the restricted dietary dose and scheduled twice daily, whereas those of the remaining groups (C+ND and S+ND) were raised with a standard chow diet comprising of 10 % fatderived energy, 28 % protein-derived energy and 61 % carbohydrate-derived energy.
After 1 mo, mini pigs of S+ND and S+HFD groups were subjected to OVA-S for 22 mo on the basis of the prior regimen.
Animal sensitization:
S+ND and S+HFD mini pigs were given intraperitoneal injection of 1 mg OVA as well as 200 mg Aluminium hydroxide (Al(OH)3) (Sigma, New York, United States of America (USA)) per 1 ml saline solution. Then, the animals were placed in a closed cage and exposed to 4 % OVA aerosol (solution contained in 2 ml saline) for 15 min period every day with the nebulizer (CX3, Omron Healthcare, Netherlands) whereas C+ND and C+HFD mini pigs received similar saline treatment rather than with OVA solution.
Body weight:
The body weights of mini pigs were measured monthly on the specific day (at 17:00) throughout this experiment. After the experiment, mini pigs were given ketamine and xylazine at 50 mg/kg for anesthesia, then their body weights and nasoanal lengths (distance from nose and anus) were taken. The obesity indices were calculated by determining the final body weight, Lee index and Body Fat (BF) Percentage (%).
Body weight change %=Final weight-baseline weight/baseline weight×100
Lee index (mg/mm)=Final weight0.33/nasoanal length and BF %=0.73 (Lee index-280.8).
Glucose Tolerance Test (GTT):
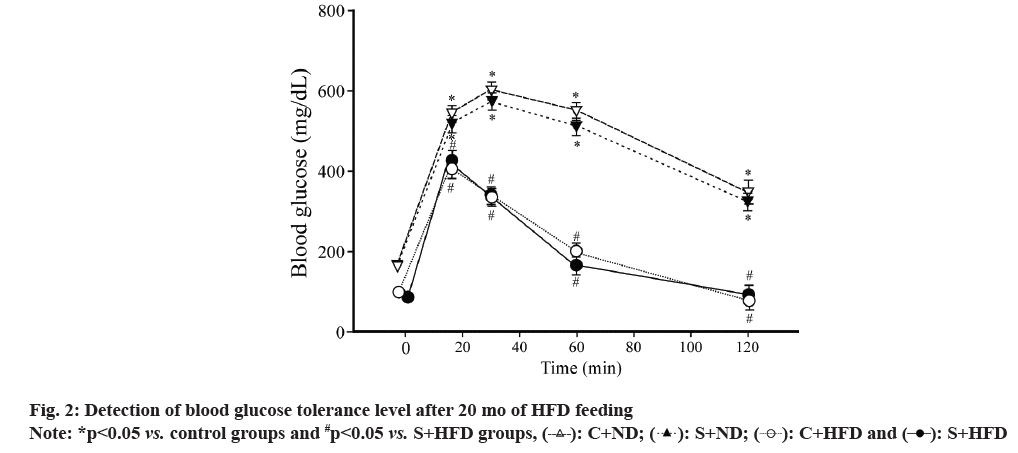
After 20 mo following HFD administration, GTT was conducted. After overnight fasting, mini pigs were intraperitoneally injected with glucose at 2 g/kg body weight (Sigma-Aldrich, St. Louis, Missouri). Blood samples were later extracted from anterior vein at 0, 15, 30, 60 and 120 min following glucose administration. Blood glucose meter (OneTouch Ultra, LifeScan Inc., USA) was employed for measuring the blood glucose level.
Airway Hyperresponsiveness (AHR):
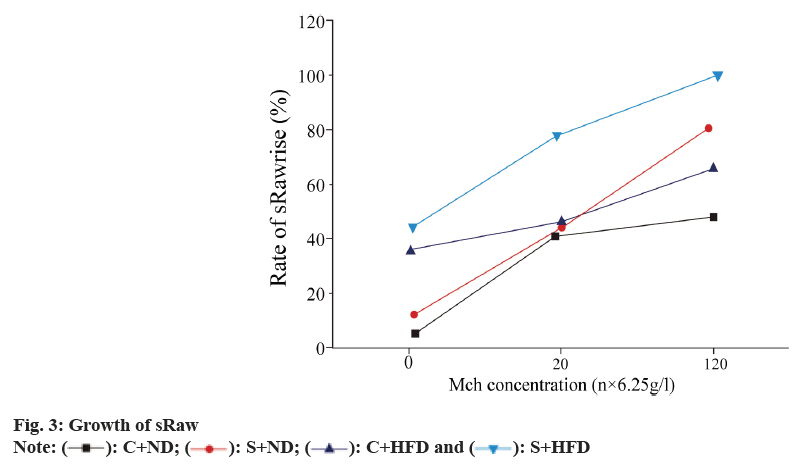
Double-chamber plethysmography device (TBL4500, Buxco, USA) was utilized to evaluate AHR according to the elevated specific airway Resistance (sRaw). To be specific, after 3 min of exposure to nebulized
Phosphate Buffered Saline (PBS), mini pigs were further treated with nebulized methacholine at the elevating concentrations (6.25-25 mg/ml) with the aerosonic ultrasonic nebulizer (Sigma, USA), for constructing baseline sRaw levels. The recordings were acquired in 3 min after every nebulization cycle. sRaw levels determined in every 3 min period were added to calculate the average as every methacholine concentration.
Elevated sRaw level=sRaw with each methacholine concentration-sRaw with PBS/sRaw with PBS×100 %
Biochemical factors:
After fasting, mini pigs were given ketamine and xylazine injection for anesthesia. Thereafter, 5 ml blood samples were extracted from anterior vena cava of each mini pig and were transferred into Ethylenediamine Tetraacetic Acid (EDTA) containing free tube. Afterwards, the auto blood analyzer (Bayer Corp, USA) was utilized to analyze plasma Total Cholesterol (TC), Triglycerides (TG) and High/Low Density Lipoprotein-Cholesterol (HDL-C/LDL-C) contents. We acquired TC, TG and HDL-C assay kits in Pars Azmoon Co., Iran and determined LDL-C content by Friedewald formula.
LDL-C=TC-(HDL-C+TG/5)
Real-time Polymerase Chain Reaction (PCR):
We utilized the NanoDrop 1000 spectrophotometer (Thermo scientific, USA) for determining RNA quantity and quality. To determine TNF-α mRNA, we used RevertAid 1st strand copy Deoxyribonucleic Acid (cDNA) synthesis kit (Fermentas, Germany) by adopting Moloney Murine Leukemia Virus (MMLV) reverse transcriptase and random hexamer primers (the integrative system adopted to efficiently synthesize 1st strand cDNA based on the total RNA or mRNA templates). SYBR Green (SG) master mix was then utilized to conduct mRNA real-time quantitative PCR, with cDNA as template.
Real-time PCR was conducted using the Rotor-Gene 6000 device (Corbett Life Science, Australia). Later, we normalized the PCR product level of mRNA extracted samples to that of housekeeping Beta (β) glucuronidase gene. TNF-α mRNA was quantified by the 2-ΔΔCt approach and the results were indicated by fold change relative to corresponding controls.
Tissue sample collection and protein determination:
After the experiment, mini pigs were intraperitoneally administered with 50 mg/kg ketamine as well as 5 mg/kg xylasin for anesthesia prior to sacrifice. Thereafter, lung tissues were collected, immersed within liquid nitrogen which were preserved under -70° before subsequent TNF-α level determination. After measuring lung tissue weight, the samples were subjected to homogenization within PBS maintained at pH of 7.2-7.4. Further centrifugation was carried out for 20 min at 3000 rpm maintained at 4°. After collecting supernatants, TNF-α protein expression was determined with double-sandwich Enzyme Linked Immunosorbent Assay (ELISA) kit in line with specific protocols (Boster Biological Technology, Co., Ltd.,).
Statistical analysis:
Statistical Package for Social Sciences (SPSS) version 18.0 was utilized to determine inter- and intra-group differences in body weight, serum and tissue biochemical factors. Multiple comparisons were conducted through one-way analysis of variance and Least Significant Difference (LSD) t-test. Results were indicated by mean±Standard Deviation (x̄ ±SD) where p<0.05 was indicated to be a significant difference.
Results and Discussion
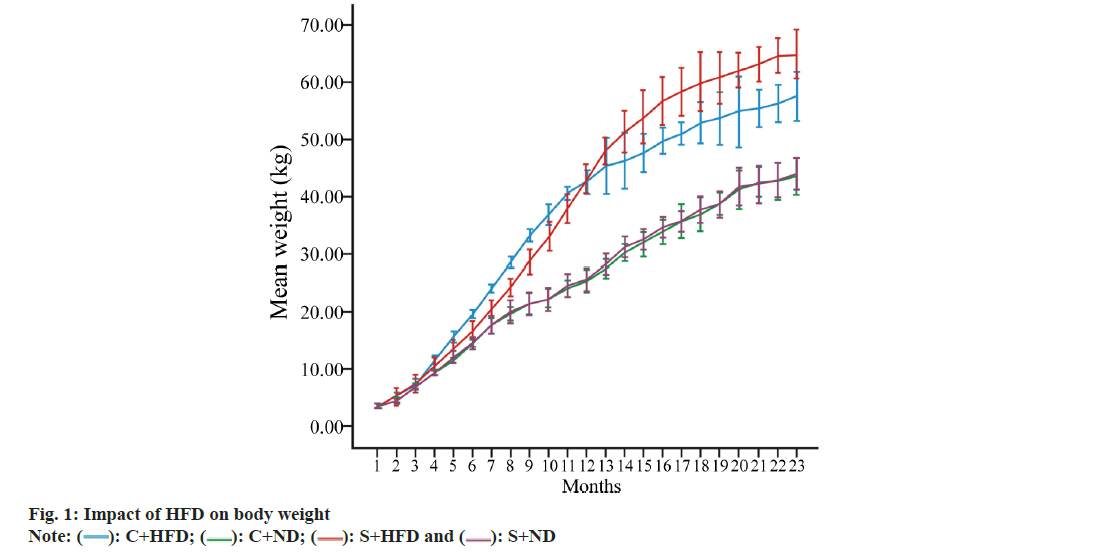
Primarily, body weight and fat % of the rats was analyzed. Table 1, displays the baseline body weight, final body weight, Lee index and BF % in each group in terms of mean. According to our findings, DIO markedly increased final body weight, Lee index as well as BF % of C+HFD and S+HFD groups compared with C+ND and S+ND groups (p<0.05 to p<0.001). Nonetheless, weight change was not significantly different in lean (C+ND vs. S+ND) compared with obese groups (C+HFD vs. S+HFD) (fig. 1).
| Variables | C+ND | S+ND | C+HFD | S+HFD |
|---|---|---|---|---|
| Baseline body weight (kg) | 3.60±0.16 | 3.56±0.16 | 3.62±0.15 | 3.56±0.15 |
| Final body weight (kg) | 43.47±1.57 | 44.00±1.41 | 57.52±5.14 | 64.88±12.15*+ |
| Body weight change % | 1100.34±97.28 | 1136.36±41.87 | 1493.70±119.78**+ | 1727.12±115.99***++ |
| Lee index (mg/mm) | 288.22±3.42 | 289.47±3.09 | 316.25±3.92**++ | 329.54±3.60**++ |
| BF % | 5.48±2.50 | 6.33±2.25 | 28.50±2.86**++ | 35.22±2.63**++ |
Note: *p<0.05, **p<0.01 and ***p<0.001 in C+ND vs. remaining groups and +p<0.05, ++p<0.01 and +++p<0.001 in S+ND vs. C+HFD and S+HFD groups
Table 1: Changes in Weight and Obesity Indices of the Four Groups (n=5)
Further, GTT levels in the rats of all the groups were observed. Obesity is the metabolic disorder and obese individuals generally experience spontaneous glucose intolerance within blood stream, like the phenomenon observed in type II diabetes mellitus. Mini pigs in C+HFD group showed glucose tolerance impairment but those in S+ND and S+HFD groups had improved glucose tolerance like that observed in C+ND group (fig. 2).
We studied about the sRaw growth in all the groups. sRaw levels in OVA-sensitized groups slowly grew following methacholine inhalation at varying concentrations relative to the control group. Mini pigs in obese group had marked sRaw growth at the low methacholine concentration (6.25 g/l) (p<0.01), but sRaw did not significantly elevate at moderate (12.5 g/l) or high (25 g/l) concentration (p>0.05). For obese asthmatic animals, sRaw levels significantly elevated at all methacholine concentrations compared with asthma group (p<0.01) (fig. 3).
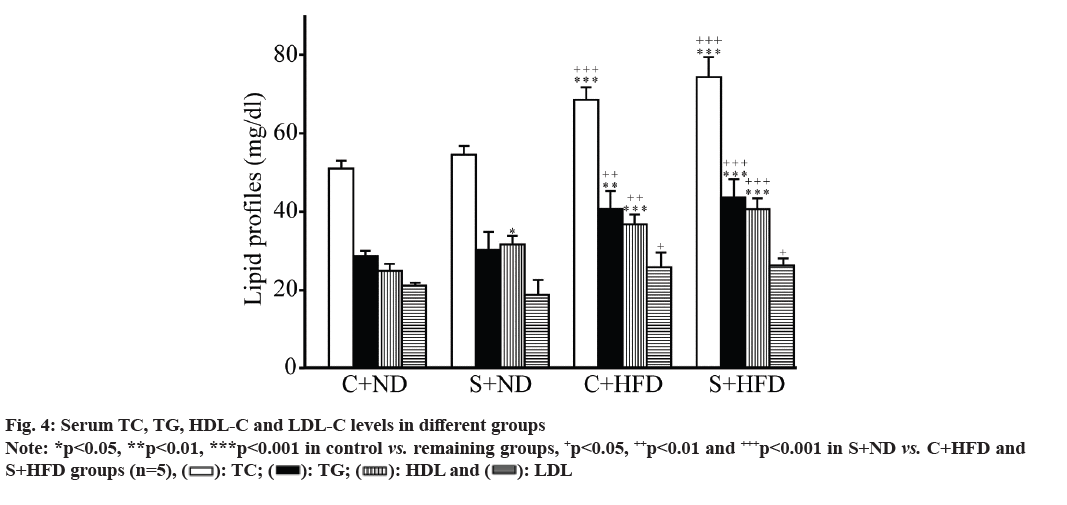
Serum lipid profiles (TC, TG, HDL-C and LDL-C) between the groups were displayed (fig. 4). Lipid profiles in C+HFD and S+HFD (obese) groups markedly increased compared with control groups (p<0.05 to p<0.001). HDL in C+ND group was significantly different from S+ND group (p<0.05), while those remaining three indicators (TC, TG and LDL) were not different between control (C+ND and S+ND) and obese groups (C+HFD and S+HFD).
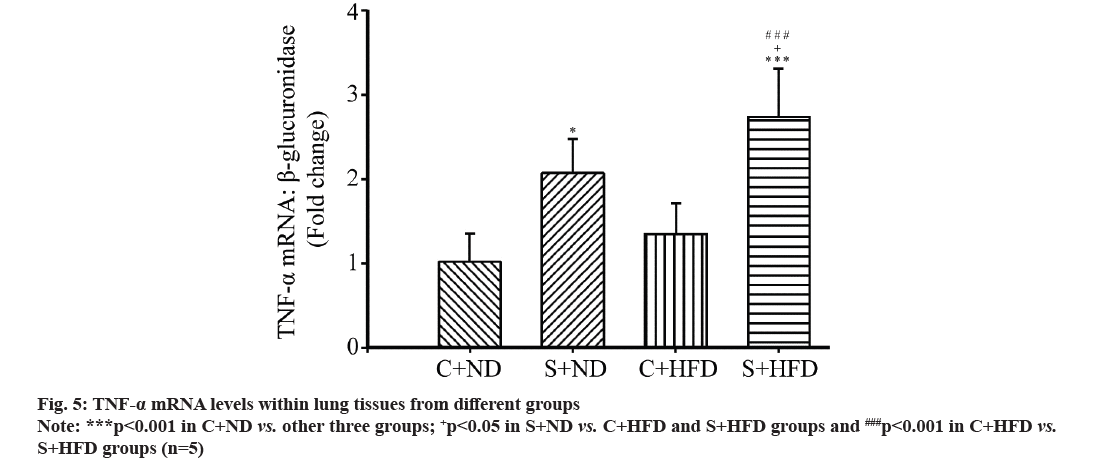
TNF-α mRNA levels in the groups were compared. As presented in fig. 5, TNF-α mRNA levels within lung tissues of S+HFD group apparently increased compared with those remaining three groups (p<0.05 to p<0.001) and that of S+ND group markedly elevated relative to C+ND group (p<0.05), but in C+ND group, mRNA levels of TNF-α were not significantly different from C+HFD group.
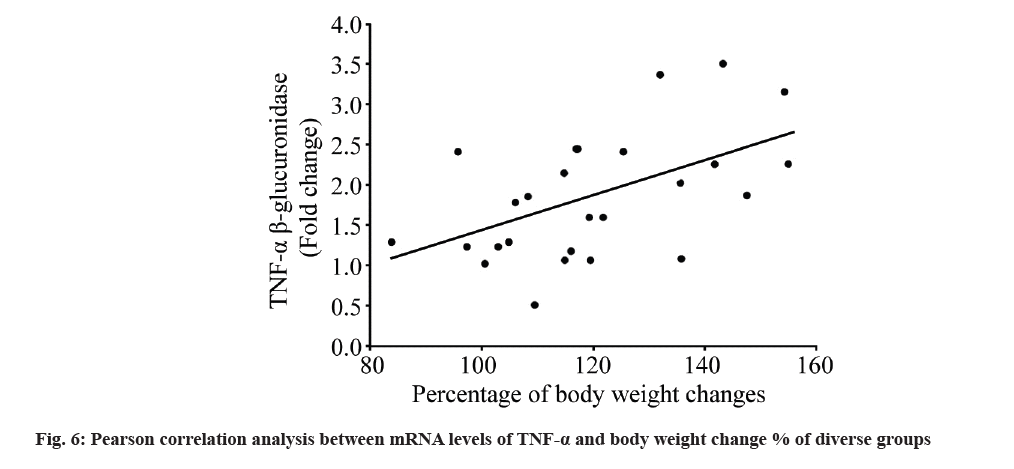
Subsequently, the relationship between mRNA level of TNF-α and obesity indices were studied; mRNA levels of TNF-α showed significant positive relation to weight change % (r=0.537 and p<0.05) (fig. 6), but not to Lee index (r=0.249 and p=0.271) or BF % (r=0.238 and p=0.271).
Likewise, TNF-α protein expression was also analyzed. OVA-S markedly elevated TNF-α protein expression of S+ND and S+HFD groups compared with control groups (C+ND and C+HFD) (p<0.05 to p<0.001) (fig. 7). Besides, DIO markedly elevated TNF-α protein expression of S+HFD compared with S+ND groups (p<0.01). But TNF-α protein level was not significantly different in C+ND compared with C+HFD groups.
Obesity represents the low-grade chronic proinflammatory condition[18], but its relation with human airway inflammation and asthma remains unclear. Many experiments are performed to analyze the relation among obesity, airway inflammation and asthma. However, they usually utilize geneticallyengineered animals for illustrating the mechanisms underlying obesity with asthma. However, such genetically obese mice, including leptin receptordeficient (db/db) and leptin-deficient (ob/ob) mice are associated with certain complications like comorbidities affecting airway immunity[19].
HFD was utilized in the present work for inducing obesity of Bama mini pigs. According to our findings, DIO elevated body weights and obesity indices (weight change %, Lee index and fat %) in mini pigs, conforming to prior studies. Besides, due to DIO, obese groups showed markedly elevated lipid profiles (TC, TG, HDL-C and LDL-C).
AHR, smooth muscle hypertrophy and bronchoalveolar lavage fluid eosinophilia are the typical characteristics of asthma in humans. Typically, asthma is pathophysiologically characterized by airway remodeling, as evidenced by hyperplasia of goblet cells, basement membrane thickening, angiogenesis, collagen deposition, sub-epithelial fibrosis, hyperplasia and hypertrophy of airway smooth muscle[20].
According to our results, OVA-S exhibited certain characteristics of human asthma in obese and lean groups, including airway smooth muscle hyperplasia, emphysema, edema and lymphoid hypertrophy, especially in the obese group. Certain lung histological changes closely resembled asthma in obese individuals. As suggested by Camargo et al.[21] obesity reduced airway caliber while increasing bronchial hyperresponsiveness of obese rats.
Various inflammatory moieties, which show upregulation within the blood of obese people, have aroused wide attention. There are 40 specific cytokines, especially IL-1β, suggested to change airway responsiveness during asthma[22]. Sun et al.[23] suggested that airway smooth muscle contributed to synthesizing and releasing TNF-α among asthmatic patients, demonstrating the role of TNF-α in airway smooth muscles via the autocrine manner.
According to our findings in this work, OVA-S did not up-regulate TNF-α expression in mini pigs. Besides, DIO up-regulated lung TNF-α expression in comparison with the remaining groups, conforming to an article that reports TNF-α up-regulation within lung tissues. Further, post-translational alterations in obese-asthmatic patients led to TNF-α release within lung tissues.
TNF-α overexpression and secretion in lung tissues of obese and sensitized rats suggested lung tissue functional modification, which resulted in autologous TNF-α expression. Moreover, the elevated TNF-α production induces the generation of more inflammatory factors, thus affecting lung function and exacerbating lung inflammation during asthma[24]. TNF-α over-expression within lung tissues indicated that autocrine mechanisms were probably related to the pathophysiology of obese-asthmatic model.
TNF-α is widely suggested to trigger the generation of diverse interleukins, including IL-1, IL-6, IL-8, IL-11 and IL-15, and these can aggravate asthma. Many hypotheses are put forward to explore the relation between obesity and asthma, which are probably ascribed to the function of obesity with immunity. Apart from producing adipokine leptin, adipose tissue can also produce cytokines, like IL-1β and TNF-α.
Such cytokines affect different asthma processes, like releasing IL-9, damaging bronchial epithelial cells, recruiting and adhering eosinophils onto airway epithelial cells, as well as bronchoconstriction. Mechanisms involved in exerting TNF-α autocrine effects are complex, adding to the difficulty in explaining obesity and asthma. Actually, more TNF-α axis members must be taken into account to further understand TNF-α’s function. TNF-α is reported to play a role via targeting TNF-α type I receptor.
According to our results, in asthma, weight gain promoted TNF-α expression. Asthma, as the chronic inflammatory condition, can upregulate traditional biomarker levels, like exhaled Nitric oxide (eNO) and eosinophils. However, in obeseasthmatic condition, such biomarkers are not greatly upregulated as Body Mass Index (BMI) elevates. There may be additional mechanisms associated with the obesity pathophysiology in asthma[25]. According to the aforementioned discussion, asthma phenotype can alter under obese condition. Collectively, DIO upregulates the TNF-α level within lung tissues of OVA-sensitized mini pigs. TNF-α, as an important factor which exerts pro-inflammatory effects on every cell type. Based on numerous human and animal studies, diverse cytokines are upregulated under the obese-asthmatic condition. TNF-α overexpression at obese state probably exacerbates airway inflammation during asthma. The increased TNF-α level in blood stream and autocrine effect contributes to the synergistic exacerbation of airway inflammation under the obese-asthmatic condition.
Author’s contributions:
Tuya Bao and Jimusi have contributed equally to this article.
Funding:
This work was supported by Inner Mongolia Autonomous Region Natural Science Foundation Project (Grant No: 2022LHMS03003), 2020 Inner Mongolia Autonomous Region Local Talent Introduction Project and Hohhot Health Science and Technology Plan Project (Hohhot Healthcare No: 2023001).
Conflict of interests:
The authors declared no conflict of interests.
References
- Akhmedov D, Berdeaux R. The effects of obesity on skeletal muscle regeneration. Front Physiol 2013;4:1-12.
[Crossref] [Google Scholar] [PubMed]
- Dixon AE, Holguin F, Sood A, Salome CM, Pratley RE, Beuther DA, et al. An official American thoracic society workshop report: Obesity and asthma. Proc Am Thorac Soc 2010;7(5):325-35.
[Crossref] [Google Scholar] [PubMed]
- Chen YC, Dong GH, Lin KC, Lee YL. Gender difference of childhood overweight and obesity in predicting the risk of incident asthma: A systematic review and meta-analysis. Obes Rev 2013;14(3):222-31.
[Crossref] [Google Scholar] [PubMed]
- Chen CZ, Hsu CH, Li CY, Hsiue TR. Insulin use increases risk of asthma but metformin use reduces the risk in patients with diabetes in a Taiwanese population cohort. J Asthma 2017;54(10):1019-25.
[Crossref] [Google Scholar] [PubMed]
- Wenzel SE. Asthma phenotypes: The evolution from clinical to molecular approaches. Nat Med 2012;18(5):716-25.
[Crossref] [Google Scholar] [PubMed]
- Sutherland ER, Lehman EB, Teodorescu M, Wechsler ME, Heart N. Body mass index and phenotype in subjects with mild-to-moderate persistent asthma. J Allergy Clin Immunol 2009;123(6):1328-34.
[Crossref] [Google Scholar] [PubMed]
- WHO. Obesity and overweight (WHO Fact Sheet No.311). WHO Media centre 2006.
- González-Freire B, Vázquez I. Quality of life in adults with asthma treated in allergy and pneumology subspecialties: Relationship with sociodemographic, clinical and psychological variables. Qual Life Res 2017;26(3):635-45.
[Crossref] [Google Scholar] [PubMed]
- Li T, Ke Y, Cheng H. Research progress on the role of neutrophils in asthma. Zhejiang Da Xue Xue Bao Yi Xue Ban 2016;45(5):544-9.
[Crossref] [Google Scholar] [PubMed]
- Camargo CA, Sutherland ER, Bailey W, Castro M, Yancey SW, Emmett AH, et al. Effect of increased body mass index on asthma risk, impairment and response to asthma controller therapy in African Americans. Curr Med Res Opin 2010;26(7):1629-35.
[Crossref] [Google Scholar] [PubMed]
- Divella R, de Luca R, Abbate I, Naglieri E, Daniele A. Obesity and cancer: The role of adipose tissue and adipocytokines-induced chronic inflammation. J Cancer 2016;7(15):2346-59.
[Crossref] [Google Scholar] [PubMed]
- Kim HJ, Kim Y, Park SJ, Bae B, Kang HR, Cho SH, et al. Airway smooth muscle sensitivity to methacholine in Precision-Cut Lung Slices (PCLS) from ovalbumin-induced asthmatic mice. Korean J Physiol Pharmacol 2015;19(1):65-71.
[Crossref] [Google Scholar] [PubMed]
- Halonen M, Lohman IC, Stern DA, Ellis WL, Rothers J, Wright AL. Perinatal tumor necrosis factor-alpha production, influenced by maternal pregnancy weight gain, predicts childhood asthma. Am J Respir Crit Care Med 2013;188(1):35-41.
[Crossref] [Google Scholar] [PubMed]
- Jia G, Jia Y, Sowers JR. Contribution of maladaptive adipose tissue expansion to development of cardiovascular disease. Compr Physiol 2016;7(1):253-62.
[Crossref] [Google Scholar] [PubMed]
- McArdle MA, Finucane OM, Connaughton RM, McMorrow AM, Roche HM. Mechanisms of obesity-induced inflammation and insulin resistance: Insights into the emerging role of nutritional strategies. Front Endocrinol 2013;4:1-5.
[Crossref] [Google Scholar] [PubMed]
- Shah D, Romero F, Duong M, Wang N, Paudyal B, Suratt BT, et al. Obesity-induced adipokine imbalance impairs mouse pulmonary vascular endothelial function and primes the lung for injury. Sci Rep 2015;5(1):1-11.
- Clark BA, Alloosh M, Wenzel JW, Sturek M, Kostrominova TY. Effect of diet-induced obesity and metabolic syndrome on skeletal muscles of Ossabaw miniature swine. Am J Physiol Endocrinol Metab 2011;300(5):848-57.
[Crossref] [Google Scholar] [PubMed]
- Shore SA. Obesity and asthma: Lessons from animal models. J Appl Physiol 2007;102(2):516-28.
[Crossref] [Google Scholar] [PubMed]
- Chandra RK. Cell-mediated immunity in genetically obese (C57BL/6J ob/ob) mice. Am J Clin Nutr 1980;33(1):13-6.
[Crossref] [Google Scholar] [PubMed]
- Mohanan S, Tapp H, McWilliams A, Dulin M. Obesity and asthma: Pathophysiology and implications for diagnosis and management in primary care. Exp Biol Med 2014;239(11):1531-40.
[Crossref] [Google Scholar] [PubMed]
- Camargo CA, Weiss ST, Zhang S, Willett WC, Speizer FE. Prospective study of body mass index, weight change, and risk of adult-onset asthma in women. Arch Intern Med 1999;159(21):2582-8.
[Crossref] [Google Scholar] [PubMed]
- Ziaee V, Maddah M, Harsini S, Rezaei A, Sadr M, Zoghi S, et al. Association of interleukin-1 family gene polymorphisms with juvenile idiopathic arthritis in Iranian population. Allergol Immunopathol 2016;44(6):542-6.
[Crossref] [Google Scholar] [PubMed]
- Sun C, Chen L, Shi X, Cao Z, Hu B, Yu W, et al. Combined effects of proinflammatory cytokines and intermittent cyclic mechanical strain in inhibiting osteogenicity in human periodontal ligament cells. Cell Biol Int 2016;40(9):999-1007.
[Crossref] [Google Scholar] [PubMed]
- Qiu B, Gong M, He QT, Zhou PH. Controlled release of interleukin-1 receptor antagonist from hyaluronic acid-chitosan microspheres attenuates interleukin-1β-induced inflammation and apoptosis in chondrocytes. Biomed Res Int 2016;2016(1):1-6.
[Crossref] [Google Scholar] [PubMed]
- McLachlan CR, Poulton R, Car G, Cowan J, Filsell S, Greene JM, et al. Adiposity, asthma, and airway inflammation. J Allergy Clin Immunol 2007;119(3):634-9.
[Crossref] [Google Scholar] [PubMed]
