- *Corresponding Author:
- J. Lee
National Institute of Environmental Research, Incheon, Republic of Korea
E-mail: seo@eulji.ac.kr
| This article was originally published in a special issue, “Recent Trends in Biomedical Research” |
| Indian J Pharm Sci 2020:82(1)spl issue1;XX-XX |
This is an open access article distributed under the terms of the Creative Commons Attribution-NonCommercial-ShareAlike 3.0 License, which allows others to remix, tweak, and build upon the work non-commercially, as long as the author is credited and the new creations are licensed under the identical terms
Abstract
This study aimed to develop a Korean version of the Environmental Relative Moldiness Index based on the specific distribution of fungal flora in Korea. A total of 126 dwellings were selected for mold sampling, and each was classified as, Flooded, Water leaks/condensation, or Non water-damaged. Dust on floors was sampled using a vacuum cleaner with a Dustream collector and analyzed by quantitative polymerase chain reaction for 36 types of molds included in the Environmental Relative Moldiness Index. The Environmental Relative Moldiness Index value was found to be 19.6 (-6.9–58.8) for flooded houses, 7.5 (-29.2–48.3) for water-damaged houses with leaks/condensation, and 0.8 (-29.2–37.9) for non-damaged dwellings. Significant differences were observed between flooded and non-water damaged dwellings (p<0.001) and between water-damaged and non-water damaged dwellings (p<0.032). The Korean Environmental Relative Moldiness Index consisted of 16 fungal species, which are very similar to those normally found in the Environmental Relative Moldiness Index in Korea (p=0.834). These findings indicate that Environmental Relative Moldiness Index values attributed to dust samples in Korea could be utilized for identification of flooded or water-damaged buildings. The Korean Environmental Relative Moldiness Index could also be a promising tool for inexpensive assessment of long-term fungal exposure in Korean dwellings.
Keywords
Airborne mold, condensation, ERMI, floor dust, water damage
According to the Institute of Medicine and the World Health Organization (WHO)[1], fungal exposure has a significant cause-and-effect linkage to allergic disease outbreaks. The adverse health effects of exposure to mold in everyday life are well known, with established results from many types of research[2-10]. For this reason, the WHO warns of the risk of mold exposure and recommends keeping airborne mold below a certain exposure concentration level (<500 CFU/m3). For mold exposure assessment, the method of counting spores after mold collection in the air and after culturing or microscopic observation is primarily used due to its relatively low cost. However, this analytical method has several limitations, the incubation period must be at least 4–5 d, there can be differences in results due to the researcher’s subjectivity in counting spores, and the sample must be transported to the laboratory for analysis. The WHO therefore strongly recommends the use of DNA-based fungal exposure assessment methods[11].
The United States Environmental Protection Agency (USEPA) has developed an Environmental Relative Moldiness Index (ERMI) that analyses mold DNA and identifies mold contamination in homes based on a moldspecific quantitative polymerase chain reaction[12]. The ERMI categorizes fungal species collected from floor dust into species found in water-damaged environments (S1 group, 26 species) and species found in houses without water damage (S2 group, 10 species). The difference in DNA content (ERMI=ΣS1–ΣS2) is used to determine whether the dwelling is damaged. In other words, ERMI values of households with high water damage are positive.
The ERMI index has been recognized as a reliable method in the United States for identifying fungal contamination and asthma risk in homes with young asthma patients[13-20]. Considering the current status of mold species and frequency of occurrence in each country with different latitudes and longitudes, mold damage can be assessed by modifying the ERMI index according to the environmental conditions of a specific country, as was done in Finland and France[21,22]. For this reason, this investigation aimed to establish the usual ERMI data found in Korean dwellings classified as flooded, water leak/condensation, and non-damaged. This study also explored developing a Korean ERMI (KERMI) using a few applicable fungal species for analysis and removing less common species to reduce the overall cost and improve efficiency.
Materials and Methods
Selection of dwellings:
This study was conducted from May 2016 to February 2018, and a total of 126 homes were selected and classified into 3 categories as follows, flooded (n=33), water leak/condensation (n=33), and non-damaged dwellings (n=60). In particular, water damaged houses have a history of water leakage and condensation on floors and walls. A survey was conducted to collect data on the characteristics of each house such as the year of construction and the frequency of occurrence of mold, in addition to the dust samples taken from the floors.
Sampling of dust from floors:
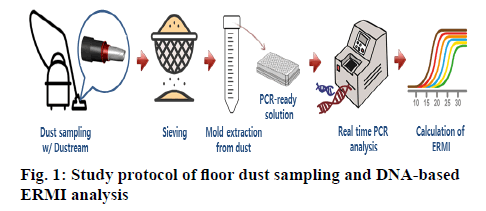
The samples of floor dust were collected by using a vacuum cleaner, on which a Dustream® Collector (Indoor Biotechnologies, Charlottesville, VA, USA) was mounted. The reference dust sampling area was 1×1 m2. However, if the amount of dust collected was insufficient (<0.5 g), a larger amount of dust was collected from a larger area; the area where the dust was collected was converted to the amount sampled from the area of 1×1 m2. The reference dust sampling time was 2 min/unit area (1 m2) of target. If the collected dust sample was not enough, it was collected several times to acquire fine dust of 0.5 g. The collected dust and filter were put into a plastic bag and the collection date, place, householder, were recorded; then the sample was transported to the laboratory and stored at 4° until analysis could be conducted (figure 1).
DNA extraction:
To extract DNA, the floor dust was sifted through a 300 μm sieve, thereby removing foreign substances such as hair. Then, DNA was extracted according to the protocol of Fast DNA Spin Kit (MP Biomedicals, USA). The floor dust was placed in a lysing matrix E tube along with 978 μl sodium phosphate buffer and 122 μl MT buffer. After homogenizing for 40 s at the maximum RPM of Omni bead ruptor, the pellet was centrifuged for 5-10 min at 14 000×g. The supernatant and 250 μl PPS solution were put into a 2 ml microcentrifuge and shaken about 10 times; then cultured for 10 min at room temperature. The solution was centrifuged for 5 min at 14 000×g and then 600-800 μl each of the supernatant and binding matrix were transferred into the microcentrifuge tube. After stirring for 3-5 min, 800 μl supernatant was put into the Spin filter tube and centrifuged for 5 min at 14 000×g. The centrifuge was repeated with the remaining supernatant and again after adding 500 μl of SEWS-M. To remove any residual ethanol, centrifugation was performed once more for 5 min, and finally, 100 μl diethylstilbestrol was placed in the 2 ml tube and centrifuged for 1 min.
A PCR system was used for gene amplification of extracted DNA (DNA thermal cycler, Applied Biosystems). For primers the ITS region’s primers were used: ITS5F (5’-GGAAGTAAAAGTCGTAACAAGG-3) and ITS4R (5’-TCCTCCGCTTATTGATATGC-3). The PCR mixture was 20 μl total with 1 μl template, 1 μl each of both primers, and sterile distilled water were added by using EmeraldAmp GT (RR310A, TaKaRa). For the amplified PCR product, electrophoresis was performed with 1 % ethidium bromide stained agarose gel at 100 V, and a fragment was examined. Furthermore, the PCR product was purified using a PCR purification kit (NAVIGEN, PC250KI).
Establishment of usual ERMI in dwellings of Korea:
For the ERMI of US EPA, about 1700 US households were investigated with 26 species of mold found in water-damaged homes (group I) and 10 species of mold found in normal homes (group II). These 36 mold species were chosen as index species, which are used for mold contamination level assessments (Table 1).
Table 1: ERMI Species in Floor Dust from Dwellings with Severe Mold/Moisture Damage and Non-Damaged Reference Homes
| Species | Dwelling type Cell/mg dust | ||
|---|---|---|---|
| Flooded | Water-damaged | Non-water-damaged | |
| Group I | |||
| Aspergillus flavus | 473.4 | 4.8 | 142.9 |
| Aspergillus fumigatus | 0.3 | 0.3 | 0.3 |
| Aspergillus niger | 7,201.30 | 97 | 1,471.00 |
| Aspergillus ochraceus | 1,004.40 | 69.2 | 9.7 |
| Aspergillus penicillioides | 170.4 | 55.7 | 53.7 |
| Aspergillus restrictus | 5,58,315.50 | 4,452.00 | 3,055.50 |
| Aspergillus sclerotiorum | 5,931.50 | 8.7 | 0.1 |
| Aspergillus sydowii | 36,807.30 | 333.4 | 512.2 |
| Aspergillus unguis | 6,27,960.70 | 77.5 | 10.9 |
| Aspergillus versicolor | 22,12,500.40 | 93,909.80 | 2,566.40 |
| Aureobasidium pullulans | 0.2 | 0.8 | 0.9 |
| Chaetomium globosum | 2,404.30 | 343.2 | 1.7 |
| Cladosporium sphaerospermum | 55,00,216.60 | 1,897.90 | 227.8 |
| Eurotium group | 40,738.80 | 3,124.10 | 506.7 |
| Paecilomyces variotii | 8.4 | 6.2 | 3,393.20 |
| Penicillium brevicompactum | 742.8 | 8,797.00 | 2,256.70 |
| Penicillium corylophilum | 2.9 | 3.8 | 0 |
| Penicillium spinulosum | 0.6 | 1.7 | 1.5 |
| Penicillium crustosum | 17,332.00 | 325.2 | 56.8 |
| Penicillium purpurogenum | 435 | 839.4 | 0.8 |
| Penicillium variabile | 58,141.40 | 3,570.70 | 2.5 |
| Scopulariopsis brevicaulis | 745.2 | 83.6 | 12,152.30 |
| Scopulariopsis chartarum | 56,309.10 | 3,224.70 | 2,799.00 |
| Stachybotrys chlorohalonata | 507.6 | 5.2 | 1.4 |
| Trichoderma viride | 0 | 0 | 0 |
| Wallemia sebi | 20,45,748.20 | 2,13,566.00 | 142.7 |
| Group II | |||
| Acremonium strictum | 434.9 | 0.5 | 0.1 |
| Alternaria alternata | 90.3 | 16.9 | 69.7 |
| Aspergillus ustus | 365.9 | 1.4 | 0.5 |
| Cladosporium cladosporioides type 1 | 719 | 202.2 | 138.9 |
| Cladosporium cladosporioides type 2 | 23,391.80 | 445.7 | 20.1 |
| Cladosporium herbarum | 28.7 | 0.6 | 1.5 |
| Epicoccum nigrum | 0 | 0.1 | 0.6 |
| Mucor amphibiorum | 253.8 | 5.9 | 1.8 |
| Penicillium chrysogenum type 2 | 4,36,480.20 | 36,655.70 | 125.2 |
| Rhizopus stolonifer | 3.7 | 0 | 1.1 |
According to the ERMI assessment method, the quantified amount of each mold species was converted into log value and then the ERMI index value was estimated using the difference of two groups. Using the estimated index value of each house, the contamination level was assessed according to the ERMI assessment standard.
Development of Korean ERMI (KERMI):
There are considerable costs associated with conducting quantitative analysis of mold species through gene analysis. Therefore, index species that could be removed from the ERMI species were selected in order to minimize the effect on the assessment standard and the ERMI graph was produced by applying the existing ERMI calculation method. To accomplish this, species that showed a detection rate of 80 % or less-or a low concentration of 10 cells or less per index species for all house types-were removed from the results, and the final KERMI values were calculated.
Statistical analysis:
The ERMI values of flooded, water-damaged, and non-damaged dwellings were compared, as well as the results of the original ERMI to the KERMI for all three categories (flooded, water leaks/condensation, and nondamaged dwellings). All data were analysed using SAS version 9.3 (SAS Institute, Cary, NC), and a significance level (α) of 5 % was applied unless indicated otherwise.
Results and Discussion
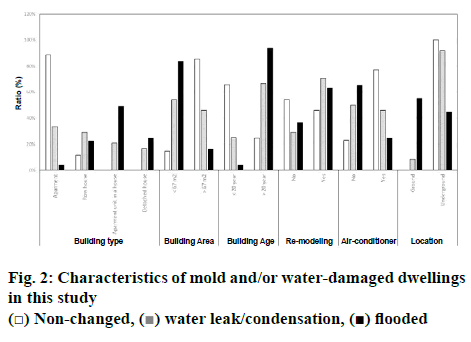
The flooded houses and water-damaged houses with leaks or condensation were mostly residential row houses or detached houses, and the living floor space was smaller than that of non-water-damaged houses (figure 2). Furthermore, the proportion of deteriorated houses more than 20 y old were 86.5 and 60.6 % for the flooded houses and water damaged houses respectively. The number of older houses with water damage was substantially higher than that of non-water-damaged houses at 24.6 %, and the residing period was also longer for non-damaged houses. In addition, the proportion of semi-basement type structures that could be easily damaged by moisture was high for waterdamaged houses, while the presence of air-conditioner units required for moisture control was low. Therefore, water-damaged houses were favourable environments for mold growth compared to non-water-damaged houses.
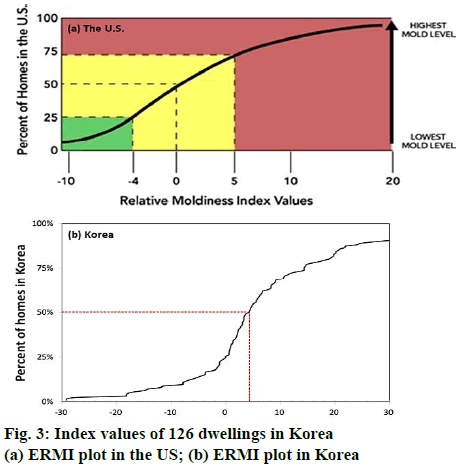
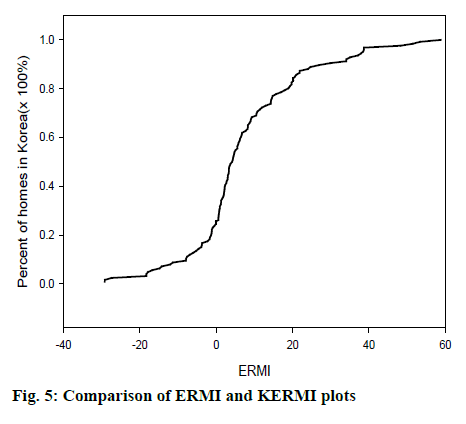
After obtaining the ERMI for each investigation target house by using the 36 index species of the USEPA ERMI, the ERMI graph was produced with the index distribution of all houses, and the ERMI graph and the target house distribution patterns were compared. As shown in (figure 3). The distribution patterns of index values were similar, but the contamination level assessment standard showed a slightly increasing trend. It was determined that because the distribution pattern was different between the index mold species according to climate and resident’s living habits, which vary in different regions of the US and South Korea.
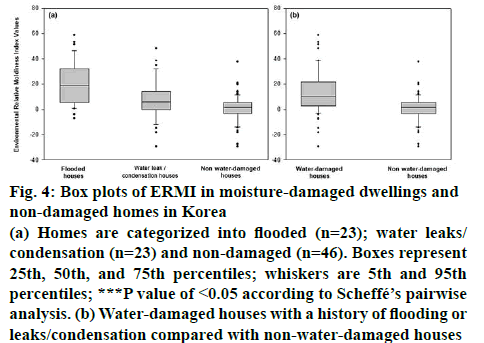
The ERMI result by house type was 19.6 for flooded houses, 7.5 for water leak/condensation houses, and 0.8 for non-water-damaged houses (figure 4). The combined ERMI value of the flooded and leaks/condensation houses was 10.7 (figure 4). The ERMI value of flooded houses was statistically significantly different from to those of the houses with leaks/condensation (p=0.0032) and non-water-damaged houses (p<0.0001), with a larger difference compared with non-water-damaged houses. Similarly, the difference in the ERMI values between water-damaged houses and non-water-damaged houses was statistically significant (p<0.0001).
Figure 4: Box plots of ERMI in moisture-damaged dwellings and non-damaged homes in Korea
(a) Homes are categorized into flooded (n=23); water leaks/condensation (n=23) and non-damaged (n=46). Boxes represent 25th, 50th, and 75th percentiles; whiskers are 5th and 95th percentiles; ***P value of <0.05 according to Scheffé’s pairwise analysis. (b) Water-damaged houses with a history of flooding or leaks/condensation compared with non-water-damaged houses
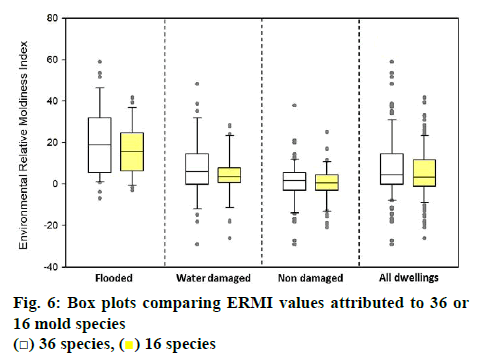
The mold species (Table 2) that showed low concentrations of ≤10 cells in all house types or detection rate of ≤80 % were removed. Finally, 12 species were selected from group I and 4 species from group II, with a final selection of 16 species. In addition, the ERMI species used commercially for analysis at low cost in the US and the FERMI indicator species presented recently in Finland were described together. As such, there is some difference in the index species used for ERMI assessment between different countries, but there are index species commonly used. Some of the more common mold species found in multiple countries include: Aspergillus ochraceus, A. restrictus, Eurotium amstelodami, Penicillium crustosum, Alternaria alternata, Cladosporium cladosporioides type 1 and P. chrysogenum type 2, figure 5 shows the ERMI values of all 36 mold species, and the KERMI. Although the distribution pattern was similar between two indices, the distribution range of ERMI values of the 16 species selected for index values after removal decreased and the assessment standard value also showed a decreasing trend.
Table 2: List of Mold Species Selected For the Korean ERMI (KERMI)
| Group | EPA ERMI | KERMI* | ERMI_Simple** | FERMI*** |
|---|---|---|---|---|
| I | Aspergillus flavus | |||
| Aspergillus fumigatus | ||||
| Aspergillus niger | Ο | Ο | ||
| Aspergillus ochraceus | Ο | Ο | Ο | |
| Aspergillus penicillioides | Ο | Ο | ||
| Aspergillus restrictus | Ο | Ο | ||
| Aspergillus sclerotiorum | ||||
| Aspergillus sydowii | Ο | Ο | ||
| Aspergillus unguis | Ο | |||
| Aspergillus versicolor | Ο | Ο | ||
| Aureobasidium pullulans | ||||
| Chaetomium globosum | Ο | Ο | ||
| Cladosporium sphaerospermum | Ο | Ο | ||
| Eurotium amstelodami | Ο | Ο | ||
| Paecilomyces variotii bainier | Ο | |||
| Penicillium brevicompactum | ||||
| Penicillium corylophilum | Ο | |||
| Penicillium spinulosum | ||||
| Penicillium crustosum | Ο | Ο | ||
| Penicillium purpurogenum | ||||
| Penicillium variabile, sopp. Anamorph | ||||
| Scopulariopsis brevicaulis | ||||
| Scopulariopsis chartarum | Ο | |||
| Stachybotrys chlorohalonata | ||||
| Trichoderma viride | ||||
| Wallemia sebi | Ο | Ο | ||
| II | Acremonium strictum | |||
| Alternaria alternata | Ο | Ο | Ο | |
| Aspergillus ustus Thom | ||||
| Cladosporium cladosporioides type 1 | Ο | Ο | Ο | |
| Cladosporium cladosporioides type 2 | Ο | |||
| Cladosporium herbarum | Ο | |||
| Epicoccum nigrum | Ο | |||
| Mucor & Rhizopus | ||||
| Penicillium chrysogenum type 2 | Ο | Ο | Ο | |
| Rhizopus stolonifer |
Figures 5 and 6 show the results of assessment performed by classifying the investigation target houses by level of water damage. In the correlation analysis results, the flooded houses, water leaks/condensation houses, and non-water-damaged houses all showed R>0.9 for the degree of agreement, indicating that there is no significant difference between the two indices.
It is not always easy to assess indoor contamination levels through mold concentration because of the mold that is suspended in air. Additionally, it is well known that the methods traditionally used for airborne mold assessment are based on the collision and culturing method which has limitations in collecting basic data for evaluating health effects[19,23]. Therefore, the methodology of this study that assesses the waterdamaged houses based on the concentrations of mold in the floor dust is considered as a way to minimize mold damage in houses while protecting public health by inhibiting the propagation of molds. The methods used in this study can supplement the conventional assessment methods and be used as a tool for easily monitoring the occurrence of mold caused by water damage.
For the ERMI developed by the USEPA, the distribution pattern of 1700 homes in the US was investigated, and after classifying four stages based on the indices corresponding to 25, 50, and 75 % values, the mold contamination level was assessed[12,13]. According to exposure level results using the USEPA ERMI, the flooded houses showed the highest index value with 19.6 (−6.9-58.8). Meanwhile, the water-damaged houses had a value of 7.5 (−29.2-48.3), and the nonwater- damaged houses had a value of 0.8 (−29.2-37.9). Although direct comparison of the indices can be difficult due to the variance of house types and dwelling cultures between different countries, the results the USEPA ERMI showed a wider distribution compared to the range of −2.7-28.8 obtained from 40 homes in France and the results were in the range of 14.9–37.7 for Taiwanese homes that have asthma patients as residents[24.25]. Furthermore, the proportion of houses with Level 4 results (ERMI: 5 or higher), which were determined to have a high contamination level in the ERMI assessment standard, was highest among the flooded houses (75.8 %); this was followed by water leaked/condensed houses (51.5 %) and then nonwater- damaged houses (26.7 %). Therefore, the waterdamaged houses showed the highest ERMI value. However, when the US EPA’s assessment standard was applied to houses in South Korea, even the nonwater- damaged houses (0.8) showed more than the middle contamination level (Level 3), indicating that the mold contamination was overestimated and should be adjusted for the KERMI.
The amount of mold contained in the floor dust (cell/mg) of the flooded houses was about 390 times higher compared to that of the non-waterdamaged houses, and that of houses with water leaks/ condensation was about 13 times higher. The species at high concentrations included A. restrictus, A. versicolor, and Wallemia sebi found in the flooded houses and houses with water leaks/condensation. Additionally, the concentrations of Scopulariopsis brevicaulis and Paecilomyces variotii were high in the non-waterdamaged houses. This was similar to the study results in Finland, which showed high concentrations of A. restrictus and P. brevicompactum, and the US, which had high concentrations of A. versicolor, Eurotium group, and Wallemia sebi[13,21,23,25,26].
In addition, 10 cells or fewer were detected for Group Ι’s A. fumigatus, Aureobasidium pullulans, P. corylophilum, P. spinulosum, and Trichoderma viride species, and group ΙΙ’s Epicoccum nigrum and Rhizopus stolonifer species. Therefore, analysis should be performed after removing these species with low concentrations, in order to save time and reduce costs. Furthermore, the ERMI is mainly used for investigating the mold contamination and the asthma risk of houses having asthma patients in the US, and various countries such as France, Finland, and Singapore have modified the ERMI according to the environmental conditions in each country, using the index as a yardstick to assess mold damage[11,21]. Therefore, if an index appropriate for the environmental conditions in South Korea is derived after removing the species with low detection rates or frequency through additional research, it can be used to assess and predict mold contamination.
The mold concentration in the air is difficult to assess properly in water-damaged houses because of the limitations of available assessment methods. As an important result of this study, the reference value using the calculated ERMI could be used to distinguish the mold concentration levels of flooded houses or houses with leaks/condensation from those of non-waterdamaged houses. Therefore this method of assessing the mold exposure of a house by using the ERMI is highly effective when compared with previous methods.
In conclusion, it is expected that the assessment method of using the ERMI can be applied in the proactive prevention stages of mold exposure. In particular, the results of this study can provide important basic data for evaluating the health effects of mold exposure and for developing methods for constant monitoring of mold levels in public facilities. Finally, further studies are required in order to reduce the cost and effort required and increase efficiency for collecting floor dust for analysis, as well as on-site measurements in real time.
Financial interest and scholarship
This research was supported by the National Institute of Environmental Research (NIER-RP2017-177).
Conflict of interest
None to report.
References
- Anderson RH, Cohen A, Oliveira DE, Fernandes, Douwes J, et al. WHO guidelines for indoor air quality: dampness and mould. World Health Organisation (WHO) Copenhagen. Denmark. 2009.
- Antova T, Pattenden S, Brunekreef B, Heinrich J, Rudnai P, Forastiere F, et al. Exposure to indoor mould and children’s respiratory health in the PATY study. J Epidemiol Community Health 2008;62:708-14.
- Cai HG, Malarstig B, Kumlin A, Johansson I, Janson C, Norback D, et al. Fungal DNA and pet allergen levels in Swedish day care centers and associations with building characteristics. J Environ Monit 2011;13:2018-24.
- Fisk WJ, Gomez LQ, Mendell MJ. Meta-analyses of the associations of respiratory health effects with dampness and mold in homes. Indoor Air 2007;17:284-96.
- Hwang BF, Liu IP, Huang TP. Molds, parental atopy and pediatric incident asthma. Indoor Air 2011;21:472-78.
- Jaakkola JJ, Hwang BF, Jaakkola MS. Home dampness and molds as determinants of allergic rhinitis in childhood: a 6-year, population-based cohort study. Am J Epidemiol 2010;172:451-59.
- Jaakkola JJ, Hwang BF, Jaakkola N. Home dampness and molds, parental atopy, and asthma in childhood: a six-year population-based cohort study. Environ Health Perspect 2005;113:357-61.
- Jaakkola MS, Nordman H, Piipari R, Uitti J, Laitinen J, Karjalainen A, et al. Indoor dampness and molds and development of adult-onset asthma: a population-based incident case-control study. Environ Health Perspect 2002;110:543-7.
- Seo S, Choung JT, Chen BT, Lindsley WG, Kim KY. The level of submicron fungal fragments in homes with asthmatic children. Environ Res 2014;131:71-6.
- Seo S, Han Y, Kim J, Choung JT, Kim BJ, Ahn K. Infrared camera-proven water-damaged homes are associated with the severity of atopic dermatitis in children. Ann Allergy Asthma Immunol 2014;113:549-55.
- Vesper S. Traditional mould analysis compared to a DNA-based method of mould analysis. Crit Rev Microbiol 2011;37:15-24.
- Vesper S, McKinstry C, Haugland R, Wymer L, Bradham K, Ashley P. Development of an Environmental Relative Moldiness index for US homes. J Occup Environ Med 2007;49:829-33.
- Vesper S, Barnes C, Ciaccio CE, Johanns A, Kennedy K, Murphy JS. Higher Environmental Relative Moldiness Index (ERMI) Values Measured in Homes of Asthmatic Children in Boston, Kansas City, and San Diego. J Asthma 2012;50:155-61.
- Vesper S, McKinstry C, Ashley P, Haugland R, Yeatts K, Bradham K. Quantitative PCR analysis of molds in the dust from homes of asthmatic children in North Carolina. J Environ Monit 2007;9:826-30.
- Vesper S, McKinstry C, Bradham K, Ashley P, Cox D, Dewalt G. Screening tools to estimate mold burdens in homes. J Occup Environ Med 2009;51:80-6.
- Vesper S, McKinstry C, Cox D, Dewalt G. Correlation between ERMI values and other moisture and mold assessments of homes in the American Healthy Homes Survey. J Urban Health 2009;86:850-60.
- Vesper S, McKinstry C, Hartmann C, Neace M, Yoder S, Vesper A. Quantifying fungal viability in air and water samples using quantitative PCR after treatment with propidium monoazide (PMA). J Microbiol Methods 2008;72:180-4.
- Vesper S, McKinstry C, Haugland R, Neas L, Hudgens E, Heidenfelder B. Higher Environmental Relative Moldiness Index (ERMIsm) values measured in Detroit homes of severely asthmatic children. Sci Total Environ 2008;349:192-6.
- Vesper S, Wakefield J, Ashley P, Cox D, Dewalt G, Friedman W. Geographic distribution of Environmental Relative Moldiness Index molds in USA homes. J Environ Public Health 2011;2011:242457.
- Vesper SJ, McKinstry C, Yang C, Haugland RA, Kercsmar CM, Yike I. Specific molds associated with asthma in water-damaged homes J Occup Environ Med 2006;48:852-8.
- Méheust D, Le Cann P, Reponen T, Wakefield J, Vesper S, Gangneux JP. Possible application of the Environmental Relative Moldiness Index in France: A pilot study in Brittany. Int J Hyg Environ Health 2013;216:333-40.
- Täubel M, Karvonen AM, Reponen T, Hyvärinen A, Vesper S, Pekkanen J. Application of the environmental relative moldiness index in Finland. Appl Environ Microbiol 2015;82:578-84.
- Reponen T, Vesper S, Levin L, Johansson E, Ryan P, Burkle J, et al. High environmental relative moldiness index during infancy as a predictor of asthma at 7 years of age. Ann Allergy Asthma Immunol 2011;107:120-6.
- Méheust D, Gangneux JP, Reponen T, Wymer L, Vesper S, Le Cann P. Correlation between Environmental Relative Moldiness Index (ERMI) values in French dwellings and other measures of fungal contamination. Sci Total Environ 2012;438:319-24.
- Chen HC, Chao JH, Shen WC, Chen BY, Lin KT, Guo LY, et al. Pilot study of mold in homes of asthmatic children in Taipei, Taiwan, using the Environmental Relative Moldiness Index. Aerobiologia 2015;31:213-18.
- Goh V, Yap HM, Gutiérrez RA, Ng LC, Vesper SS. DNA-based analyses of molds in Singapore public buildings results in a proposed Singapore environmental relative moldiness index. Trop Biomed 2014;31:663-9.
 Non-changed,
  water leak/condensation,
  flooded
 36 species,
  16 species


