- *Corresponding Author:
- Bhavani Boddeda
School of Pharmaceutical Sciences and Technologies, Jawaharlal, Jawaharlal Nehru Technological University Kakinada (JNTUK), Kakinada 533003, Andhra Pradesh
E-mail: bhavani2008@gmail.com
| Date of Received | 15 June 2023 |
| Date of Revision | 09 February 2024 |
| Date of Acceptance | 20 August 2024 |
| Indian J Pharm Sci 2024;86(4):1488-1498 |
This is an open access article distributed under the terms of the Creative Commons Attribution-NonCommercial-ShareAlike 3.0 License, which allows others to remix, tweak, and build upon the work non-commercially, as long as the author is credited and the new creations are licensed under the identical terms
Abstract
Varenicline tartrate is a smoking cessation aid that works by blocking nicotine receptors in the brain. It helps reduce cravings and withdrawal symptoms and helps you quit smoking. The study aimed to formulate and characterize varenicline tartrate orodispersible tablets using the synthetic disintegrants crospovidone and croscarmellose sodium in different ratios and directly compressible microcrystalline cellulose as diluent, and mannitol to improve mouthfeel using the direct compression method. A total of 13 varenicline orodispersible tablets are formulated and subsequently evaluated for pre-compression and post-compression physicochemical parameters such as angle of repose, Carr index, Hausner ratio, hardness, thickness, mass variation, drug content, friability, wetting time, disintegration time, dispersion time and water absorption ratio. Optimization was performed with percentage of crospovidone (X1 or A) and croscarmellose sodium (X2 or B) as independent variables, while disintegration time (Y1) and wetting time (Y2) were selected as dependent variables using the central composite design of Design-Expert® DX 12. Optimized formulations showed 99.68 % drug release in 60 min while the cumulative percentage drug release of pure drug was only 56.84 %. Finally, it was concluded that dissolution rate and bioavailability are improved with varenicline tartrate orodispersible tablets.
Keywords
Varenicline tartrate, orodispersible tablets, super disintegrants, croscarmellose sodium, crospovidone
For every death caused by cigarette smoking, 30 people are left living with serious tobacco-related illnesses. Globally, the burden of disease will increase, with approximately 6 million deaths per year rising to a forecast of 8 million by 2030[1]. Nicotine provides rapid relief from cravings and withdrawal symptoms, contributing to high rates of failure and the need for repeated quit attempts. Therefore, there is a great need for more effective smoking cessation aids than nicotine replacement therapy and extended-release bupropion, which are moderately effective, with an odds ratio of ≤2 compared to placebo[2]. Varenicline tartrate acts on the Alpha-4 Beta-2 (α4β2) nicotinic receptor, which is the same receptor targeted by nicotine inhaled from smoke[3]. Unlike nicotine replacement therapy, varenicline has a dual effect by simultaneously reducing cravings and blunting the reward and pleasure associated with smoking through partial nicotinic acetylcholine receptor agonist activity[4]. It has a longer half-life compared to nicotine replacement therapy, which may be important in the hospital setting.
Biopharmaceutics Classification System (BCS) class I indicate that varenicline tartrate is likely to have good bioavailability and predictable pharmacokinetics when administered orally[5]. This classification also implies that varenicline tartrate is suitable for formulation into a variety of oral dosage forms, including tablets, capsules, and solutions, which contributes to its effectiveness as a smoking cessation aid. To facilitate rapid dissolution and absorption, it is necessary to develop fast-dissolving tablets of varenicline tartrate. This can lead to a faster onset of action and provide relief from cravings and withdrawal symptoms soon after administration[6]. Such tablets have the potential to improve the efficacy of varenicline by ensuring rapid absorption and distribution of the drug in the body. In addition, the ease and convenience of using fast-dissolving tablets may improve patient compliance with the prescribed treatment regimen. When patients find medication easy, they are more likely to adhere to the prescribed dosing schedule, increasing the likelihood of successful smoking cessation outcomes[7]. The rapid dissolution of the tablet is due to the rapid penetration of water into the matrix of the tablet, which results in its rapid disintegration. Thus, approaches to Orodispersible Tablets (ODT) development include maximizing the porous structure of the tablet matrix, incorporating a suitable disintegrating agent, and using highly water-soluble excipients in the formulation[8]. Hence, the present study aimed to formulate ODTs of varenicline tartrate using the direct compression method using various super disintegrants.
Materials and Methods
The following ingredients were used in the production of the tablets; varenicline tartrate, Crospovidone (CP), Microcrystalline Cellulose (MCC), aspartame (all procured from Sigma Aldrich), magnesium stearate, talc, potassium dihydrogen phosphate, and sodium hydroxide (all procured from S.D Fine Chem, Ltd., Mumbai). The equipment used in the production process included a tablet punching machine (16 punch), Ultraviolet/visible spectrophotometer double beam (Elico), dissolution test apparatus-United States Pharmacopeia (USP) standards (Electro lab TDT 08L), single pan digital balance (Citizen), hardness tester (Monsanto, Electronics India), friability apparatus and disintegration test apparatus (Electronics India/2901).
Experimental design:
A face-centered Central Composite Design (CCD) was utilized to develop varenicline-loaded ODTs through the optimization of formulation parameters. The design involved the evaluation of three factors at three different levels (+1, 0, -1), and 13 combinations of experimental trials were conducted. The percentage (%) of CP (X1 or A) and Croscarmellose Sodium (CCS) (X2 or B) were selected as the independent variables, while disintegration time (Y1) and wetting time (Y2) were chosen as the dependent variables for optimizing the response data.
The polynomial equation given below was used to study the effect of variables on different evaluation responses (Y), where the coefficients in the equation (β0, β1, β2, β12, β23, β31, β11, β22, and β33) were related to the effects and interactions of the factors.
Y=β0+β1X1+β2X2+β12X1X2+β11X1X1+β22X2X2
Where the pendent variable is a statistical term used to describe the variable being studied. In this case, β0 represents the arithmetic mean response of the 13 runs. Meanwhile, β1 and β2 are the estimated coefficients for the factors X1 and X2, respectively. The main effect refers to the average result of changing one factor at a time from its low to high value. This is represented by X1 and X2. On the other hand, the interaction term (X1X2) shows how the response changes when two factors are changed simultaneously. To investigate nonlinearity, the polynomial terms (X1X1 and X2X2) are included.
Preparation of varenicline tartrate ODTs:
Fast-dissolving tablets of varenicline tartrate were prepared by direct compression method, using synthetic disintegrants CP and CCS in different ratios and directly compressible MCC as diluent and mannitol to enhance the mouth feel. Tablets of varenicline tartrate were prepared using the direct compression method. The tablets were made with synthetic disintegrants CP and CCS in different proportions. Directly compressible MCC was used as a diluent, and mannitol was added to improve the mouth feel. All the ingredients were passed through a #60 mesh separately, and then mixed to obtain a uniform mixture and set aside. The ingredients were weighed and mixed in a specific order. Finally, the mixed blend of excipients was compressed into a tablet. The formulae used in the preparation were given in Table 1. According to the formulae given in Table 2, all the ingredients were passed through #60 mesh separately. The drug and MCC were mixed by a small portion of both each time and blended to get a uniform mixture and kept aside. Then the ingredients were weighed and mixed in geometrical order. The mixed blend of excipients was compressed into a tablet.
| Name | Coded (%) | Actual (%) |
|---|---|---|
| CP | -1 | 5 |
| 0 | 7.5 | |
| +1 | 10 | |
| CCS | -1 | 5 |
| 0 | 7.5 | |
| +1 | 10 |
Table 1: Coded and actual values of independent variables.
| Formulation code | A-CP (%) | B-CCS (%) | CP | CCS | MCC | Starch | Aspartame | Talc | Magnesium stearate |
|---|---|---|---|---|---|---|---|---|---|
| F1 | 10 | 5 | 10 | 5 | 61 | 5 | 2 | 1 | 1 |
| F2 | 7.5 | 5 | 7.5 | 5 | 66 | 5 | 2 | 1 | 1 |
| F3 | 7.5 | 7.5 | 7.5 | 7.5 | 61 | 5 | 2 | 1 | 1 |
| F4 | 7.5 | 7.5 | 7.5 | 7.5 | 61 | 5 | 2 | 1 | 1 |
| F5 | 7.5 | 10 | 7.5 | 10 | 56 | 5 | 2 | 1 | 1 |
| F6 | 7.5 | 7.5 | 7.5 | 7.5 | 61 | 5 | 2 | 1 | 1 |
| F7 | 5 | 5 | 5 | 5 | 71 | 5 | 2 | 1 | 1 |
| F8 | 10 | 10 | 10 | 10 | 51 | 5 | 2 | 1 | 1 |
| F9 | 10 | 7.5 | 10 | 7.5 | 56 | 5 | 2 | 1 | 1 |
| F10 | 7.5 | 7.5 | 7.5 | 7.5 | 61 | 5 | 2 | 1 | 1 |
| F11 | 5 | 10 | 5 | 10 | 61 | 5 | 2 | 1 | 1 |
| F12 | 7.5 | 7.5 | 7.5 | 7.5 | 61 | 5 | 2 | 1 | 1 |
| F13 | 5 | 7.5 | 5 | 7.5 | 66 | 5 | 2 | 1 | 1 |
Table 2: Formulae of different formulations.
Methods:
Pre-compression parameters such as angle of repose, bulk density, tapped density, Carr's index, and Hausner's ratio were estimated; post compression parameters such as hardness[9], friability[10], drug content, wetting time[11], water absorption ratio[12], disintegration time[13] and in vitro dissolution studies were conducted.
Statistical analysis:
The data obtained from the factorial design study was subjected to multiple regression analysis using Design-Expert® 12 software and were fitted in the equation:
Y=β0+β1X1+β2X2+β12X1X2+β11X1X1+β22X2X2
The effect of the variables was interpreted by considering the magnitude of the correlation and the mathematical sign it carried (positive or negative). The adequacy of the fitted model was checked by Analysis of Variance (ANOVA). To study the main and interaction effects of the independent variables, response surface plots were constructed using the software Design-Expert® DX 12. Response surface plots were constructed using software to study the main and interaction effects of the independent variables. From the above statistical analysis, two formulations were optimized with specified constraints and the formula for the optimized formulation is presented in Table 3.
| S. No. | Dependent variable | Constraints (minimize) |
|---|---|---|
| 1 | Y1 | 30-50 |
| 2 | Y2 | 20-30 |
| Code | % CP | % CCS |
| Optimized formulations | 5 | 10 |
Table 3: Constraints of dependent variables in optimization and formulae of optimized formulations.
The optimized formulation which was one of the initial 13 formulations was prepared based on the given formulae, and the evaluation tests were repeated and the % relative error of the predicted and the experimental values were calculated. The formula for calculating the relative error:
% Relative error=(Predicted value-experimental value)/(predicted value)×100
Kinetic model fitting:
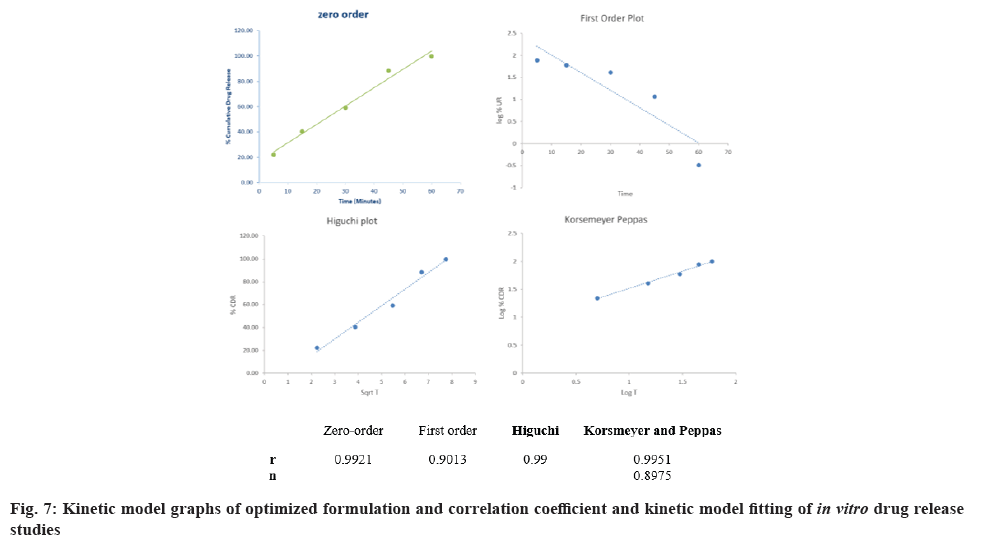
Several theories/kinetics models describe drug dissolution from immediate and modified release dosage forms. To compare dissolution profiles between two drug products model-dependent (curve fitting), statistical analysis, and model-independent methods can be used. The kind of drug, its polymorphic form, crystallinity, particle size, solubility, and amount in the pharmaceutical dosage form can influence the release kinetics using zero-order kinetics and first order kinetics (Higuchi model and Korsmeyer-Peppas model)[14].
Regression equation of the fitted model:
The final regression equation in terms of coded factors and the actual terms were as follows
Disintegration time (coded values): Disintegration time=65.369+2.37×A+(-12.9317)×B+2.6225×AB+(-14.7414)×A2+(-0.636379)×B2
Disintegration time (actual values): Disintegration time=(-17.7434)+33.1803×CP+(-6.79236)×CCS+0.4196×CP×CCS+(-2.35862)×(CP)2+(-0.101821)×(CCS)2
Wetting time (coded values): Wetting time=29.4869+(-0.728333)×A+(-7.39333)×B+5.1775×AB
Wetting time (actual values): Wetting time=100.449+(-6.50433)×CP+(-9.17033)×CCS+0.8284×CP×CCS
Results and Discussion
The oral route is the most important route of drug administration compared to other routes and is considered to be self-medication, ease of administration, and avoidance of pain compared to the parenteral route[15]. The researcher's activity was focused on the development of ODT, which quickly disintegrate in the oral cavity within 1 min. According to European Pharmacopeia 7.0, ODTs should disintegrate in <3 min, which is easy for patients who are mentally ill, disabled, uncooperative, pediatric, and geriatric population. Some of the techniques such as lyophilization, sublimation, cotton candy, melt granulation, molding, phase transition, hot melt extrusion, solvent casting, spray drying, and effervescent technology are some of the widely accepted techniques for the preparation of ODT[16]. Orally dispersible tablets are dosage forms that can be prepared by various techniques. Direct compression using super disintegrants is a technique used in preparation where the percentage of cross-linked povidone and CCS, the super disintegrants used, are critical in determining the quality and efficacy of the product. Super disintegrants are substances commonly contained in tablet formulations that aid in the breakdown of the compacted mass into primary particles to facilitate the dissolution or release of the active ingredients when placed in a liquid medium. Super disintegrants are generally used in low amounts in a solid dosage form, typically 1 % to 10 % by weight relative to the total weight of the dosage unit[17]. Their particles are generally small and porous, allowing the tablet to disintegrate rapidly in the mouth without the undesirable mouth feel of large particles or gelation. CCS is an internally cross-linked polymer of sodium carboxymethylcellulose. It has a high swelling capacity with minimal gelation, resulting in rapid disintegration[18].
All the selected excipients were mixed according to the ratio and analyzed for pre-compression analysis. Thus, the current work was started to optimize these parameters using the model drug varenicline tartrate. It is a highly soluble and highly permeable drug and is an ideal candidate for formulating as a dispersible tablet. The design of the formulation started with the CCD to optimize the independent variables like concentration of the super disintegrants, and the key ingredients in the formulation of varenicline tartrate. Formulation batches of varenicline tartrate ODTs were prepared by CCD.
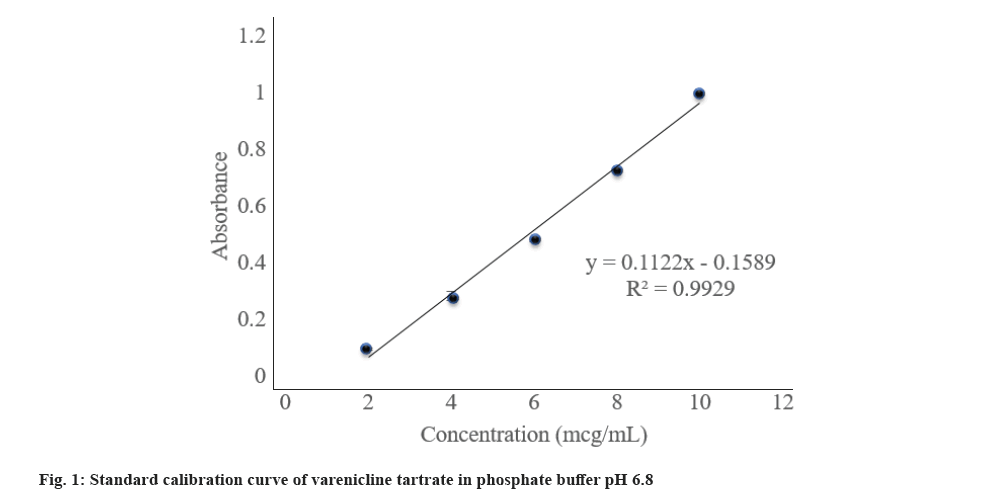
The calibration curve was represented in fig. 1. From the slope and intercept values it is observed that the curve has a positive slope. The coefficient of correlation value of 0.9964 is good. From the data, it is evident that the concentration range from 2 µg/ml to 10 µg/ml is within the linearity range as per Beer’s Lambert's law.
Thirteen formulations were prepared according to the different ratios of CP, cross carmellose sodium, MCC, aspartame, talc, and magnesium stearate. Pre-compression and post-compression analysis was done on all the prepared formulations.
The pre-compression parameters and the post-compression parameters were evaluated and listed in Table 4. The angle of repose was found to be in the range of (14.85±0.35) to (23.36±0.58). The prepared mixture formulations showed good flow properties with an angle of pour value from 20 to 30. It was known that a pour angle of <30° indicated excellent flow properties and values ??>56° indicated very poor flow properties[19].
| Formulation code | Angle of repose | Carr’s index | Hausner’s ratio | Drug content | Wetting time | Water absorption ratio | Disintegration time |
|---|---|---|---|---|---|---|---|
| F1 | 23.32±0.25 | 8.32±0.49 | 1.06±0.02 | 98.22±0.66 | 28.05±2.67 | 96.45±3.71 | 65.04±2.87 |
| F2 | 20.01±0.77 | 9.36±0.16 | 1.03±0.07 | 96.54±0.49 | 35.14±1.93 | 97.87±0.49 | 73.15±2.65 |
| F3 | 19.86±0.84 | 11.34±0.26 | 1.05±0.03 | 97.56±0.44 | 30.15±2.22 | 99.04±2.61 | 69.35±1.43 |
| F4 | 23.36±0.58 | 9.95±0.47 | 1.07±0.04 | 97.99±0.64 | 28.06±1.09 | 98.74±1.86 | 68.12±1.41 |
| F5 | 20.55±0.71 | 7.42±0.38 | 1.1±0.04 | 97.54±0.35 | 18.15±2.79 | 112.35±1.31 | 53.41±1.39 |
| F6 | 23.22±0.40 | 10.35±0.29 | 1.05±0.04 | 99.54±0.37 | 35.36±2.56 | 98.32±1.99 | 62.29±0.92 |
| F7 | 19.54±0.29 | 11.11±0.57 | 1.04±0.03 | 97.32±0.79 | 42.49±2.18 | 99.85±3.63 | 65.32±1.21 |
| F8 | 20.05±0.98 | 9.42±0.39 | 1.03±0.03 | 96.54±0.2 | 24.72±1.24 | 106.25±4.12 | 41.36±2.42 |
| F9 | 14.85±0.35 | 6.54±0.55 | 1.04±0.05 | 98.11±0.79 | 29.12±1.01 | 100.14±4.25 | 51.32±1.29 |
| F10 | 23.06±0.53 | 9.35±0.63 | 1.06±0.02 | 99.22±0.88 | 31.35±2.22 | 101.86±3.72 | 65.85±1.03 |
| F11 | 15.05±0.55 | 10.22±0.19 | 1.07±0.05 | 97.73±0.44 | 18.45±0.98 | 118.46±2.72 | 31.15±1.17 |
| F12 | 20.01±0.45 | 12.55±0.40 | 1.05±0.03 | 99.02±0.74 | 36.97±2.81 | 99.85±0.86 | 64.14±1.13 |
| F13 | 20.22±0.99 | 14.32±0.53 | 1.02±0.09 | 99.21±0.92 | 25.32±1.09 | 104.87±1.16 | 47.03±2.16 |
Table 4: Pre-compression and post-compression evaluation parameters of formulations.
The Carr index was found to be in the range of (6.54±0.55) to (14.32±0.53), indicating that the flow is excellent to good. The Hausner ratio was found to be in the range of (1.02±0.09) to (1.1±0.04), indicating that the flow rate is excellent. Lower Carr indices indicated better powder flow ability and a high Hausner ratio reflected less free-flowing ability. The values ??obtained for the Carr index were in the range (5 %-15 %) and for the Hausner ratio <1.25, which indicates good compressibility of the granules[20].
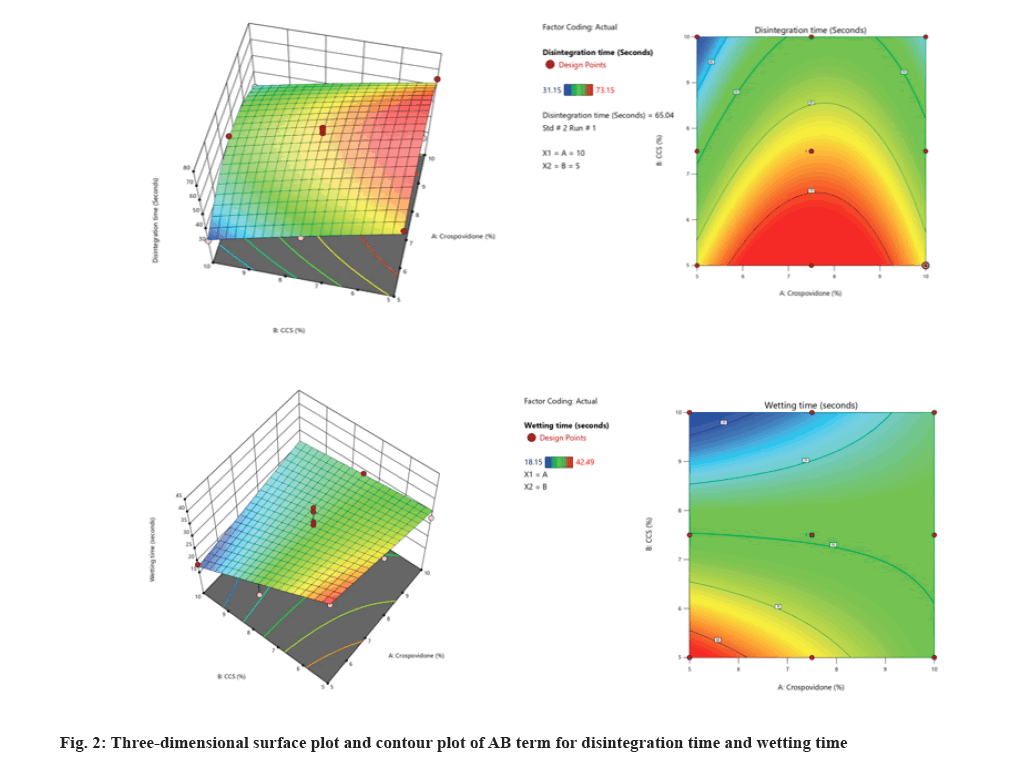
The hardness and friability were found to be within the limits as per official compendia. The drug content was found to be in the range of (96.54±0.2) to (99.54±0.37), which indicates that the values are within the Indian Pharmacopeia (IP) limits of 95 %-105 %.The wetting time was found to be in the range of (18.15±2.79) to (42.49±2.18) s, while the water absorption ratio was found to be in the range of (96.45±3.71) to (118.46±2.72). Wetting time is used as an indicator of easy disintegration of the tablet in the buccal cavity. The reduction in wetting time and dispersion in all formulations can be attributed to the presence of a super-disintegrating agent that absorbs water and swells, causing the tablets to burst[21]. It has been shown that as the concentration of disintegrants increases, the time required for wetting decreases. The wetting time of ODT was found to be directly related to the water absorption ratio. The water absorption ratio was performed to determine the moisture absorption and water absorption properties of the polymers. The water absorption ratio increased and the disintegration time and wetting time decreased with increasing polymer concentration[22]. The disintegration time was found to be in the range of (31.15±1.17) to (69.35±1.43) s (fig. 2).
Statistical analysis was performed after inputting the results obtained in the characterization process into the Design of Experiments (DoE) software the designed models and the fitted model. DoE provides a better understanding of the relationship between independent and dependent variables in formulation development. Preliminary data obtained from previous experiments play an important role in DoE because they provide important information about process variability that can affect product quality[23]. Response Surface Design (RSD) is most commonly used in the pharmaceutical industry. RSDs are a set of statistical and mathematical techniques based on the collection of experimental data from an experimental design (Table 5).
| Model | R2 | Adjusted R2 | Predicted R2 | SD | % CV | Remarks |
|---|---|---|---|---|---|---|
| Disintegration time | ||||||
| Linear model | 0.5562 | 0.4675 | 0.1649 | 9.1 | ||
| Second order | 0.571 | 0.428 | -0.5305 | 9.43 | ||
| Quadratic model | 0.9606 | 0.9325 | 0.7751 | 3.24 | 5.56 | Suggested |
| Wetting time | ||||||
| Linear model | 0.5162 | 0.4374 | 0.00979 | 509 | ||
| Second order | 0.7429 | 0.6572 | 0.4967 | 4.11 | 13.92 | Suggested |
Table 5: Summary of results of regression analysis for responses.
In this CCD, two numeric factors were evaluated at 3 levels (+1, 0, -1), and % of CP and % CCS (X2 or B) were selected as independent variables. The dependent variables were subjected to statistical optimization and fitted to linear, interactive, and quadratic models. The summary of statistics was presented in Table 6. The comparative R2, adjusted R2, predicted R2, Standard Deviation (SD), F values, and p values were determined using the Design-Expert® software. A suitable polynomial model for describing the data was selected based on the coefficient of determination R2. The responses followed the quadratic model. These models show higher R2 and F values and lower p values. The F value of the model for response and disintegration time was observed to be 34.13 for the varenicline tartrate ODTs, which indicates that the model is significant. The values of p<0.05 for all the responses except A, AB, and B2 indicated the significance of parameters except A, AB, and B2 on disintegration time.
| Source | SS | Df | F | p | Remark |
|---|---|---|---|---|---|
| Disintegration Time | |||||
| Model | 1791.05 | 5 | 34.13 | <0.0001 | Significant |
| A | 33.7 | 1 | 3.21 | 0.1162 | Not significant |
| B | 1003.37 | 1 | 95.61 | <0.0001 | Significant |
| AB | 27.51 | 1 | 2.62 | 0.1495 | Not significant |
| A2 | 600.18 | 1 | 57.19 | 0.0001 | Significant |
| B2 | 1.12 | 1 | 0.1066 | 0.7536 | Not significant |
| Lack of Fit | 40.51 | 3 | 1.64 | 0.315 | Not significant |
| Wetting time | |||||
| Model | 438.38 | 3 | 8.67 | 0.0051 | Significant |
| A | 3.18 | 1 | 0.1888 | 0.6741 | Not significant |
| B | 327.97 | 1 | 19.45 | 0.0017 | Significant |
| AB | 107.23 | 1 | 6.36 | 0.0327 | Significant |
| Lack of fit | 97.08 | 5 | 1.42 | 0.3777 | Not significant |
Table 6: Anova for the response and disintegration time.
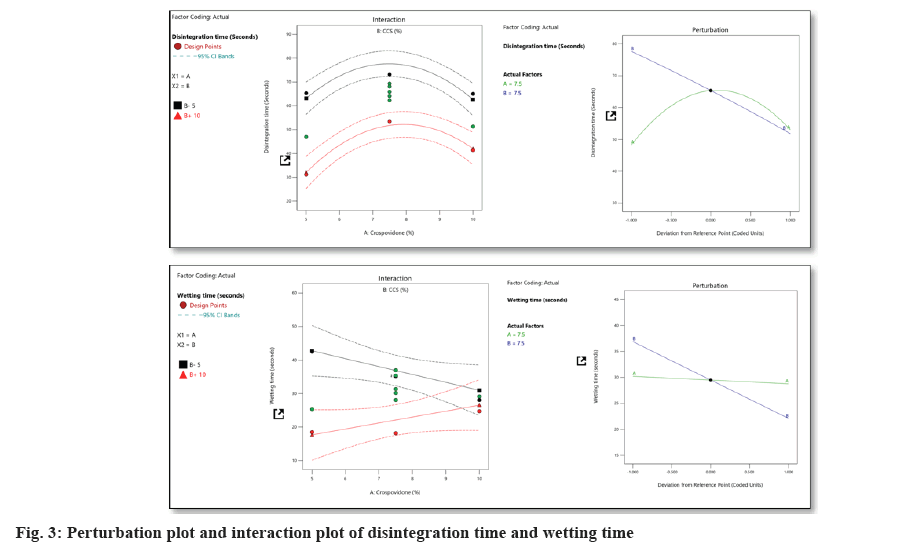
The F value of the model for response, wetting time, was observed to be 8.67 for the varenicline tartrate ODTs, which indicates that the model is significant. The values of p<0.05 for all the responses except A indicated the significance of the model and the insignificance of variable A in defining wetting time. All the terms except A and AB harm disintegration time, while the term AB hurt wetting time (fig. 3).
With the increase in the % CP, the disintegration time increased initially and further increase decreased disintegration time. The % CCS caused a decrease in disintegration time with an increase in its percent. With the increase in the % CCS, the wetting time decreased initially and further increase wetting time. The % CP caused a decrease in wetting time with an increase in its percent (Table 7).
| Parameter | Optimized formulation |
|---|---|
| Disintegration time | 31.85±0.43 |
| Wetting time | 17.96±0.52 |
Note: All the values are presented as mean±SD (n=3)
Table 7: The values of responses of the optimized formulation.
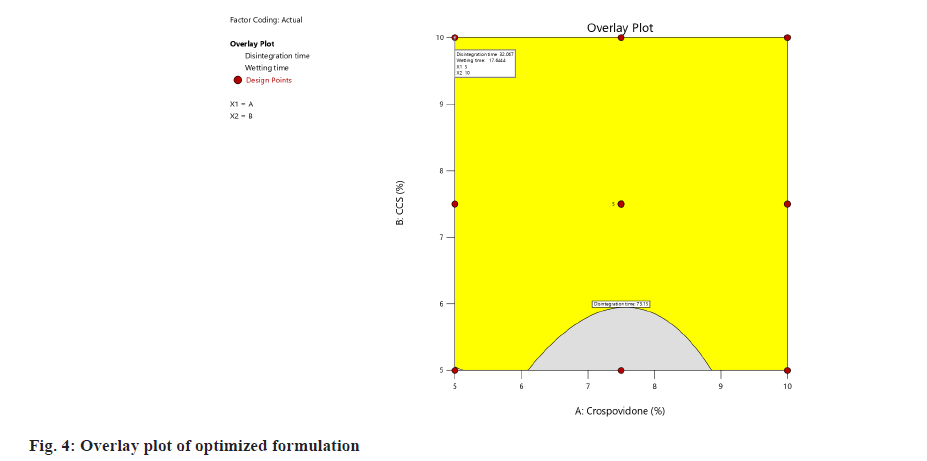
In this experimental design, optimization is done both numerically and graphically. In numerical optimization, the desired character for the response was selected, and automatically software will choose the solutions with desired characters and limits. Among different solutions, it also suggests the solution with desirability near to 1. Graphical optimization was done by desirability plot and overlay plot, which contains optimal values of independent variables. The higher the desirability, the more suitable the formulation. The overlay plot with the optimized formula was given in fig. 4.
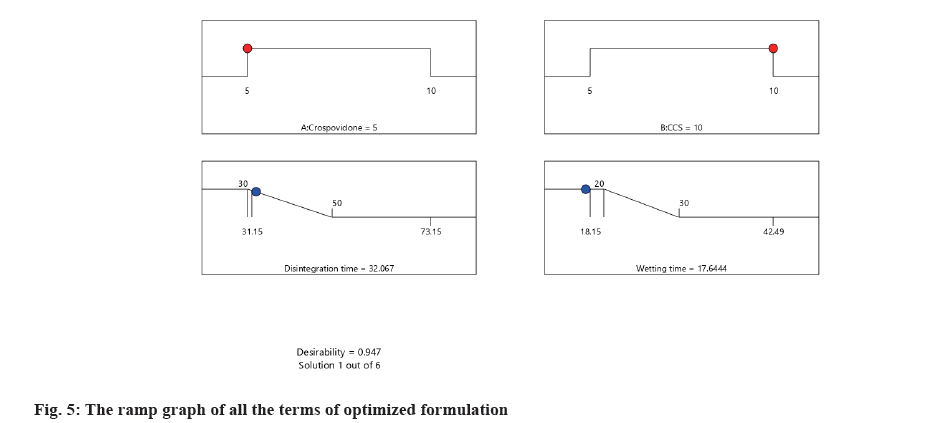
Model validation and final formulation identification was done as follows,the relative error was calculated to validate the model. The relative error was calculated and the values were presented in Table 8. The desirability ramp graph of all the terms of the optimized formulation was given in fig. 5.
| Code | Response | Predicted values | Experimental values | Relative error (%) |
|---|---|---|---|---|
| Optimized formulation | Disintegration time | 32.07 | 31.85 | 0.69 |
| Wetting time | 17.64 | 17.96 | -1.81 |
Table 8: Relative error for optimized formulations.
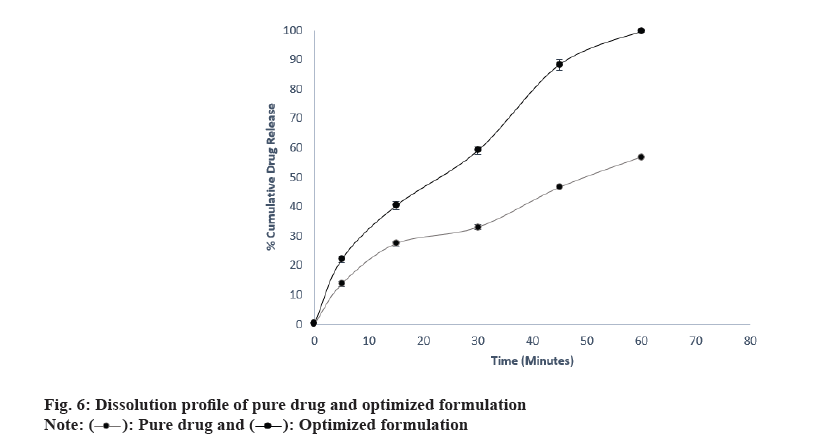
In in vitro drug release study of optimized formulation,the results of the study were presented in Table 9 and fig. 6. The results conclude that the optimized formulation released 99.68 % drug in 60 min while the cumulative % drug release of pure drug was just 56.84 %. It can be concluded that the dissolution is improved by varenicline tartrate ODTs.
| Time (min) |
% Cumulative drug release | |
|---|---|---|
| Pure drug | Optimized formulation | |
| 0 | 0 | 0 |
| 5 | 13.65±0.91 | 22.04±1.14 |
| 15 | 27.44±0.77 | 40.40±1.36 |
| 30 | 32.96±0.90 | 59.08±1.20 |
| 45 | 46.52±1.43 | 88.34±1.79 |
| 60 | 56.84±1.36 | 99.68±0.31 |
Note: All the values are presented as mean±SD (n=3).
Table 9: In Vitro drug release profiles of pure drug and optimized formulation.
Theresults were tabulated in fig. 7. It can be concluded from the results that, the release followed zero order kinetics, and from the slope of the Korsemeyer-Peppas model, it can be concluded that the release is by super case II transport.
Varenicline tartrate ODT is made by the direct compression method. This method involves forming a solid dispersion that contains a super-disintegrant. The super-disintegrant increases the dissolution rate of the tablets when they are in the oral cavity. This results in an enhanced drug release profile that begins with an initial burst release from the matrix. The polymer in the matrix swells in the presence of liquid, causing the ODT to disintegrate within seconds with the help of super disintegrants. The optimized formulation created by DoE (CCD) revealed that the best formulation was the one with rapid drug release and increased bioavailability.
Conflict of interests:
The authors declared no conflict of interests.
References
- Rai B, Bramhankar M. Tobacco use among Indian states: Key findings from the latest demographic health survey 2019-2020. Tob Prev Cessat 2021;7:19.
[Crossref] [Google Scholar] [PubMed]
- Shoaib M, Buhidma Y. Why are antidepressant drugs effective smoking cessation aids? Curr Neuropharmacol 2018;16(4):426-37.
- McCaul ME, Wand GS, Kuwabara H, Dannals RF, Wong D, Xu X. The relationship of varenicline agonism of α4β2 nicotinic acetylcholine receptors and nicotine-induced dopamine release in nicotine-dependent humans. Nicotine Tob Res 2020;22(6):892-9.
[Crossref] [Google Scholar] [PubMed]
- Brandon TH, Drobes DJ, Unrod M, Heckman BW, Oliver JA, Roetzheim RC, et al. Varenicline effects on craving, cue reactivity, and smoking reward. Psychopharmacology 2011;218:391-403.
[Crossref] [Google Scholar] [PubMed]
- Faessel HM, Obach RS, Rollema H, Ravva P, Williams KE, Burstein AH. A review of the clinical pharmacokinetics and pharmacodynamics of varenicline for smoking cessation. Clin pharmacokinet 2010;49:799-816.
[Crossref] [Google Scholar] [PubMed]
- Ghourichay MP, Kiaie SH, Nokhodchi A, Javadzadeh Y. Formulation and quality control of Orally Disintegrating Tablets (ODTs): Recent advances and perspectives. Biomed Res Int 2021;2021(1):6618934.
[Crossref] [Google Scholar] [PubMed]
- Jordan CJ, Xi ZX. Discovery and development of varenicline for smoking cessation. Expert Opin Drug Discov 2018;13(7):671-83.
- Abed KK, Hussein AA, Ghareeb MM, Abdulrasool AA. Formulation and optimization of orodispersible tablets of diazepam. AAPS Pharm SciTech 2010;11:356-61.
[Crossref] [Google Scholar] [PubMed]
- Goyani M, Shah P, Vyas B, Shah D. Formulation and evaluation of orodispersible tablets of meclizine hydrochloride. Int Res J Pharm 2012;3:196-9.
- Pandurangan DK, Vuyyuru T, Kollipara D. Fast dissolving tablets-An overview. Int J Res Pharm Sci 2012;3(2):348-55.
- Veeraveni R, Kamaeswara Rao CH, Shreedhar Nampalli GK, Krishna HP. Design and evaluation of orodispersible taste masked valdecoxib tablets. J Chem Pharm Res 2011;3(4):882-92.
- Ibrahim HK, El-Setouhy DA. Valsartan orodispersible tablets: Formulation, in vitro/in vivo characterization. AAPS PharmSciTech 2010;11:189-96.
[Crossref] [Google Scholar] [PubMed]
- Tambe A, Mokashi P, Pandita N. Ex-vivo intestinal absorption study of boswellic acid, cyclodextrin complexes and poloxamer solid dispersions using everted gut sac technique. J Pharm Biomed Anal 2019;167:66-73.
[Crossref] [Google Scholar] [PubMed]
- Shah KU, Khan GM. Regulating drug release behavior and kinetics from matrix tablets based on fine particle?sized ethyl cellulose ether derivatives: An in vitro and in vivo evaluation. Sci World J 2012;2012(1):842348.
[Crossref] [Google Scholar] [PubMed]
- Alqahtani MS, Kazi M, Alsenaidy MA, Ahmad MZ. Advances in oral drug delivery. Front Pharmacol 2021;12:618411.
[Crossref] [Google Scholar] [PubMed]
- Kallakunta VR, Sarabu S, Bandari S, Tiwari R, Patil H, Repka MA. An update on the contribution of hot-melt extrusion technology to novel drug delivery in the twenty-first century: Part I. Expert Opin Drug Deliv 2019;16(5):539-50.
[Crossref] [Google Scholar] [PubMed]
- Bele MH, Derle DV. Analysis of patents pertaining to superdisintegrants used in tablet manufacturing. J Intellect Prop Rights 2008;13:601-4.
- Rojas J, Guisao S, Ruge V. Functional assessment of four types of disintegrants and their effect on the spironolactone release properties. AAPS PharmSciTech 2012;13:1054-62.
[Crossref] [Google Scholar] [PubMed]
- Shah RB, Tawakkul MA, Khan MA. Comparative evaluation of flow for pharmaceutical powders and granules. AAPS PharmSciTech 2008;9:250-8.
[Crossref] [Google Scholar] [PubMed]
- Cv A, Ha P. Development and evaluation of sucrose free herbal orally disintegrating tablets of ginger. J Bioanalysis Biomed 2017;9:288-93.
- Pabari RM, Ramtoola Z. Effect of a disintegration mechanism on wetting, water absorption, and disintegration time of orodispersible tablets. J Young Pharm 2012;4(3):157-63.
[Crossref] [Google Scholar] [PubMed]
- Dhakal B, Thakur JK, Mahato RK, Rawat I, Rabin DC, Chhetri RR, et al. Formulation of ebastine fast?disintegrating tablet using co-processed super disintegrants and evaluation of quality control parameters. Sci World J 2022;2022(1):9618344.
[Crossref] [Google Scholar] [PubMed]
- Ledolter J, Kardon RH. Focus on data: Statistical design of experiments and sample size selection using power analysis. Invest Ophthalmol Visual Sci 2020;61(8):11.
[Crossref] [Google Scholar] [PubMed]
 .
.