- *Corresponding Author:
- Xiaojun Zhang
Department of Oncology, The First Affiliated Hospital of Gannan Medical University, Ganzhou, Jiangxi 341000, China
E-mail: wawdj1984@163.com
| This article was originally published in a special issue,“New Research Outcomes in Drug and Health Sciences” |
| Indian J Pharm Sci 2023:85(6) Spl Issue “115-127” |
This is an open access article distributed under the terms of the Creative Commons Attribution-NonCommercial-ShareAlike 3.0 License, which allows others to remix, tweak, and build upon the work non-commercially, as long as the author is credited and the new creations are licensed under the identical terms
Abstract
In this study, we sought to identify the crucial genes and pathways involved in the dynamic development of hepatocellular carcinoma. In matched normal and hepatocellular carcinoma samples, differentially expressed genes were found using the R tool (DESeq). The R package "weighted gene co-expression network analysis" was then used to build a co-expression network for the obtained gene expression matrix. We used the "survival" and "survminer" R packages to compute the survival endpoints of overall survival and recurrence-free survival. Using the "clusterProfiler" R package, gene ontology, Kyoto encyclopedia of genes and genomes, and reactome enrichment studies of the co-expression modules were carried out. Cytoscape was used to gain a deeper understanding of the network. We discovered that 1237 genes were down-regulated in cancer tissues as compared to healthy controls, while 3443 genes were up-regulated (fold change >2 or fold change-2, padjust<0.05). Then, using gene set enrichment analysis to compare the tumor sample with healthy controls, we looked for pathway enrichments. The results revealed five significantly enriched pathways, including the cell cycle, oocyte meiosis, G2M checkpoint, mitotic spindle, and base excision repair, which is partially in line with differentially expressed genes-Kyoto encyclopedia of genes and genomes pathway enrichment findings. Nine genes were investigated, including RPL8, SLC27A5, KIF23, BUB1B, TRIM16, SCNM1, TKT, RFXANK, and GINS1. The gene expression omnibus dataset was also used to further validate the top five genes with the highest membership within each module. The gene expression omnibus dataset’s findings largely agreed with earlier research showing that these important genes were substantially correlated with tumor grade, tumor, node, metastasis/cancer of the liver Italian program/Barcelona clinic liver cancer stages, and overall survival/ relapse-free-survival. Finally, using quantitative real-time reverse transcription-polymerase chain reaction and immunohistochemistry, we identified the selected six genes (RPL8, SLC27A5, KIF23, BUB1B, TRIM16, and SCNM1) and discovered that they were compatible with earlier findings. These pathways and genes that bioinformatics and clinical samples found and validated may be involved in the course of hepatocellular carcinoma and may be used as possible biomarkers of hepatocellular carcinoma patients to aid in diagnosis and prognostication. It provides a new idea and direction for drug therapy of hepatocellular carcinoma.
Keywords
Hepatocellular carcinoma, Kaplan-Meier survival analysis, drug therapy, hepatitis, bevacizumab
Hepatocellular Carcinoma (HCC) is a highly prevalent malignant tumor, with 95 % of new cases worldwide eventually resulting in death each year. The occurrence of HCC is primarily influenced by various factors such as liver cirrhosis, chronic hepatitis virus infection, metabolic disorders, and autoimmune hepatitis. Currently, standard treatment methods include chemotherapy, radiotherapy, radiofrequency ablation, tumor resection, and liver transplantation. However, these methods have limited efficacy for advancedstage HCC patients, and the prognosis remains unfavorable. Therefore, the development of new drugs for HCC treatment is crucial. Currently, drugs approved for HCC treatment mainly include multikinase inhibitors (such as sorafenib, lenvatinib, cabozantinib), immune checkpoint inhibitors (such as nivolumab, pembrolizumab), and angiogenesis inhibitors (such as bevacizumab). These drugs function through different mechanisms, including the inhibition of tumor cell proliferation, invasion, angiogenesis, or enhancing the body’s immune response to slow down tumor progression and metastasis. However, these drugs also face several limitations, including drug resistance, toxic side effects, and high costs. To overcome these challenges, multiple clinical trials are currently underway, covering the development of new drugs such as tislelizumab (Programmed Death-1 (PD-1) inhibitor), tremelimumab (Cytotoxic T-Lymphocyte–Associated Antigen 4 (CTLA- 4) inhibitor), durvalumab (PD-L1 inhibitor), and more. These drugs hold the promise of providing more effective treatment for HCC patients, offering new hope for improving patient’s quality of life and survival. In recent years, with the development of high-throughput sequencing technologies, a wealth of genomics, transcriptomics, proteomics, and metabolomics data have been generated, providing abundant resources for uncovering the molecular mechanisms of HCC and discovering new drug targets[1-3].
A current understanding of the molecular basis of tumor growth, differentiation, survival, and recurrence has been gained from gene expression studies[4-6]. A single gene may not completely capture the characteristics of the tumor due to tumor heterogeneity, despite the discovery of multiple cancer-related molecular biological indicators. Transcript-based prognostic characteristics are becoming common these days. In glioblastoma, a group of genes was identified, and a module emerged that demonstrated better prognostic potential than any single gene[7]. In other words, genome-wide expression analysis may help to depict a variety of cancers more accurately. Instead of analyzing individual gene expression variations, co-expression network analysis concentrates on the interactions between genes. However, it might also concentrate on the crucial genes found in each significant module. By unsupervised locating internal modules of synchronized expression genes, co-expression network analysis has been employed in cancer research to elucidate signaling pathways[8], treatment resistance[9], and tumor heterogeneity[10]. It was done on HCC to show specific progression patterns from chronic hepatitis B and C[11]. Meanwhile, it has been shown that coexpression analysis can help predict the survival of patients with glioma and breast cancer[12,13].
In the quest for new drug treatments for HCC, it is crucial to gain insights into the molecular mechanisms and biomarkers of liver cancer. Liver cancer is a highly heterogeneous disease, with different patients exhibiting varying gene expression profiles and mutation spectra, which can impact their responses to drugs and prognosis. Therefore, the utilization of high-throughput genomics technologies such as Ribonucleic Acid-sequencing (RNA-seq) to analyze gene expression data from liver cancer patients can aid in uncovering the molecular characteristics and classification of liver cancer, as well as identifying key modules or genes relevant to clinical aspects. This study is based on this rationale, examining the connections between The Cancer Genome Atlas (TCGA) RNA-seq data and medical information and elucidating key modules or genes associated with various clinical aspects (Overall Survival (OS), Recurrence Free Survival (RFS), or tumor grading). The analytical approach employed in this research includes Weighted Gene Co-expression Network Analysis (WGCNA). To validate these findings, Gene Expression Omnibus (GEO) datasets were collected during this process. This research methodology holds the promise of providing us with a deeper understanding of the molecular mechanisms of HCC and offering more precise guidance for future drug treatment strategies.
Materials and Methods
Sample collecting:
We obtained the TCGA gene expression in HCC together with medical data from the UCSC Xena website (https://xenabrowser.net/datapages/), which contains 373 cancer specimens and 50 healthy samples. The gene expression dataset for validation (GSE14520) was obtained from the GEO database (www.ncbi.nlm.nih.gov/geo) under the Affymetrix HT Human Genome U133A Array platform, which contains 445 tumor samples.
Data pre-processing and differential expression analysis:
For the differential expression analysis, the RSEM-produced normalized reads count matrix for gene expression was chosen[14]. We rounded off the expression matrix, and filtered genes expressed in <3 samples. Thereafter, using the R program DESeq2[15], we extracted the Differentially Expressed Genes (DEGs) by the thresholds of fold change >2 or fold change <-2, padjust<0.05.
Co-expression network construction:
The R package “WGCNA” was utilized to build a co-expression network for the prepared gene expression matrix[16]. First, we performed hierarchical clustering using the gene expression profile for all tumor samples, six outlier samples were removed for a better co-expression result. To assess the consistency of gene expression, Pearson’s correlations were determined between each gene pair. An adjacency matrix was then produced and turned into a Topological Overlap Matrix (TOM)[17]. Next, taking into account the TOM-based diversity, average linkage hierarchical clustering was applied. The minimum number of co-expression gene modules was set at 30, and the soft-thresholding parameter, which can be employed to highlight high positive correlations while ignoring the impact of negative correlations, was set as a cluster of 5.9 gene modules, and we did not further merge these modules considering that the clustering result was satisfactory.
Clinical and survival analysis:
Following the association of modules with clinical traits and the determination of the pertinent gene significance (correlation between genes and traits) and module membership (correlation between module Eigen gene and gene expression profile), we chose the top five hub-genes for additional validation, using both the GEO set and clinical samples[18].
The “survival” and “survminer” R package (https:// CRAN.R-project.org/package=survMisc) were used to determine OS and RFS[19], which were used as survival endpoints. In order to perform single-module survival analysis, the data were dichotomized based on the median expression of each gene module. To determine the Hazard Ratio (HR), Cyclooxygenase (COX) regression analysis was applied. The survival curve was created using the Kaplan-Meier method, and a log-rank test was utilized for comparison. We further examined the relationship between these genes and clinical parameters (Alanine Transaminase (ALT) level, Alpha-Fetoprotein (AFP) level, Tumour, Node, Metastasis (TNM) staging, Cancer of the Liver Italian Program (CLIP) staging, and Barcelona Clinic Liver Cancer (BCLC) staging) to further prove the clinical importance of the genes chosen for validation by the GEO dataset.
Functional annotation:
Based on the findings of the genetic composition analysis, functional annotation of the modules has been completed. The R package “clusterProfiler” was used to carry out Gene Ontology (GO)[20], Kyoto Encyclopedia of Genes and Genomes (KEGG) and reactome enrichment analyses of the co-expression modules. Moreover, highlevel linkages (weight >0.35 for “turquoise” module and weight >0.05 for “yellow” module) of the co-expressed genes were preserved, and the software Cytoscape was applied to provide more detailed network insights[21,22]. The central genes were defined as those that exhibit strong withinmodule correlation and a significant relationship with Membership Value (MEs). The hub genes were discovered using the largest module kME, a measure of the relationship between each gene and each ME. To present the results, the WGCNA data was loaded into the network application Cytoscape.
Gene Set Enrichment Analysis (GSEA):
A widely used tool for detecting the relationship between a collection of genes and a phenotype in gene expression profiling data sets is GSEA, which was created by Subramanian et al.[23]. GSEA was able to find gene sets that were strongly linked to the desired phenotypes. This enrichment was calculated using the Kolmogorov-Smirnov (KS) statistic[24], which contrasts the actual distribution of genes throughout a genome-wide list of genes ranked according to their correlation with the trait with the predicted random distribution of genes in a set. Here, TCGA dataset was used to conduct GSEA analysis (cancer vs. normal) based on an online GSEA software (https://genepattern.broadinstitute.org/gp/pages/login.jsf).
Patients and specimens:
Two distinct cohorts were included in this investigation. Ten patients who underwent hepatectomy procedures at the first affiliated hospital of Anhui Medical University (Hefei, China) between June 2017 and October 2017 and who had been pathologically diagnosed with HCC were included in cohort[1]. Newly excised HCC tissues and surrounding benign samples were taken from these patients. From the pathology department of the aforementioned hospital, paraffin-embedded samples from 73 HCC patients who underwent initial surgical resection between March 2009 and November 2013 were randomly selected for cohort[2]. The study was approved by the first hospital connected with Anhui Medical University’s Biomedical Ethics Committee after each patient gave their informed consent. Pathological staging was performed according to the international staging system[25].
Quantitative Reverse Transcription-Polymerase Chain Reaction (RT-PCR):
Fresh tissues total RNA was extracted using Invitrogen’s TRIzol reagent in accordance with the manufacturer’s instructions. To create the complementary Deoxyribonucleic Acid (cDNA) template, 2 μg of total RNA was reverse transcribed using a first strand cDNA kit from Invitrogen. Using a SYBR Green PCR kit from Takara, Dalian, China, qRT-PCR was performed using an Applied Biosystems 7500 Fast RT-PCR system (Rotkreuz, Switzerland). Glyceraldehyde 3-Phosphate Dehydrogenase (GADPH) acted as an intrinsic standard for targeting genes. PCR reaction was carried out in three parallel holes. The following were the primer sequences (5'-3'):
RPL8, forward; AAGGGCATCGTCAAGGACATC SLC27A5, forward; TGGAGGAGATCCTTCCCAAGC, r e v e r s e ; TGGTCCCCGAGGTATAGATGAA KIF23, forward; AGTCAGCGAGAGCTAAGACAC BUB1B, forward; AAATGACCCTCTGGATGTTTGG, reverse; GGTTGAGTCTGTAGCCCTCAG, reverse; GCATAAACGCCCTAATTTAAGCC TRIM16, forward; GTCCTGTCTAACCTGCATGGT SCNM1, forward; CCGTGCAGGCAAGAAACATC, reverse; GGCAGTATCGCCAGTTGTG, reverse; TCTGGGTGATAAGTCGTGTCT GADP and forward; GCACCGTCAAGGCTGAGAAC R GCCTTCTCCATGGTGGTGAA.
Immunohistochemically staining:
Immunohistochemically staining was implemented on 2 μm thick pathological slices prepared with tissue blocks inserted in paraffin. The slices were routinely dewaxed to water and antigen retrieval was carried out in a citrate solution under high pressure conditions. The source and working fluid concentrations of the relevant antibodies were RPL8 (Sigma-Aldrich, Rabbit, 1:450 dilution), SLC27A5 (Sigma-Aldrich, Rabbit, 1:150 dilution), KIF23 (Santa Cruz, Rabbit, 1:35 dilution), BUB1B (Abcam, Mouse, 1:100 dilution), TRIM16 (Sigma- Aldrich, Rabbit, 1:100 dilution), SCNM1 (Sigma- Aldrich, Rabbit, 1:150 dilution). Phosphate Buffer Solution (PBS) was used as a negative control instead of the primary antibody, and the positive section was referred to as a positive control. The specific steps are carried out according to the kit instructions; DAB color development, and hematoxylin counterstaining. The slice scores were evaluated by two independent pathologists using semi-quantitative integration. The definite means are as follows, first scored according to staining intensity; 0 for colorless, 1 for light yellow, 2 for brownish yellow, 3 for brown, the staining intensity is compared according to the background coloring; then the percentage of positive cells is scored; 0 for negative, 1 for ≤10 %, 2 for 11 %-50 %, 3 for 51 %-75 % and 4 for >75 %. The two parts were multiplied, ≥5 was defined as high expression, and <5 was defined as low expression.
Results and Discussion
We examined the pooled TCGA dataset to examine the changes in gene expression profiles (DEGs) between HCC biopsy specimens and healthy controls. The normal and malignant gene sets could first be successfully separated using Principal Component Analysis (PCA) (fig. 1A). In contrast to normal controls, we discovered that 1237 genes were down-regulated in cancer tissues, whereas 3443 genes were up-regulated (fold change >2 or fold change <-2, padjust<0.05; fig. 1B). We conducted the KEGG pathway enrichments for these upregulated (fig. 1C) and downregulated (fig. 1D) DEGs, and the findings revealed that the up-regulated genes were more frequently concentrated in the cell cycle, DNA replication, calcium signaling pathway, systemic lupus erythematosus, and neuroactive ligand-receptor interaction pathways, whereas the down-regulated genes, were more heavily enriched in chemical carcinogenesis, complement and coagulation cascades, valine, fatty acid degradation, leucine and isoleucine degradation, and retinol metabolism pathways.
Fig. 1: Genes that are expressed differently in HCC are identified, (A): The normal and cancer gene sets were separated by PCA; (B): The volcano plot shows DEGs (fold change >2 or fold change <-2, padjust<0.05); (C and D): The KEGG analysis of these upregulated and downregulated DEGs and (E-I): Gene set enrichment analysis for the pathway enrichments by comparing the tumor set with normal controls
GSEA is a mathematical approach that assesses whether a group of genes that have been predetermined exhibit statistically meaningful, consistent differences between two distinct biological states. We applied GSEA analysis for the pathway enrichments by comparing the tumor set with normal controls, results showed five significantly enriched pathways (fig. 1E-fig. 1I), including cell cycle, oocyte meiosis, G2M checkpoint, mitotic spindle and base excision repair, partly consistent with the pathway enrichment results of DEG-KEGG.
Fig.1 genes that are expressed differently in HCC are identified. A normal and cancer gene sets were separated by PCA. B the volcano plot shows DEGs (fold change >2 or fold change <-2, padjust<0.05). C, D the KEGG analysis of these upregulated and downregulated DEGs. GSEA for the pathway enrichments by comparing the tumor set with normal controls.
In order to extract the gene co-expression modules from the merged TCGA dataset, we used the WGCNA algorithm. We first employed sample clustering to identify outliers, and pool analysis was used to eliminate four samples (fig. 2A). Since WGCNA concentrates on the TOM rather than the correlation between two genes, it may be able to show recurrent patterns of gene co-expression in the transcriptome. WGCNA elucidated nine coexpressed modules ranging in size from 95 (pink) to 1286 (turquoise) (assigning each module an arbitrary color for reference) (fig. 2B). These modules were used for subsequent analyses.
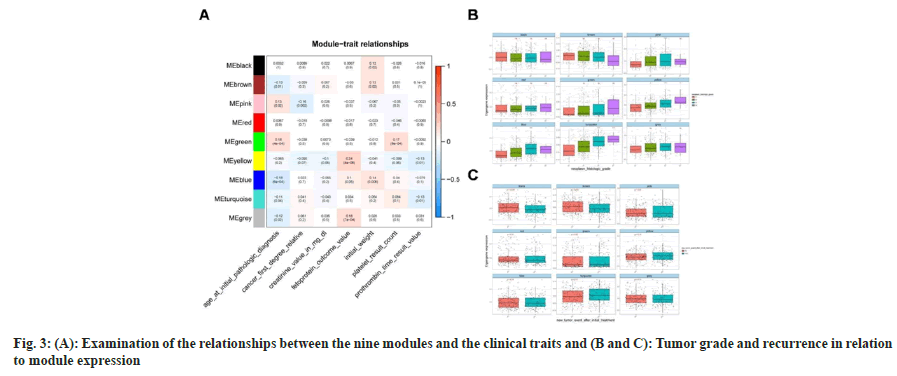
Our goal was to determine whether a gene cluster from each of the identified modules could be connected to HCC clinical characteristics. We evaluated the Pearson’s correlations between each module and the clinical aspects and found the green module to be strongly and favorably related to age (at initial pathologic diagnosis, r2=0.18, p<4×10⁻⁴) and platelets (r2=0.17, p<8×10⁻⁴). Genes of yellow (r2=0.24, p<4×10⁻⁶), blue (r2=0.1, p<0.05) and grey (r2=0.18, p<7×10⁻⁴) modules were positively associated with fetoprotein, one of the important markers for the prediction of digestive system carcinoma (details shown in fig. 3A). Additionally, we investigated how tumor grade and recurrence were related to module expression and found that pink, yellow, blue, and turquoise modules were significantly associated with tumor grade, whereas black and brown modules were significantly associated with tumor recurrence (fig. 3B and fig. 3C). According to these findings, significantly co-expressed genes in the same module may have biological importance.
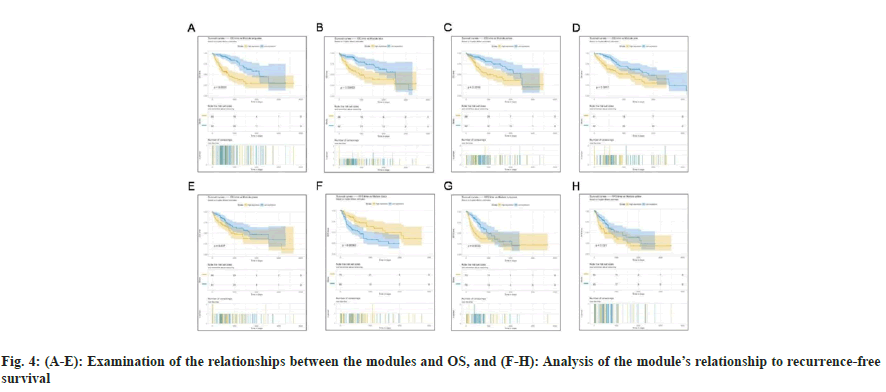
The correlation of the modules with OS and RFS was explored, considering their biological significance. Next, the Cox regression model was then used to determine the HRs and accompanying p values for each dichotomized module in 423 patients with complete survival data. We discovered that turquoise, blue, yellow, pink, and green modules were strongly linked with OS (fig. 4A-fig. 4E), whereas black, turquoise, and yellow modules were significantly connected with RFS (fig. 4F-fig. 4H). More expression of genes within turquoise and yellow modules indicated poor OS (turquoise, p<0.0001; yellow: p<0.0016) and RFS (turquoise, p<0.0033; yellow: p<0.021) for patients with HCC, whereas higher expression of genes within green (p=0.037), pink (p=0.0017) and blue (p=0.00063) only indicated poor OS. In contrast, down-regulated expression of genes within the black module indicated poor OS (p=0.00063). The results of a survival study based on these modules provided additional support for their biological significance, particularly as prognostic indicators for patients with HCC.
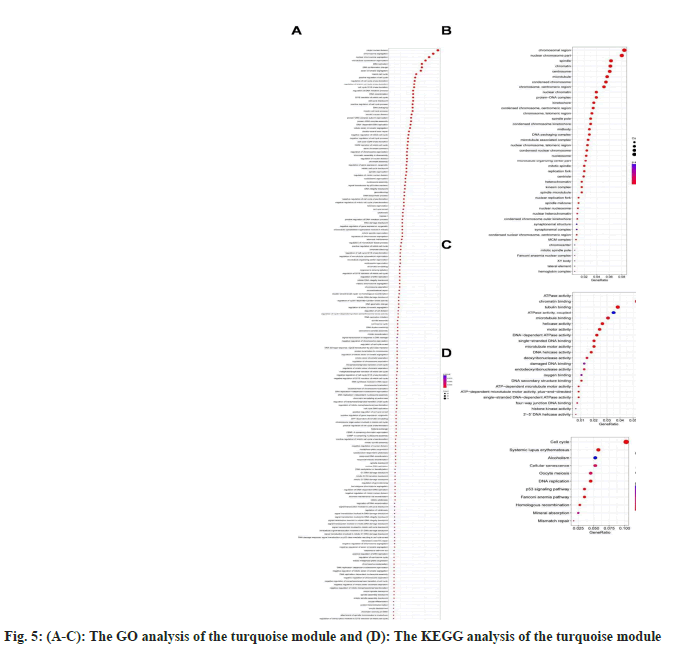
We specialized on the modules in turquoise and yellow for subsequent enrichment analyses because the turquoise (1286 genes) and yellow (390) modules were correlated with tumor grade, OS, and RFS features. For turquoise, we applied GO-biological pathways, cellular components, and molecular function enrichments (fig. 5A-fig. 5C), as well as KEGG analysis (fig. 5D). According to KEGG enrichment results, the majority of the genes in the turquoise module were enriched in pathways related to the cell cycle, systemic lupus erythematosus, alcoholism, cellular senescence, oocyte meiosis, and DNA replication. Only a small number of genes in the yellow module were enriched in any particular pathway.
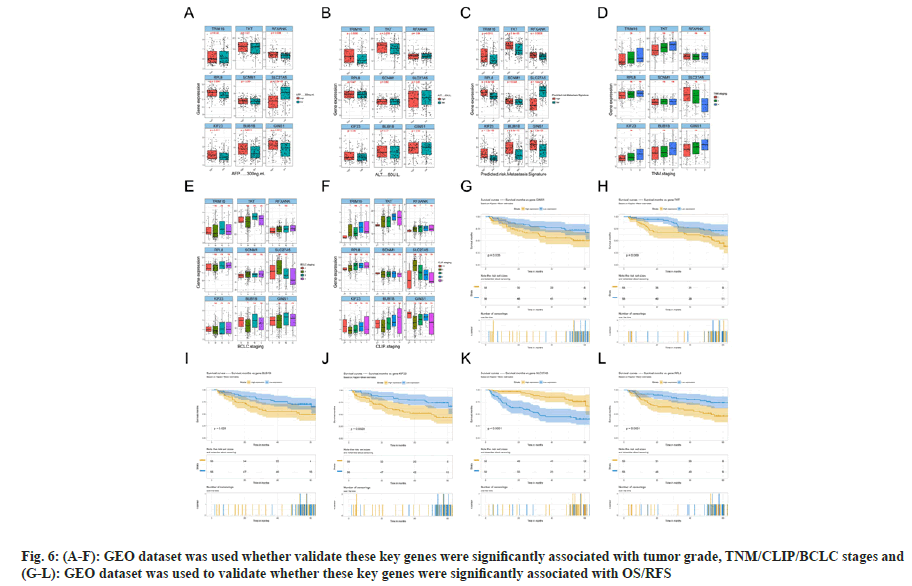
Considering the significance of pink, green, yellow, blue, turquoise and black modules, owing to their association with tumor grade, OS or RFS, we applied another GEO dataset to further validate the top five genes with highest membership within each module. Finally, nine genes were analyzed, including RPL8, SLC27A5, KIF23, BUB1B, TRIM16, SCNM1, TKT, RFXANK and GINS1, and some were excluded, since they had no correlation with OS or RFS (TICRR and TRIM16L were not detected in the GEO dataset). The results were mostly consistent with previous findings that these key genes were significantly associated with tumor grade, TNM/CLIP/BCLC stages (fig. 6Afig. 6F), and OS/RFS (fig. 6G-fig. 6L).
These genes may be involved in the initiation and progression of HCC, and some of them have been validated as effective drug targets or candidate compounds, providing crucial clues for subsequent drug design or screening. For example, RPL8 is a ribosomal protein that can interact with various drugs such as doxorubicin, doxycycline, and fluorouracil, affecting the proliferation and apoptosis of tumor cells. SLC27A5 is a fatty acid transport protein that can regulate the sensitivity and tolerance of liver cancer cells to chemotherapy drugs. KIF23 is a microtubule-driven protein that can serve as a novel anti-tumor drug target, and some small molecule inhibitors have shown inhibitory effects on liver cancer cells. BUB1B is a spindle checkpoint protein that can serve as a prognostic indicator and therapeutic target, and some natural products have been shown to induce apoptosis in liver cancer cells by inhibiting BUB1B. TRIM16 is a tripartite motif-containing protein that can act as an anti-tumor factor, regulating the migration and invasion of liver cancer cells. SCNM1 is a sodium channel regulatory factor that can influence the absorption and excretion of certain drugs by liver cancer cells. These genes not only have significant biological functions but also hold potential pharmaceutical value, warranting further research and development.
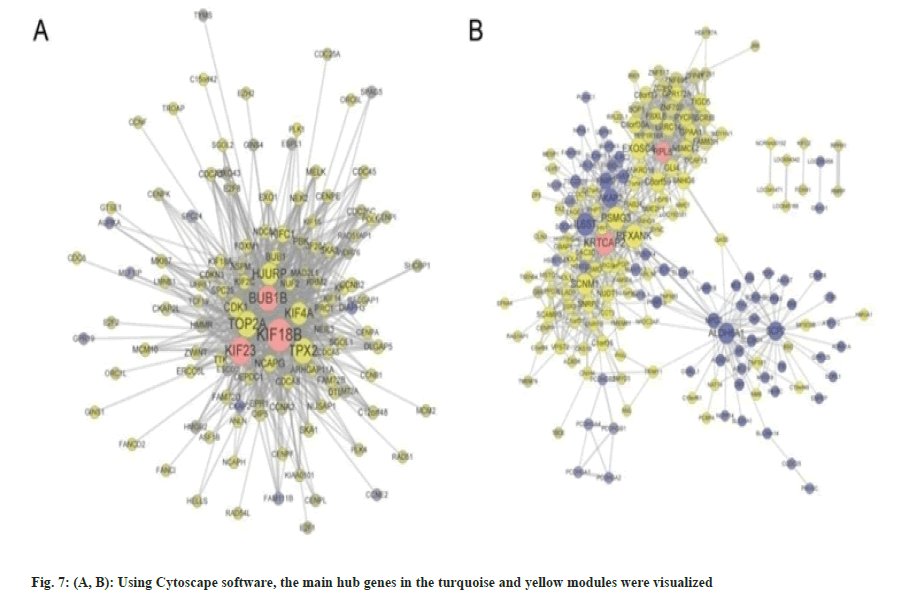
Building upon these insights, we then proceeded to investigate the critical modules in HCC and their associated hub genes, as well as their potential significance in the context of HCC. Based on the above analyses, we found the modules in yellow and turquoise to be the two extremely important modules for HCC, and the top hub-genes within these two modules were also validated to be markedly correlated with tumor clinic opathological features using another distinct GEO dataset. As a result, we additionally utilized Cytoscape software to recognize the important hub genes in the turquoise and yellow modules (fig. 7A and fig. 7B). The results were in line with earlier discoveries, demonstrating a strong association between these genes and others in each module and suggesting that they may be essential for the initiation or progression of HCC.
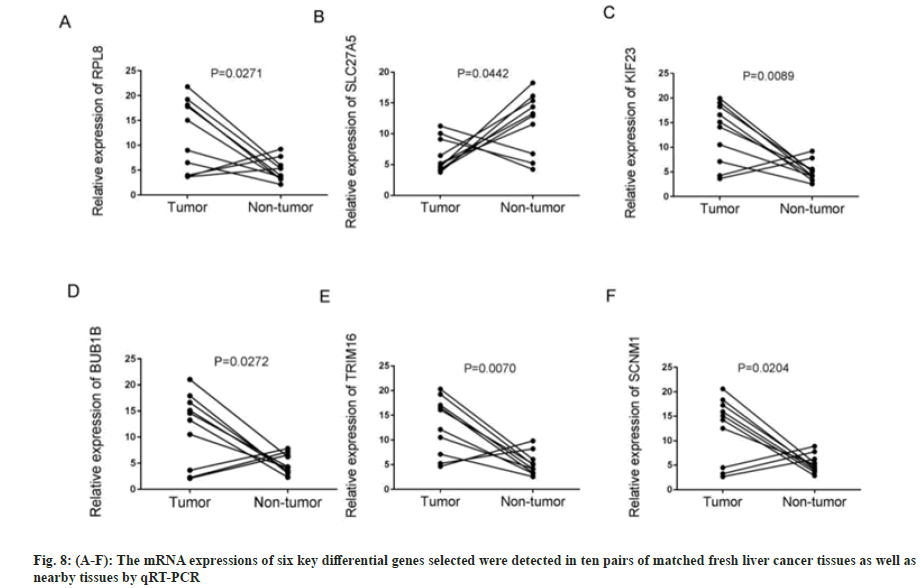
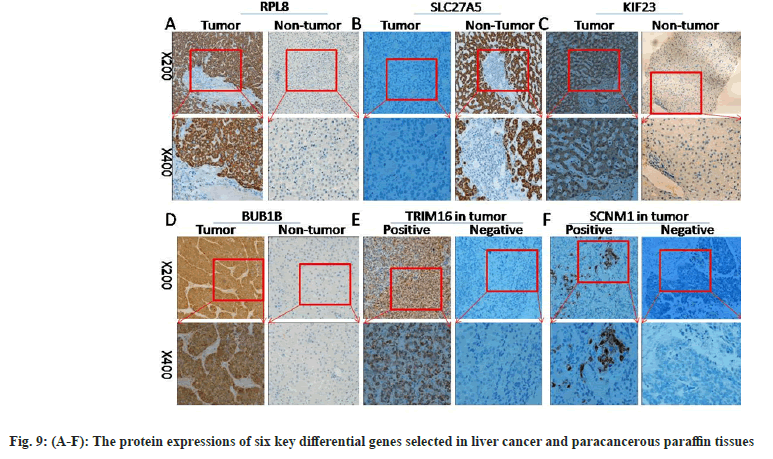
First, the messenger Ribonuclic Acid (mRNA) expressions of six key differential genes selected were detected in ten pairs of matched fresh liver cancer tissues and adjacent tissues by qRT-PCR. fig. 8A-fig. 8F demonstrates that the expression of several genes, including RPL8, KIF23, BUB1B, TRIM16, and SCNM1, was significantly upregulated in HCC tissues (p<0.05), while, in comparison to HCC tissues, SLC27A5 expression was considerably higher in the surrounding tissues (p<0.05), which was consistent with earlier findings analyzed using bioinformatics techniques. The expressions of six important differential genes were then detected using IHC in 46 cases of paracancerous paraffin tissues and 73 cases of liver cancer. As shown in fig. 9A-fig. 9F and Table 1-Table 6, the findings suggest that the protein expression of these genes, RPL8, KIF23, BUB1B, TRIM16, and SCNM1, was significantly elevated in HCC tissues compared to paracancerous tissues (p<0.05), while SLC27A5 was considerably reduced in HCC tissues compared to paracancerous tissues (p<0.05). The expressions of protein level were mainly consistent with RNA expression datum. In conclusion, experimental validation of six key DEGs, namely RPL8, SLC27A5, KIF23, BUB1B, TRIM16, and SCNM1, revealed significant differences in their expression levels between HCC tissues and normal tissues, and these differences were closely associated with clinical characteristics and prognosis of patients. Some of these genes have been reported to possess antitumor activity or influence drug metabolism and transport functions, providing a basis for further exploration of their roles in HCC treatment.
| Characteristic | Case | RPL8 expression | p | |
|---|---|---|---|---|
| High | Low | |||
| HCC tissues | 73 | 40 (54.8 %) | 33 (45.2 %) | 0.018 |
| Paracancerous tissues | 46 | 15 (32.6 %) | 31 (67.4 %) | |
Note: Chi-square test was utilized to compare groups
Table 1: Expression of The RPL8 Protein in Tissues With and Without HCC
| Characteristic | Case | SLC27A5 expression | p | |
|---|---|---|---|---|
| High | Low | |||
| HCC tissues | 73 | 31 (42.5 %) | 42 (57.5 %) | 0.029 |
| Paracancerous tissues | 46 | 29 (63.0 %) | 17 (37.0 %) | |
Note: Chi-square test was used for comparison between groups
Table 2: Expression of The SLC27A5 Protein in Tissues With and Without HCC
| Characteristic | Case | KIF23 expression | p | |
|---|---|---|---|---|
| High | Low | |||
| HCC tissues | 73 | 44 (60.3 %) | 29 (39.7 %) | 0.044 |
| Paracancerous tissues | 46 | 19 (41.3 %) | 27 (58.7 %) | |
Note: Chi-square test was utilized to compare groups
Table 3: Expression of the KIF23 Protein in Tissues With and Without HCC
| Characteristic | Case | BUB1B expression | p | |
|---|---|---|---|---|
| High | Low | |||
| HCC tissues | 73 | 38 (52.1 %) | 35 (47.9 %) | 0.011 |
| Paracancerous tissues | 46 | 13 (28.3 %) | 33 (71.7 %) | |
Note: Chi-square test was utilized to compare groups
Table 4: Expression of The BUB1B Protein in Tissues With and Without HCC
| Characteristic | Case | BUB1B expression | p | |
|---|---|---|---|---|
| High | Low | |||
| HCC tissues | 73 | 49 (67.1 %) | 24 (32.9 %) | 0.037 |
| Paracancerous tissues | 46 | 22 (47.8 %) | 24 (52.2 %) | |
Note: Chi-square test was utilized to compare groups
Table 5: Expression of the TRIM16 Protein in Tissues With and Without HCC
| Characteristic | Case | BUB1B expression | p | |
|---|---|---|---|---|
| High | Low | |||
| HCC tissues | 73 | 45 (61.6 %) | 28 (38.4 %) | 0.017 |
| Paracancerous tissues | 46 | 18 (39.1 %) | 28 (60.9 %) | |
Note: Chi-square test was utilized to compare groups
Table 6: Expression of the SCNM1 Protein in Tissues With and Without HCC
Table 1-Table 6 explains expressions of RPL8, SLC27A5, KIF23, BUB1B, TRIM16 and SCNM1 proteins in neighboring tissues and tissues with HCC.
It is envisaged that gene signatures derived from genome-based assays would aid in the stratification of HCC[26]. The identification of gene signatures for predicting cancer survival or recurrence in numerous cancer types, including bladder cancer[27], renal cancer[28], and HCC[29], has been the focus of numerous investigations. In this study, the WGCNA approach was used to analyze the mRNA datasets containing 423 HCC samples in order to identify the genes associated with clinic opathological traits in HCC and patient prognosis.
By contrasting tumor and normal samples, we first examined the DEGs, and then we looked at the KEGG pathway enrichment. The calcium signaling route, systemic lupus erythematosus, the cell cycle, and DNA replication pathways were all found to have significant DEG prevalence, and the majority of these pathways have been shown to be linked to the progression of HCC. We also conducted GSEA analysis, the outcomes of which differed slightly from those of KEGG analysis of DEGs; the genes were markedly elevated in cell cycle-related pathways.
Then, nine distinct co-expression modules were found using the WGCNA analysis. While turquoise, blue, yellow, pink, and green modules were significantly associated with OS, yellow, turquoise, and black modules were strongly associated with RFS. For each module, we conducted a Cox-regression analysis to determine their significance for survival. These results confirmed that pink, yellow, blue, and turquoise modules were highly associated with tumor grade, but black and brown modules were strongly linked with tumor recurrence. For the turquoise and yellow modules, we also used GO and KEGG enrichment analyses. The genes in the turquoise module were mostly found to belong to cell cyclerelated pathways, which indicated that they are likely the most significant genes for HCC at the mRNA level. Interestingly, we discovered that the KEGG enrichment results were largely similar to the GSEA pathway enrichment results.
The top five hub-genes from the pink, yellow, blue, turquoise, and black modules were validated using a different GEO dataset, and we discovered that RPL8, SLC27A5, KIF23, TRIM16, SCNM1, TKT, RFXANK, and GINS1 genes were significantly associated with OS or RFS outcomes in HCC, which is only partially consistent with AFP and ALT levels or TNM/CLIP/BCLC stages. In addition, we examined the levels of the top six significant gene’s protein and mRNA expression in patient samples of HCC. The outcomes ultimately corroborated the validity and significance of the present findings. Additionally, we used Cytoscape to visualize the hub genes in the turquoise and yellow modules to get insight into underlying mechanisms. We observed that these substantial hubgenes were highly related to other genes, further confirming their representative roles in each module or even in HCC[30-34].
This study verified the top five hub genes in the pink, yellow, blue, green, and black modules using different GEO datasets, including RPL8, SLC27A5, KIF23, TRIM16, SCNM1, TKT, RFXANK, and GINS1. These genes exhibited significant correlations with HCC’s OS or RFS outcomes, and some of them were consistent with AFP and ALT levels or TNM/CLIP/BCLC staging. Additionally, protein and mRNA expression levels of the top six crucial genes were examined in HCC patient samples, ultimately confirming the validity and significance of these findings. Furthermore, to gain deeper insights into potential mechanisms, we visualized the hub genes in the turquoise and yellow modules using Cytoscape, observing their high correlations with other genes, further substantiating their representative roles in each module and even in HCC. In summary, these discoveries will provide more accurate prognostic and diagnostic information for HCC patients. In this study, we performed transcriptome sequencing and differential expression analysis of HCC tissues and adjacent tissues, annotated their functions, and discussed relevant drug targeting possibilities. Genes such as RPL8, SLC27A5, KIF23, BUB1B, TRIM16, SCNM1, and others not only play critical biological roles but also hold potential value in drug development. Our clinical validation results indicated that these genes are closely associated with clinical characteristics and prognosis in patients and exhibit consistent expression patterns and prognostic value across different populations. In conclusion, our research offers new insights and directions for HCC drug therapy, but further experimental validation and clinical trials are needed to confirm our findings and optimize treatment strategies, aiming to provide better survival prospects for HCC patients.
Funding:
This research was made possible thanks to funding from the Jiangxi Provincial Administration of Traditional Chinese Medicine's Natural Science Foundation (2022A035) and Ganzhou Health Commission Science and Technology Plan Project (2023-2-90).
Author’s contributions:
Original draft preparation and experience by Zhenli Guo and Ying Chen. Bioinformatics analysis by Jinghua Zhong and An Li. And reviewing and editing by Xiaojun Zhang.
Conflict of interests:
The authors declared no conflict of interests.
References
- Ferlay J, Soerjomataram I, Dikshit R, Eser S, Mathers C, Rebelo M, et al. Cancer incidence and mortality worldwide: Sources, methods and major patterns in GLOBOCAN 2012. Int J Cancer 2015;136(5):E359-86.
[Crossref] [Google Scholar] [PubMed]
- Dhungel B, Jayachandran A, Layton CJ, Steel JC. Seek and destroy: Targeted adeno-associated viruses for gene delivery to hepatocellular carcinoma. Drug Deliv 2017;24(1):289-99.
[Crossref] [Google Scholar] [PubMed]
- Mínguez B, Hoshida Y, Villanueva A, Toffanin S, Cabellos L, Thung S, et al. Gene-expression signature of vascular invasion in hepatocellular carcinoma. J Hepatol 2011;55(6):1325-31.
[Crossref] [Google Scholar] [PubMed]
- Yu GR, Kim SH, Park SH, Cui XD, Xu DY, Yu HC, et al. Identification of molecular markers for the oncogenic differentiation of hepatocellular carcinoma. Exp Mol Med 2007;39(5):641-52.
[Crossref] [Google Scholar] [PubMed]
- Roessler S, Jia HL, Budhu A, Forgues M, Ye QH, Lee JS, et al. A unique metastasis gene signature enables prediction of tumor relapse in early-stage hepatocellular carcinoma patients. Cancer Res 2010;70(24):10202-12.
[Crossref] [Google Scholar] [PubMed]
- Woo HG, Park ES, Cheon JH, Kim JH, Lee JS, Park BJ, et al. Gene expression–based recurrence prediction of hepatitis b virus–related human hepatocellular carcinoma. Clin Cancer Res 2008;14(7):2056-64.
[Crossref] [Google Scholar] [PubMed]
- Ping Y, Deng Y, Wang L, Zhang H, Zhang Y, Xu C, et al. Identifying core gene modules in glioblastoma based on multilayer factor-mediated dysfunctional regulatory networks through integrating multi-dimensional genomic data. Nucl Acids Res 2015;43(4):1997-2007.
[Crossref] [Google Scholar] [PubMed]
- Horvath S, Zhang B, Carlson M, Lu KV, Zhu S, Felciano RM, et al. Analysis of oncogenic signaling networks in glioblastoma identifies ASPM as a molecular target. Proc Natl Acad Sci 2006;103(46):17402-7.
[Crossref] [Google Scholar] [PubMed]
- Ignatiadis M, Singhal SK, Desmedt C, Haibe-Kains B, Criscitiello C, Andre F, et al. Gene modules and response to neoadjuvant chemotherapy in breast cancer subtypes: A pooled analysis. J Clin Oncol 2012;30(16):1996-2004.
[Crossref] [Google Scholar] [PubMed]
- Liang Y, Diehn M, Watson N, Bollen AW, Aldape KD, Nicholas MK, et al. Gene expression profiling reveals molecularly and clinically distinct subtypes of glioblastoma multiforme. Proc Natl Acad Sci 2005;102(16):5814-9.
[Crossref] [Google Scholar] [PubMed]
- He D, Liu ZP, Honda M, Kaneko S, Chen L. Coexpression network analysis in chronic hepatitis B and C hepatic lesions reveals distinct patterns of disease progression to hepatocellular carcinoma. J Mol Cell Biol 2012;4(3):140-52.
[Crossref] [Google Scholar] [PubMed]
- Ivliev AE, Hoen PA, Sergeeva MG. Coexpression network analysis identifies transcriptional modules related to proastrocytic differentiation and sprouty signaling in glioma. Cancer Res 2010;70(24):10060-70.
[Crossref] [Google Scholar] [PubMed]
- Clarke C, Madden SF, Doolan P, Aherne ST, Joyce H, O’driscoll L, et al. Correlating transcriptional networks to breast cancer survival: A large-scale coexpression analysis. Carcinogenesis 2013;34(10):2300-8.
[Crossref] [Google Scholar] [PubMed]
- Li B, Dewey CN. RSEM: Accurate transcript quantification from RNA-Seq data with or without a reference genome. BMC Bioinformatics 2011;12:323.
[Crossref] [Google Scholar] [PubMed]
- Love MI, Huber W, Anders S. Moderated estimation of fold change and dispersion for RNA-seq data with DESeq2. Genome Biol 2014;15(12):1-21.
[Crossref] [Google Scholar] [PubMed]
- Langfelder P, Horvath S. WGCNA: An R package for weighted correlation network analysis. BMC Bioinformatics 2008;9(1):1-3.
[Crossref] [Google Scholar] [PubMed]
- Li A, Horvath S. Network module detection: Affinity search technique with the multi-node topological overlap measure. BMC Res Notes 2009;2(1):1-4.
[Crossref] [Google Scholar] [PubMed]
- Dong J, Horvath S. Understanding network concepts in modules. BMC Syst Biol 2007;1:1-20.
[Crossref] [Google Scholar] [PubMed]
- Sinnwell JP, Therneau TM, Schaid DJ. The kinship2 R package for pedigree data. Hum Hered 2014;78(2):91-3.
[Crossref] [Google Scholar] [PubMed]
- Yu G, Wang LG, Han Y, He QY. clusterProfiler: An R package for comparing biological themes among gene clusters. OMICS 2012;16(5):284-7.
[Crossref] [Google Scholar] [PubMed]
- Wang J, Huang Q, Liu ZP, Wang Y, Wu LY, Chen L, et al. NOA: A novel network ontology analysis method. Nucleic Acids Res 2011;39(13):e87.
[Crossref] [Google Scholar] [PubMed]
- Shannon P, Markiel A, Ozier O, Baliga NS, Wang JT, Ramage D, et al. Cytoscape: A software environment for integrated models of biomolecular interaction networks. Genome Res 2003;13(11):2498-504.
[Crossref] [Google Scholar] [PubMed]
- Subramanian A, Tamayo P, Mootha VK, Mukherjee S, Ebert BL, Gillette MA, et al. Gene set enrichment analysis: A knowledge-based approach for interpreting genome-wide expression profiles. Proc Natl Acad Sci 2005;102(43):15545-50.
[Crossref] [Google Scholar] [PubMed]
- Subramanian A, Kuehn H, Gould J, Tamayo P, Mesirov JP. GSEA-P: A desktop application for gene set enrichment analysis. Bioinformatics 2007;23(23):3251-3.
[Crossref] [Google Scholar] [PubMed]
- German AI, Wittekind C. TNM system: On the 7th ed of TNM classification of malignant tumors. Pathologe 2010;31(5):331-2.
[Crossref] [Google Scholar] [PubMed]
- Villanueva A, Minguez B, Forner A, Reig M, Llovet JM. Hepatocellular carcinoma: Novel molecular approaches for diagnosis, prognosis, and therapy. Ann Rev Med 2010;61:317-28.
[Crossref] [Google Scholar] [PubMed]
- Yuan L, Shu B, Chen L, Qian K, Wang Y. Overexpression of COL3A1 confers a poor prognosis in human bladder cancer identified by co-expression analysis. Oncotarget 2017;8(41):70508.
[Crossref] [Google Scholar] [PubMed]
- Yuan L, Chen L, Qian K, Qian G, Wu CL, Wang X, et al. Co-expression network analysis identified six hub genes in association with progression and prognosis in human clear cell Renal Cell Carcinoma (ccRCC). Genomics Data 2017;14:132-40.
[Crossref] [Google Scholar] [PubMed]
- Kurokawa Y, Matoba R, Takemasa I, Nagano H, Dono K, Nakamori S, et al. Molecular-based prediction of early recurrence in hepatocellular carcinoma. J Hepatol 2004;41(2):284-91.
[Crossref] [Google Scholar] [PubMed]
- Hu Z, Snitkin ES, de Lisi C. VisANT: An integrative framework for networks in systems biology. Brief Bioinformatics 2008;9(4):317-25.
[Crossref] [Google Scholar] [PubMed]
- Niu M, Yi M, Li N, Wu K, Wu K. Advances of targeted therapy for hepatocellular carcinoma. Front Oncol 2021;11:719896.
[Crossref] [Google Scholar] [PubMed]
- Zhang H, Zhang W, Jiang L, Chen Y. Recent advances in systemic therapy for hepatocellular carcinoma. Biomarker Res 2022;10:1-21.
[Crossref] [Google Scholar] [PubMed]
- Luo XY, Wu KM, He XX. Advances in drug development for hepatocellular carcinoma: Clinical trials and potential therapeutic targets. J Exp Clin Cancer Res 2021;40(1):172.
[Crossref] [Google Scholar] [PubMed]
- Sun H, Yang H, Mao Y. Personalized treatment for hepatocellular carcinoma in the era of targeted medicine and bioengineering. Front Pharmacol 2023;14:1150151.
[Crossref] [Google Scholar] [PubMed]


