- *Corresponding Author:
- R. W. Chen
Department of Medicine, Anhui University of Science and Technology, Huainan, Anhui 232001, China
E-mail: chenrw0910@163.com
| This article was originally published in a special issue, “Transformative Discoveries in Biomedical and Pharmaceutical Research” |
| Indian J Pharm Sci 2023:85(4) Spl Issue “71-81” |
This is an open access article distributed under the terms of the Creative Commons Attribution-NonCommercial-ShareAlike 3.0 License, which allows others to remix, tweak, and build upon the work non-commercially, as long as the author is credited and the new creations are licensed under the identical terms
Abstract
Low-grade gliomas are typically slow-growing tumors of the central nervous system, which can transform into more aggressive types within a decade. Radiotherapy is an effective treatment for suppressing the development of aggressive tumors. The purpose of this study was to explore the characteristics of radiosensitivity genes and the modeling of prognostic risk in patients with low-grade glioma. The data in this study come from the cancer genome atlas and prognostic assessment model was constructed based on the coefficient values of selected genes in multivariate Cox proportional hazards regression. The probability of individual survival was then predicted using a nomogram. Differences in tumor immune microenvironment between high and low-risk groups were analyzed. We constructed a prognostic radiosensitivity-related gene signature for patients with low-grade gliomas. Kaplan-Meier survival curve analysis revealed a significantly better prognosis for low-risk group than for high-risk group (p<0.001) and receiver operating characteristic curves show accuracies of 0.869, 0.912 and 0.873 for 1, 3 and 5 y, respectively. Radiosensitivity-related gene signature was identified as a single prognostic indicator with hazard ratio=1.159 and 95 % confidence interval=1.102-1.219 (p<0.001). The immune-related analysis showed radiosensitivity-related gene signature with significant differences in radiosensitivity between high and low-risk groups. We identified thymosin beta 4 X-linked, insulin-like growth factor binding protein 5, moesin, ribophorin 2, cyclin dependent kinase inhibitor 2C and prostaglandin F2 receptor negative regulator as the gene signatures for predicting the prognosis of patients receiving radiotherapy in low-grade gliomas.
Keywords
Radiosensitivity, radiotherapy, prognosis, gene signature, low-grade gliomas
Low-Grade Gliomas (LGG) occur in approximately 20 % of patients with Central Nervous System (CNS) tumors[1]. Although the incidence of LGG is low, it is the most prevalent brain tumor in children[2].The treatment of gliomas involves standard management approaches including observation, surgery, radiotherapy and/or chemotherapy, and it is determined based on many factors[3]. In particular, patients with LGG show a wide variation in their treatment responses to radiotherapy[4].
Previous studies have identified many radiosensitivity genes and more attempts are being made to construct robust gene signatures for the prognosis of various cancers, such as nasopharyngeal carcinoma, breast, pancreatic cancer and glioblastoma[5-7]. The Radiosensitivity Index (RSI) is derived from the 10 genes which includes Androgen Receptor (AR), Jun proto-oncogene (c-JUN), Signal Transducer and Activator of Transcription 1 (STAT1), Protein Kinase C beta (PRKCβ), v-Rel avian reticuloendotheliosis viral oncogene homolog A (RELA), cellular homolog of Abelson murine leukemia viral oncogene (cABL), Abelson murine leukemia viral oncogene homolog 1 (ABL1), Small Ubiquitin like Modifier 1 (SUMO1), Cyclin Dependent Kinase 1 (CDK1), Histone Deacetylase 1 (HDAC1) and Interferon Regulatory Factor 1 (IRF1) and it has been performed to predict the Survival Fraction at 2 Gray (SF2) across 48 human cell lines for pan-cancers[8]. Additionally, a 31-gene signature which include Syndecan 2 (SDC2), Metallothionein-1E (MT1E), Mesenchyme homeobox protein 2 (MEOX2), Lysyl Oxidase homolog 1 (LOXL1), Isoleucine (I) glutamine (Q) motif and Sec7 domain-containing protein 1 (IQSEC1), Intercellular Adhesion Molecule 1 (ICAM1), Chitinase-3-like protein 1 (CHI3L1), Cluster of Differentiation 163 (CD163), Complement component 1s (C1S), 3-hydroxybutyrate dehydrogenase 1 (BDH1), B-Cell Lymphoma 2-related protein A1 (BCL2A1), Podoplanin (PDPN), Myeloid Differentiation primary response 88 (MYD88), Galectin 8 (LGALS8), Interferon Stimulated exonuclease Gene 20 (ISG20), Adenosine Triphosphatase sarcoplasmic/endoplasmic reticulum Ca2+ transporting 1 (ATP2A1), Thyroid-Stimulating Hormone Receptor (TSHR), Tumor Necrosis Factor Receptor Superfamily member 1A (TNFRSF1A), T Cell leukemia Translocation Altered (TCTA), Solute Carrier family 27 member 3 (SLC27A3), S100 calcium binding protein A8 (S100A8), Platelet Derived Growth Factor subunit A (PDGFA), MX dynamin like guanine triphosphatase 1 (MX1), Moesin (MSN), Heat Shock factor Binding Protein 1 (HSBP1), Frizzled class receptor 7 (FZD7), Dynein Light chain Tctex-Type 3 (DYNLT3), Midkine (MDK), Growth factor Receptor Bound protein 10 (GRB10), Cytochrome B561 family member D2 (CYB561D2) and Developmentally Regulated Guanine Triphosphate (GTP) Binding Protein 2 (DRG2) is also reported as a robust approach for determining the radiosensitivity of gliomas[9].
It is generally believed that hypoxia genes such as Acylglycerol Kinase (AGK), ETS Translocation Variant 4 (ETV4), Partitioning Defective 6 family cell polarity regulator Alpha (PARD6A), Protein Tyrosine Phosphatase 4A2 (PTP4A2), Right Open reading frame Kinase 3 (RIOK3), Sigma non-opioid intracellular Receptor 1 (SIGMAR1), Solute Carrier family 34 member 2 (SLC34A2), Suppressor of Mothers Against Decapentaplegic (SMAD) Ubiquitination Regulatory Factor 1 (SMURF1), Serine/Threonine Kinase 33 (STK33), Transcription Elongation factor A Like 1 (TCEAL1), Tissue Factor Pathway Inhibitor (TFPI) and Uroporphyrinogen III Synthase (UROS) and their radiosensitivity risk indicator models are often developed to predict the prognosis of LGG[10]. However, these prognostic models are not comprehensive and seldom validated in the clinical patients with LGGs. This study aims to identify the gene signatures serving as a prognostic biomarker for predicting the Overall Survival (OS) of patients receiving radiotherapy in LGGs. We comprehensively analyzed 395 radiosensitive cancer genes with OS time in 514 patients from The Cancer Genome Atlas (TCGA) and the prognostic score was further validated in external cohort of 929 patients with LGGs from the Chinese Glioma Genome Atlas (CGGA).
Materials and Methods
Datasets and gene sets:
In this study, data related to 1114 patients were obtained from the TCGA database. A total of 514 patients were selected and their gene expression data was screened for genes related to radiosensitivity. An external validation cohort of gene expression was obtained from the CGGA. All the cohorts in this study were derived from published databases including TCGA and CGGA, and strictly followed publication guidelines. A total of 395 radiosensitive cancer genes were downloaded from the Cancer Radiosensitivity Regulation factors database (dbCRSR) (http://bioinfo.ahu.edu.cn:8080/dbCRSR/)[11].
Screening for radiosensitivity-related genes:
Patients with p<0.01 and Differentially Expressed Genes (DEG)>2 for log2FC were identified by linear models for microarray data (limma) R package. The related genes with radiosensitivity were selected in DEG. Radiosensitivity-associated genes with p<0.05 were searched by univariate Cox regression. Genes associated with radiosensitivity were searched by Least Absolute Shrinkage and Selection Operator (LASSO) Cox regression.
Establishment of a prognostic risk model:
To establish a prognostic risk model, 514 patients with LGGs were randomly divided into a training set (n=316) and a testing set (n=198). Multivariate Cox proportional risk regression analysis was then performed to establish a prognostic model for LGGs in an intersectional set of genes associated with radiation sensitivity. For the patient's risk score, the specific calculation method is:
Risk score = Σi=1N coefficient×gene expression
Consider N as the number of radiosensitivity-related genes.
The investigators incorporated radiosensitivity-related gene count data into the prognostic model and calculated the results for each LGG patient's risk score. The risk score is divided into low-risk group and high-risk group with the average value as the dividing line. The predictive ability for different risk groups was assessed by plotting Kaplan-Meier survival curves and Receiver Operating Characteristic (ROC) curve.
Bioinformatics analysis:
The identification of DEG requires the application of version 2.1.1 of the limma R package. Through multi-dimensional analysis such as Gene Ontology (GO), Kyoto Encyclopedia of Genes and Genomes (KEGG), the annotations of DEG and radioactivity-related indicators were analyzed. Not only that, but also to analyze the status of tumor-infiltrating immune cells through Cell-type Identification by Estimating Relative Subsets of Ribonucleic Acid (RNA) Transcripts (CIBERSORT) combined with LM22, a matrix file that includes genes and 22 mature human hematopoietic cell populations[12]. Differences in Tumor Microenvironment (TME) between risk groups were judged by using the Estimation of Stromal and Immune cells in Malignant Tumor tissues using Expression data (ESTIMATE) algorithm[13,14], while some references are from the Molecular Signature Database (MSigDB)[15,16]. Gene Set Enrichment Analysis (GSEA) of different risk groups was based on prognostic models[17]. Fixed Dose Rate (FDR)<0.05 and p<0.05 for Nonoperative Management (NOM) were considered to be rich in biological processes and pathways.
Statistical analysis:
All the statistical data was analyzed using R package (version 4.1.2). To confirm the association between clinical characteristics and risk score, this study used univariate and multivariate Cox regression analysis methods. Survival analysis was performed using Kaplan-Meier survival curves. Differences between two different risk groups were tested using the Kruskal-Wallis test. For the clinical characteristics of the two different risk groups, Fisher's exact test or chi-square (χ²) test was used. The relationship between gene expression, immune cell infiltration and immune microenvironment in the two different risk groups were evaluated using different coefficients of Pearson or Spearman.
Results and Discussion
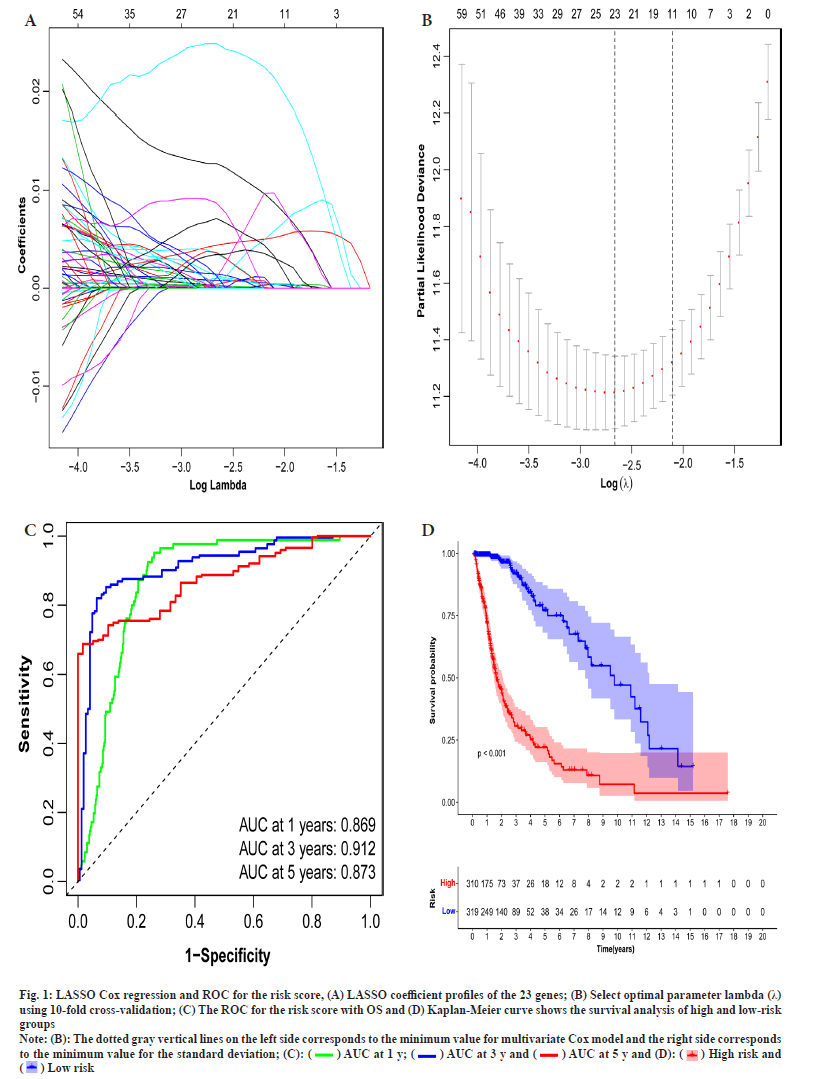
The Radiosensitivity-Related Gene Signature (RadRGSig) results were identified and the number of DEGs detected by different groups in the TCGA-LGG cohort was 1158, including 617 up-regulated genes and 541 down-regulated genes. A total of 345 radiosensitivity-related genes were selected from the DEGs according to the dbCRSR. GO and KEGG enrichment showed radiosensitivity (p<0.05) in function. Furthermore, 45 genes were filtered using the single-factor method and the number of genes that passed the LASSO Cox regression method and contracted was 23 genes (fig. 1A and fig. 1B). By using multivariate Cox regression analysis, 6 genes were found to be moderately associated with prognosis and obtained a refined prognostic model (Table 1). By establishing a risk score, specifically by:
Fig. 1: LASSO Cox regression and ROC for the risk score, (A) LASSO coefficient profiles of the 23 genes; (B) Select optimal parameter lambda (λ)
using 10-fold cross-validation; (C) The ROC for the risk score with OS and (D) Kaplan-Meier curve shows the survival analysis of high and low-risk
groups.
Note: (B): The dotted gray vertical lines on the left side corresponds to the minimum value for multivariate Cox model and the right side corresponds
to the minimum value for the standard deviation; 
 .
.
| Gene | Univariate Cox analysis | Multivariate Cox analysis | |||
|---|---|---|---|---|---|
| HR | p-value | Coefficient | HR | p-value | |
| SPP1 | 1.69 (1.51-1.90) | 1.20E-18 | |||
| TMSB4X | 2.30 (1.96-2.69) | 7.91E-25 | 0.37 | 1.45 (1.09-1.93) | 0.0106 |
| AQP1 | 1.51 (1.36-1.67) | 2.61E-14 | |||
| IGFBP5 | 1.83 (1.60-2.08) | 7.98E-19 | 0.14 | 1.15 (0.96-1.37) | 0.1217 |
| TUBA1B | 2.40 (1.87-3.10) | 1.21E-11 | |||
| MSN | 2.69 (2.25-3.21) | 1.46E-27 | 0.52 | 1.68 (1.29-2.18) | 0.0001 |
| RPN2 | 5.24 (3.58-7.67) | 1.46E-17 | -0.43 | 0.65 (0.36-1.17) | 0.1492 |
| PTMA | 2.94 (2.22-3.87) | 2.85E-14 | |||
| H2AFX | 2.12 (1.64-2.74) | 1.10E-08 | |||
| FCER1G | 1.88 (1.58-2.23) | 8.93E-13 | |||
| PIGT | 5.74 (4.09-8.05) | 6.08E-24 | |||
| CDKN2C | 1.89 (1.64-2.18) | 2.31E-18 | 0.23 | 1.25 (1.01-1.56) | 0.0444 |
| SHISA5 | 4.21 (3.04-5.85) | 7.96E-18 | |||
| NEK6 | 2.47 (1.98-3.07) | 9.05E-16 | |||
| SMS | 3.49 (2.68-4.55) | 2.15E-20 | |||
| GNS | 3.19 (2.46-4.13) | 2.78E-18 | |||
| PTGFRN | 2.78 (2.27-3.42) | 1.47E-22 | 0.43 | 1.54 (1.14-2.08) | 0.0049 |
| TFRC | 2.80 (2.26-3.46) | 3.83E-21 | |||
| PSMC2 | 7.34 (4.99-10.81) | 4.75E-24 | |||
| DCTD | 3.82 (2.83-5.16) | 2.50E-18 | |||
| RFC2 | 3.63 (2.76-4.79) | 5.57E-20 | |||
| NFIL3 | 2.44 (1.86-3.20) | 1.39E-10 | |||
| PBK | 1.72 (1.49-1.99) | 3.69E-13 | |||
Note: SPP1: Secreted Phosphoprotein 1; AQP1: Aquaporin 1; TUBA1B: Tubulin Alpha-1B; PTMA: Prothymosin Alpha; H2AFX: H2A histone family member X; FCER1G: Fc Fragment of Immunoglobulin Epislon (ε) Receptor 1G; PIGT: Phosphatidylinositol Glycan anchor biosynthesis class T; SHISA5: Shisa family member 5; NEK6: Never in Mitosis gene A(NIMA)-related Kinase-6; SMS: Spermine Synthase; GNS: Glucosamine (N-acetyl)-6-Sulfatase; TFRC: Transferrin Receptor; PSMC2: Proteasome 26S subunit adenosine triphosphatase 2; DCTD: Deoxycytidine monophosphate (DCMP) Deaminase; RFC2: Replication Factor C subunit 2; NFIL3: Nuclear Factor, Interleukin 3 regulated gene; PBK: PDZ-Binding Kinase.
Table 1: Univariate and Multivariate analysis of 6 genes selected from LASSO Cox regression.
Risk score = 0.37×Thymosin Beta 4 X-linked (TMSB4X)+0.14×Insulin-like Growth Factor Binding Protein 5 (IGFBP5)+0.52×MSN+(-0.43)×Ribophorin 2 (RPN2)+0.23×Cyclin Dependent Kinase Inhibitor 2C (CDKN2C)+0.44×Prostaglandin F2 Receptor Negative regulator (PTGFRN)
The risk score accuracy of the test cohort can be found by the ROC curve (fig. 1C). According to the Kaplan-Meier survival curve, it was found that there were significant differences in OS among different risk groups of LGG patients (p<0.001) (fig. 1D).
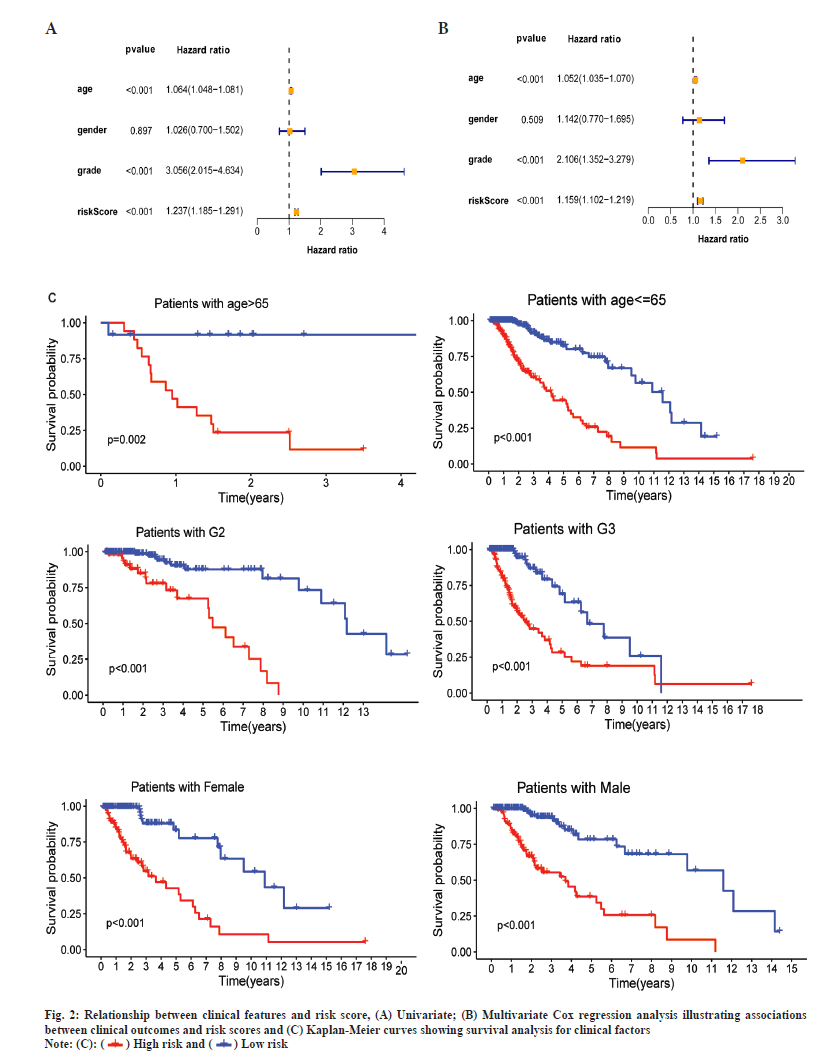
Through the Cox regression analysis of different variables and the combined use of clinical characteristics, it is judged whether the risk score can be used as a single prognostic factor. The Hazard Ratios (HRs), 95 % Confidence Interval (CI) and the p-values for the risk score were 1.237 (1.185-1.291), p<0.001 in univariate and 1.159 (1.102-1.219), p<0.001 in multivariate Cox regression analysis (fig. 2A and fig. 2B). The results of the Kaplan-Meier survival curves shows a clear difference (p<0.01) between clinical factors among risk groups which covers different ages, genders and stages of tumors (fig. 2C). The results showed significant association between clinical features and risk score (p<0.05), and also indicated a strong association between the risk score and the prognosis of LGG patients.
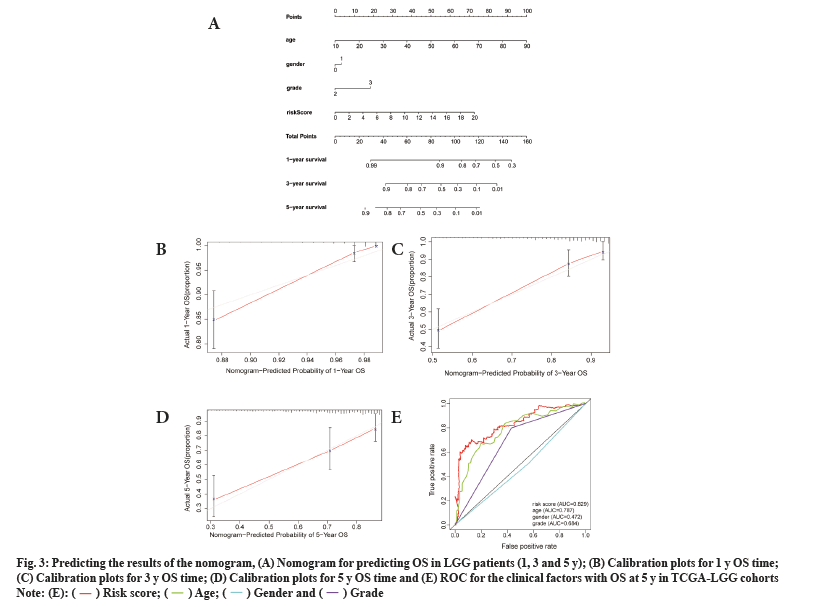
In this study, both clinical factors and risk scores were analyzed, and a prediction line map was established for the survival prediction of LGG patients at different times (1 y, 3 y and 5 y) (fig. 3A). The results of the adaptive nomogram calibration curve of OS time at different time’s shows that the mortality rate is basically the same as the actual mortality rate (fig. 3B-fig. 3D). The 5 y ROC curve illustrates that the risk score has the highest accuracy among the basic clinical characteristics of LGGs patients with Area Under the Curve (AUC)=0.829 (fig. 3E).
Fig. 3: Predicting the results of the nomogram, (A) Nomogram for predicting OS in LGG patients (1, 3 and 5 y); (B) Calibration plots for 1 y OS time;
(C) Calibration plots for 3 y OS time; (D) Calibration plots for 5 y OS time and (E) ROC for the clinical factors with OS at 5 y in TCGA-LGG cohorts.
 .
.
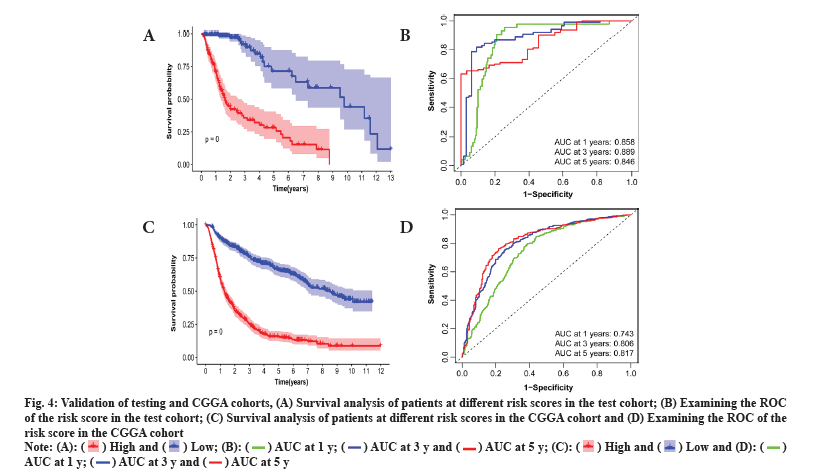
To test the prognostic ability of the prognostic model in this study, we randomly sampled 30 % of the patients from the TCGA-LGG cohorts as the internal testing cohort. The survival analysis showed that patients with the low risk score had higher OS than those with high risk scores (p<0.001) (fig. 4A). Prognostic model ROC values at different times (1 y, 2 y and 3 y) in the internal test cohort were 0.858, 0.889 and 0.846, respectively (fig. 4B).
Fig. 4: Validation of testing and CGGA cohorts, (A) Survival analysis of patients at different risk scores in the test cohort; (B) Examining the ROC
of the risk score in the test cohort; (C) Survival analysis of patients at different risk scores in the CGGA cohort and (D) Examining the ROC of the
risk score in the CGGA cohort.

 .
.
By using the same approach as that for the internal testing cohort, the Kaplan-Meier survival curve was used for the external cohort and indicated that patients could be stratified by the risk score (fig. 4C), and the ROC results of the external test cohort in the database at different times (1 y, 2 y and 3 y) are 0.743, 0.806 and 0.817, respectively (fig. 4D).
Regardless, the prognostic model of radiosensitivity-associated gene signatures is a robust and precise tool for patients with LGG who have undergone radiotherapy.
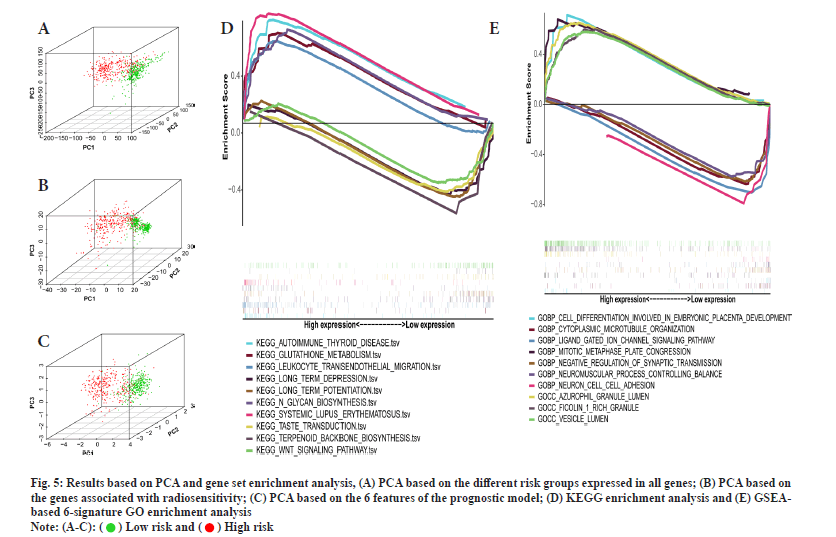
This study delved into the stratification ability of the 6-gene signature. Principal Component Analysis (PCA) by comparing different risk groups in the genome-wide, radiosensitivity-associated genes and 6-gene risk score models. The Three Dimensional (3D) map confirmed that the risk score can accurately distinguish between different risk groups. However, for the distinction of different risk groups, the genome-wide and radiosensitivity-associated genes cannot be accurately distinguished (fig. 5A-fig. 5C). The above results illustrate that the risk score is an accurate independent prognostic factor for LGG patients.
Fig. 5: Results based on PCA and gene set enrichment analysis, (A) PCA based on the different risk groups expressed in all genes; (B) PCA based on
the genes associated with radiosensitivity; (C) PCA based on the 6 features of the prognostic model; (D) KEGG enrichment analysis and (E) GSEAbased
6-signature GO enrichment analysis.
 .
.
To investigate the function of the prognostic signature, the GSEA was performed for annotation and the top 10 pathways were identified. Multiple tumor progression pathways enriched in low-risk patients (fig. 5D). Multiple cellular components of biological processes are enriched in high-risk patients. Those enriched in low-risk patients included cytoplasmic microtubule organization, negative regulation of synaptic transmission, etc. (fig. 5E). The above results confirmed that there may be a certain relationship between RadRGSig and tumor development, and immune microenvironment.
This study investigated differences in TME and immune cell affinity among different risk groups of LGG patients to evaluate whether there is an association between RadRGSig and TME. The immune microenvironment mainly examines the estimated score, immune score and matrix score. Along with that the high-risk group has higher values than the low-risk group in these three indicators (p<0.001) (fig. 6).
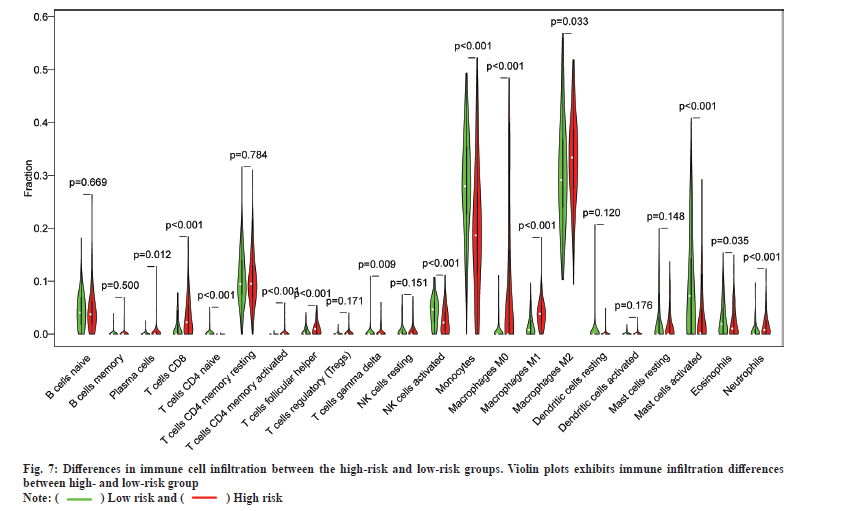
In addition, the results of immune cell infiltration in different risk groups showed that the low-risk group had higher T cells (p<0.001), gamma delta T cells (p<0.009), activated Natural Killer (NK) cells (p<0.001), monocytes (p<0.001), activated mast cells (p<0.001) and eosinophils (p<0.001). The high-risk group was higher in the proportion of plasma cells (p=0.012), T cells Cluster of Differentiation 8 (CD8) (p<0.001), T cell Cluster of Differentiation 4 (CD4) memory activation (p<0.001), T cell follicular helper cells (p<0.001), M0 macrophages (p<0.001), M1 macrophages (p<0.001), M2 macrophages (p=0.033) and neutrophils (p<0.001). These results indicate the developed RadRGSig is not only a prognostic signature, but it can also reveal the level of immune cell infiltration (fig. 7).
Based on the previous reports, approximately 50 % of patients with cancer should receive radiotherapy and the role of radiotherapy is confirmed to be optimally utilized in cancer treatment based on clinical guidelines[18]. Surgery is accepted as the major initial treatment in patients with LGGs and immediate postoperative radiotherapy provides a significant progression-free survival benefit. However, the OS of patients with LGGs did not improve. Thus, the important prognostic factors need to be considered when treating patients with LGGs.
Unfortunately, a universal radiosensitivity gene signature for the prognosis of patients with LGGs is not clear. This indicates the presence of other molecular factors; moreover, prognosis based on radiosensitivity-related genes has rarely been investigated in patients with LGGs.
We investigated the potential prognostic factors in TCGA-LGG cohorts and detected six genes (TMSB4X, IGFBP5, MSN, RPN2, CDKN2C and PTGFRN) as the radiosensitivity gene signature for patients with LGGs. TMSB4X is involved in cell glioma angiogenesis and tumor progression such as proliferation, migration and differentiation[19,20]. IGFBP5 inhibits cell proliferation and increases cell invasion by Endothelial-Mesenchymal Transition (EMT) and the Akt signaling pathway[21]. Targeting MSN with the microRNA-200c (miR-200c) suppresses the tumor progression of glioma[22]. We also found that MSN overexpression in the high-risk groups indicates poor prognosis in patients with LGGs. RPN2 overexpression inhibits the radiosensitivity of glioma cells by activating the Signal Transducer and Activator of Transcription 3 (STAT3) signal transduction pathway and is targeted by miR-181c; it mediates glioma progression and temozolomide sensitivity through the Wingless/Integrated (WNT)/beta-catenin signaling pathway[23,24]. Based on the pan-cancer analysis of homozygous deletions in primary tumors, CDKN2C is one of the rare tumor suppressors[25]. PTGFRN coordinates survival signaling in glioblastoma multiforme and its overexpression can predict tumor grade and enables the prognosis of glioma[26-28]. In conclusion, although these radiosensitivity genes are associated with the growth of glioma, it is the first time to report that they are prognostic biomarkers for LGGs.
We also assessed whether the prognostic RadRGSig is associated with the immune microenvironment. Infiltrating immune cells of gliomas comprise microglia, peripheral macrophages, leukocytes, granulocytes, Myeloid-Derived Suppressor Cells (MDSCs), T lymphocytes and Tregs[29]. The immune microenvironment results of different risk groups reflected the intratumoral density of glioma-associated macrophages and naive B cells, which showed a negative correlation with the survival rate of patients in the high-risk group, but activated mast cells and monocytes were associated with low-risk groups. The survival rate of patients in the low risk group showed a positive correlation.
Thus, despite the development of the important prognostic risk score of RadRGSig in this study, more experiments on gene components are required to determine their roles in LGGs.
In conclusion, we developed a prognostic risk score model RadRGSig comprising six radiosensitivity-related genes namely TMSB4X, IGFBP5, MSN, RPN2, CDKN2C and PTGFRN. This model provides a theoretical basis for the prognosis of patients with LGGs who have undergone radiotherapy. The present study has some limitations. First, this was a retrospective study based on the TCGA and CGGA databases, so new clinical samples and data were limited. Second, the mechanisms underlying the interactions among the radiosensitivity-related genes in patients with LGGs require further investigations.
In summary, the present study constructed a prognostic risk model for patients with LGGs who might respond to radiotherapy for the first time, suggesting that gene signature offers a promising biomarker for predicting the prognosis.
Author contributions:
Ruiwen Chen designed the study. Heng Yao analyzed the data and writing of the manuscript. All authors read and approved the final manuscript.
Conflict of interests:
The authors declared no conflict of interest.
References
- Bale TA, Rosenblum MK. The 2021 WHO classification of tumors of the central nervous system: An update on pediatric low-grade gliomas and glioneuronal tumors. Brain Pathol 2022;32(4):1-10.
[Crossref] [Google scholar] [PubMed]
- Youssef G, Miller JJ. Lower grade gliomas. Curr Neurol Neurosci Rep 2020;20(7):1-9.
[Crossref] [Google scholar] [PubMed]
- Oberheim Bush NA, Chang S. Treatment strategies for low-grade glioma in adults. J Oncol Pract 2016;12(12):1235-41.
[Crossref] [Google scholar] [PubMed]
- Wang TJ, Mehta MP. Low-grade glioma radiotherapy treatment and trials. Neurosurg Clin N Am 2019;30(1):111-8.
[Crossref] [Google scholar] [PubMed]
- Dai Y, Zhang Y, Yang M, Zhou L, Pan H, Xiao T, et al. Radiosensitivity-related genes and clinical characteristics of nasopharyngeal carcinoma. Biomed Res Int 2020;2020:1-13.
[Crossref] [Google scholar] [PubMed]
- Eschrich SA, Fulp WJ, Pawitan Y, Foekens JA, Smid M, Martens JW, et al. Validation of a radiosensitivity molecular signature in breast cancer. Clin Cancer Res 2012;18(18):5134-43.
[Crossref] [Google scholar] [PubMed]
- Strom T, Hoffe SE, Fulp W, Frakes J, Coppola D, Springett GM, et al. Radiosensitivity index predicts for survival with adjuvant radiation in resectable pancreatic cancer. Radiother Oncol 2015;117(1):159-64.
[Crossref] [Google scholar] [PubMed]
- Dai YH, Wang YF, Shen PC, Lo CH, Yang JF, Lin CS, et al. Radiosensitivity index emerges as a potential biomarker for combined radiotherapy and immunotherapy. NPJ Genom Med 2021;6(1):1-10.
[Crossref] [Google scholar] [PubMed]
- Meng J, Li P, Zhang Q, Yang Z, Fu S. A radiosensitivity gene signature in predicting glioma prognostic via EMT pathway. Oncotarget 2014;5(13):4683-93.
[Crossref] [Google scholar] [PubMed]
- Du Z, Liu H, Bai L, Yan D, Li H, Peng S, et al. A radiosensitivity prediction model developed based on weighted correlation network analysis of hypoxia genes for lower-grade glioma. Front Oncol 2022;12:1-13.
[Crossref] [Google scholar] [PubMed]
- Wen P, Xia J, Cao X, Chen B, Tao Y, Wu L, et al. dbCRSR: A manually curated database for regulation of cancer radiosensitivity. Database 2018;2018:1-8.
[Crossref] [Google scholar] [PubMed]
- Chen B, Khodadoust MS, Liu CL, Newman AM, Alizadeh AA. Profiling tumor infiltrating immune cells with CIBERSORT. Methods Mol Biol 2018;1711:243-59.
[Crossref] [Google scholar] [PubMed]
- Anderson NM, Simon MC. The tumor microenvironment. Curr Biol 2020;30(16):R921-5.
[Crossref] [Google scholar] [PubMed]
- Yoshihara K, Shahmoradgoli M, Martínez E, Vegesna R, Kim H, Torres-Garcia W, et al. Inferring tumour purity and stromal and immune cell admixture from expression data. Nat Commun 2013;4(1):1-11.
[Crossref] [Google scholar] [PubMed]
- Liberzon A, Birger C, Thorvaldsdóttir H, Ghandi M, Mesirov JP, Tamayo P. The molecular signatures database hallmark gene set collection. Cell Syst 2015;1(6):417-25.
[Crossref] [Google scholar] [PubMed]
- Liberzon A, Subramanian A, Pinchback R, Thorvaldsdóttir H, Tamayo P, Mesirov JP. Molecular signatures database (MSigDB) 3.0. Bioinformatics 2011;27(12):1739-40.
[Crossref] [Google scholar] [PubMed]
- Subramanian A, Tamayo P, Mootha VK, Mukherjee S, Ebert BL, Gillette MA, et al. Gene set enrichment analysis: A knowledge-based approach for interpreting genome-wide expression profiles. Proc Natl Acad Sci U S A 2005;102(43):15545-50.
[Crossref] [Google scholar] [PubMed]
- Delaney G, Jacob S, Featherstone C, Barton M. The role of radiotherapy in cancer treatment: Estimating optimal utilization from a review of evidence-based clinical guidelines. Cancer 2005;104(6):1129-37.
[Crossref] [Google scholar] [PubMed]
- Morita T, Hayashi KI. Tumor progression is mediated by thymosin-β4 through a TGFβ/MRTF signaling axis TGFβ/Tβ4/MRTF signaling in tumor progression. Mol Cancer Res 2018;16(5):880-93.
[Crossref] [Google scholar] [PubMed]
- Zhang X, Han J, Fan D, Wang J, Lin X, Zhang H, et al. Lysine-40 succinylation of TAGLN2 induces glioma angiogenesis and tumor growth through regulating TMSB4X. Cancer Gene Ther 2023;30(1):172-81.
[Crossref] [Google scholar] [PubMed]
- Dong C, Zhang J, Fang S, Liu F. IGFBP5 increases cell invasion and inhibits cell proliferation by EMT and Akt signaling pathway in glioblastoma multiforme cells. Cell Div 2020;15(1):1-9.
[Crossref] [Google scholar] [PubMed]
- Qin Y, Chen W, Liu B, Zhou L, Deng L, Niu W, et al. miR-200c inhibits the tumor progression of glioma via targeting moesin. Theranostics 2017;7(6):1663-73.
[Crossref] [Google scholar] [PubMed]
- Li C, Ran H, Song S, Liu W, Zou W, Jiang B, et al. Overexpression of RPN2 suppresses radiosensitivity of glioma cells by activating STAT3 signal transduction. Mol Med 2020;26(1):1-9.
[Crossref] [Google scholar] [PubMed]
- Sun J, Ma Q, Li B, Wang C, Mo L, Zhang X, et al. RPN2 is targeted by miR-181c and mediates glioma progression and temozolomide sensitivity via the wnt/β-catenin signaling pathway. Cell Death Dis 2020;11(10):1-15.
[Crossref] [Google scholar] [PubMed]
- Cheng J, Demeulemeester J, Wedge DC, Vollan HK, Pitt JJ, Russnes HG, et al. Pan-cancer analysis of homozygous deletions in primary tumours uncovers rare tumour suppressors. Nat Commun 2017;8(1):1-14.
[Crossref] [Google scholar] [PubMed]
- Aguila B, Morris AB, Spina R, Bar E, Schraner J, Vinkler R, et al. The Ig superfamily protein PTGFRN coordinates survival signaling in glioblastoma multiforme. Cancer Let 2019;462:33-42.
[Crossref] [Google scholar] [PubMed]
- Chen HW, Lin MC, Wu PR, Chang YC, Weng SS, Tsai WC. Prostaglandin F2 receptor inhibitor overexpression predicts advanced who grades and adverse prognosis in human glioma tissue. Chin J Physiol 2022;65(2):93-102.
[Crossref] [Google scholar] [PubMed]
- Mala U, Baral TK, Somasundaram K. Integrative analysis of cell adhesion molecules in glioblastoma identified prostaglandin F2 receptor inhibitor (PTGFRN) as an essential gene. BMC Cancer 2022;22(1):1-12.
[Crossref] [Google scholar] [PubMed]
- Gieryng A, Pszczolkowska D, Walentynowicz KA, Rajan WD, Kaminska B. Immune microenvironment of gliomas. Lab Invest 2017;97(5):498-518.
[Crossref] [Google scholar] [PubMed]
 .
.

 .
.


