- *Corresponding Author:
- A. S. Wu
Department of Oncology, The Affiliated Zhuzhou Hospital of Xiangya Medical College, Central South University, Zhuzhou, Hunan 412007, China
E-mail: wuanshan2022@163.com
| This article was originally published in a special issue,
“Advanced Targeted Therapies in Biomedical and Pharmaceutical Sciences” |
| Indian J Pharm Sci 2023:85(1) Spl Issue “43-50” |
This is an open access article distributed under the terms of the Creative Commons Attribution-NonCommercial-ShareAlike 3.0 License, which allows others to remix, tweak, and build upon the work non-commercially, as long as the author is credited and the new creations are licensed under the identical terms
Abstract
In order to obtain the target gene that affects the prognosis of osteosarcoma and to establish the risk ratio and prognosis of prediction model was the objective of the study. We obtained messenger ribonucleic acid transcriptome data from gene expression Omnibus database and clinical data from therapeutically applicable research to generate effective treatments database. Through intersection of differential genes, we obtained key genes in gene expression Omnibus database and then we used them to conduct survival analysis and establish risk ratio in therapeutically applicable research to generate effective treatments database. We obtained complement C1qA and complement C1qB as the differential key genes through GSE14359, GSE28424, GSE33382 and GSE36001 from gene expression Omnibus database. The expression of complement C1qA and complement C1qB were significantly different in 4 series data (p<0.01). Meanwhile, complement C1qA and complement C1qB have significant correlation in osteosarcoma clinical samples (p=8.61e-64, ρSpearman=0.97, 95 % confidence interval (0.96-0.98). The survival time of overexpression of complement C1qA and complement C1qB samples were significantly prolonged (p=0.0026 and p=0.006), area under the curve=0.689 (95 % confidence interval, 0.575-0.804), 0.702 (95 % confidence interval, 0.595-0.809), 0.641 (95 % confidence interval, 0.513-0.768) respectively. Complement C1qA and complement C1qB over-expression can significantly prolong survival time and can be used as predictors of survival in osteosarcoma.
Keywords
Complement C1qA, complement C1qB, osteosarcoma, prognosis, hazard ratio, gene expression Omnibus database, therapeutically applicable research to generate effective treatments database
Osteosarcoma (OSA) is the most common primary Bone Sarcomas (BS) (incidence: 0.3/100 000/y)[1]. The incidence is higher in adolescents (0.8-1.1/100 000/y at age 15-19 y) but there is a significant 2nd peak in the 7th and 8th decades of life. The male to female ratio is 1.4:1[2,3]. OSA most common lesions were the distal femur and the metaphysis of the proximal tibia with active growth[4]. Low grade intramedullary OSA accounts for 2 % of all OSA and the location of the disease is similar to that of classical OSA[5]. OSA mainly has three subtypes: Intramedullary, surface and extraosseous. Intramedullary high-grade OSA is a classic pathological type, accounting for 80 % of all OSA[6].
At present, OSA main therapy method includes chemotherapy, surgery and radiation therapy. Decades ago, amputation is recommended for patients with OSA because the mortality rate of limb preservation is unacceptable. However, the 5 y survival rate is still only 20 %[7]. With the use of chemotherapy drugs, the survival rate of OSA has been significantly improved. The addition of doxorubicin, cisplatin or cyclophosphamide to highdose methotrexate increased disease-free survival to up to 65 %[8,9]. The 5 y relative survival rate of people with localized appendicular tumours is 70 %, but in those who present with distant metastasis, survival is dramatically diminished to less than 20 %-30 %[10,11].
In the recent decades, researchers have summarized the clinically relevant information about prognostic indicators of poor outcome which include advanced age, secondary OSA (such as from Paget’s disease), elevated serum Lactate Dehydrogenase (LDH), large primary tumor size and axial/proximal tumor location[12,13]. However, it did not further reduce the mortality of OSA, especially metastasis and recurrence. With the rapid development of gene sequencing, more and more tumors are sequenced to improve their survival time by individual treatment. In order to improve the survival rate of OSA, we used Gene Expression Omnibus (GEO) and Therapeutically Applicable Research to Generate Effective Treatment (TARGET) databases to analyze gene sequencing data of OSA tissues and cell lines, and to identify key differential genes and provide ideas for improving treatment method of OSA.
Materials and Methods
Data collection and workflow illustration:
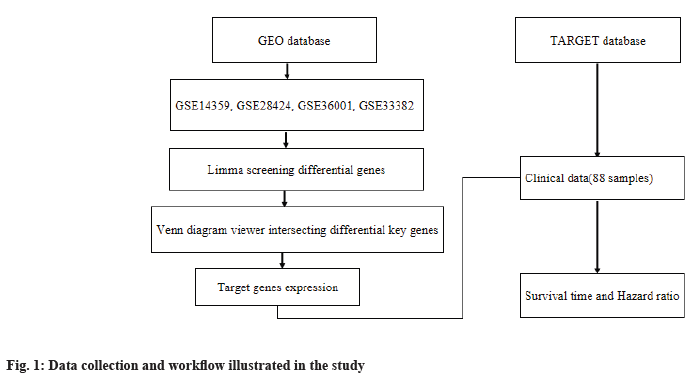
We obtained messenger Ribonucleic Acid (mRNA) transcriptome data from GEO database (https://www.ncbi.nlm.nih.gov/geo/) and clinical data from TARGET (https://ocg.cancer.gov/programs/target) database of osteosarcoma, respectively. In this study, through the intersection of differential genes, we got key genes in GEO database and then we used them to conduct survival analysis and established risk ratio in TARGET database. The workflow is illustrated in fig. 1.
Gene expression profile and intersection of differential key genes analysis:
We selected series data, GSE14359, GSE28424, GSE33382 and GSE36001 from GEO database. Then, we obtained expression profile genes through clusterProfiler package in R version 4.0.2 (http://www.r-project.org/). Next, we used the limma package (version 3.40.6) to analyze the differential genes. The threshold for identifying significant Differentially Expressed Genes (DEGs) was False Discovery Rate (FDR)<0.01 and |log2 (Fold Change (FC))|≥2. Venn diagram was used to show the relationship between differential genes and obtained intersecting differential key genes from four series data.
Clinical samples and mRNA expression:
mRNA expression data (88 samples, Workflow type: HTSeq-Fragments Per Kilobase Million (FPKM)) and clinical information were downloaded from TARGET database. The following samples were excluded, “0” gene expression value and insufficient survival information. A total of 87 patients with OSA with the corresponding clinical features were enrolled in this study. We analyzed the clinical characteristics, including age, sex, primary tumor location, metastasis or non-metastasis, total survival time and survival status (Table 1). Analysis of survival curve and establishment of prediction model for differential key genes in four series data was used in this study.
| Clinical characteristics | N (%) |
|---|---|
| Age (y) | |
| <14 | 39, (44.32 %) |
| ≥14 | 49, (55.68 %) |
| Sex | |
| Male | 51, (57.95 %) |
| Female | 37, (42.05 %) |
| Primary tumor site | |
| Arm | 6, (6.82 %) |
| Foot | 80, (90.91 %) |
| Other | 2, (2.27 %) |
| Metastasis | |
| No | 66, (75 %) |
| Yes | 22, (25 %) |
| Overall survival time (years) | |
| <2 | 29, (32.95 %) |
| 2-5 | 26, (29.55 %) |
| >5 | 32, (36.36 %) |
| C1QA expression | |
| High | 43, (49.43 %) |
| Low | 44, (50.57 %) |
| C1QB expression | |
| High | 43, (49.43 %) |
| Low | 44, (50.57 %) |
Note: One sample has not been marked with the survival time, which has been excluded
Table 1: Clinical Characteristics of 88 Samples of OSA from Target Database
Statistical analysis:
The Student’s t-test (R function t-test) was used to determine whether there were significant differences between the two groups and p-value<0.05 was considered to be statistically significant. Statistical Package for the Social Sciences (SPSS) 21.0 software was used in this study and Receiver Operating Characteristic (ROC) curve and survival curve was drawn.
Results and Discussion
Clinical characteristics of 88 samples of OSA from TARGET database was shown in Table 1. We collected 88 samples of osteosarcoma from TARGET database. They are confirmed with osteosarcoma through pathology diagnosis. 39 (44.32 %) samples of age<14 y and 49 (55.68 %) samples of age≥14 y were collected, respectively. 51 (57.95 %) samples are of male and 37 (42.05 %) samples are from female. The osteosarcoma primary tumor site is foot and it mainly occurs here. About 80 (90.91 %) samples and 6 (6.82 %) samples are from arm and 2 (2.27 %) samples are from other sites (pelvis). At the time of initial diagnosis of osteosarcoma, 66 (75 %) samples had no metastasis and 22 (25 %) samples had metastasis.
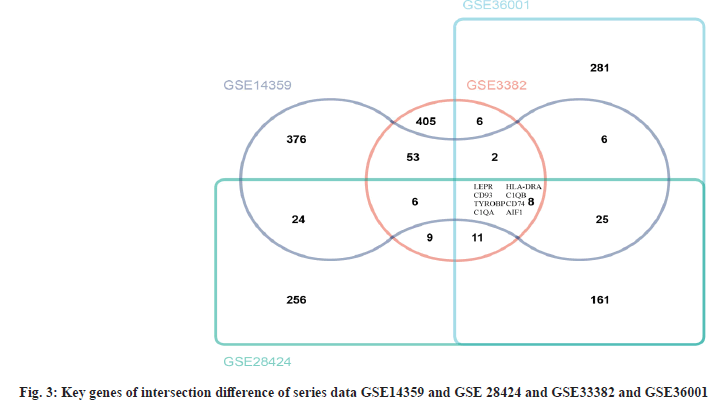
Complement C1qA (C1QA) and Complement C1qB (C1QB) are intersection differential key genes. In series data GSE14359 and GSE 28424 and GSE33382 and GSE36001, we analyzed the differential genes (fig. 2). Then, we took the top 500 genes of each series data according to the differential genes, p value and log FC was used to draw Venn diagram. There are 8 intersecting genes, Leptin Receptor (LEPR), Cluster of Differentiation 93 (CD93), TYRO Protein Tyrosine Kinase Binding Protein (TYROBP), C1QA, Major Histocompatibility Complex, Class II, DR Alpha (HLA-DRA), C1QB, Cluster of Differentiation 74 (CD74) and Allograft Inflammatory Factor 1 (AIF1) are shown in fig. 3. After analysis, we finally determined C1QA and C1QB as the differential key genes of our study.
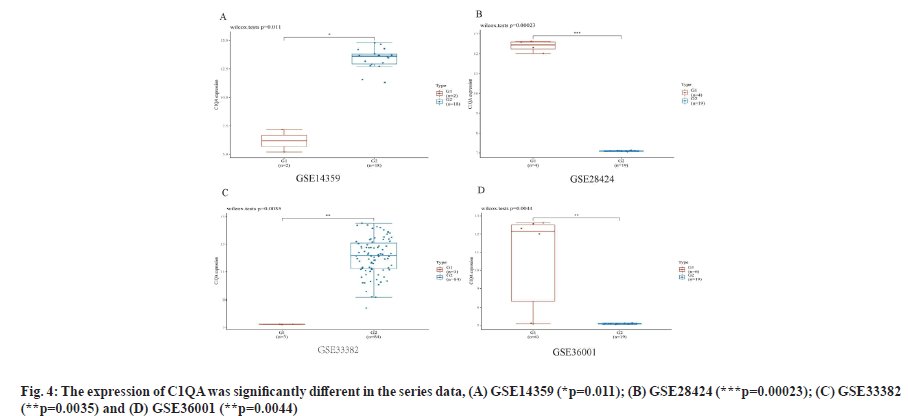
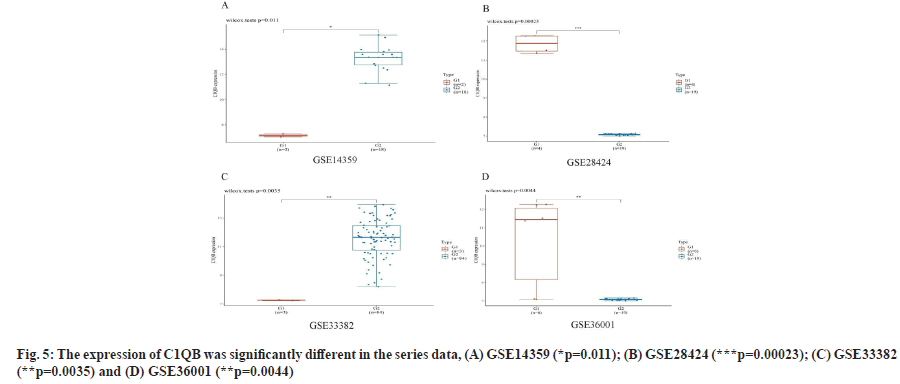
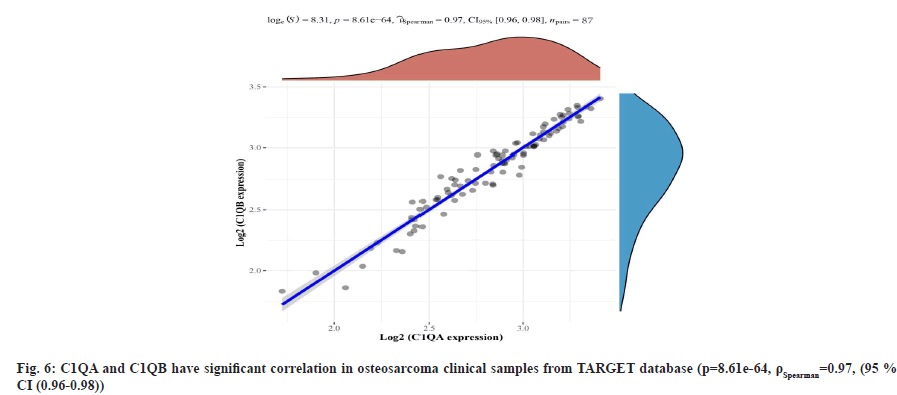
C1QA and C1QB show over-expression in osteosarcoma cell lines as shown in fig. 4 and fig. 5. We found the expression of C1QA and C1QB were significantly different in the series data GSE14359 (p=0.011, fig. 4A and fig. 5A), GSE28424 (p=0.00023, fig. 4B and fig. 5B), GSE33382 (p=0.0035, fig. 4C and fig. 5C), GSE36001 (p=0.0044, fig. 4D and fig. 5D). Meanwhile, C1QA and C1QB have significant correlation in osteosarcoma clinical samples from TARGET database (p=8.61e-64, ρSpearman=0.97, 95 % CI (0.96-0.98), fig. 6).
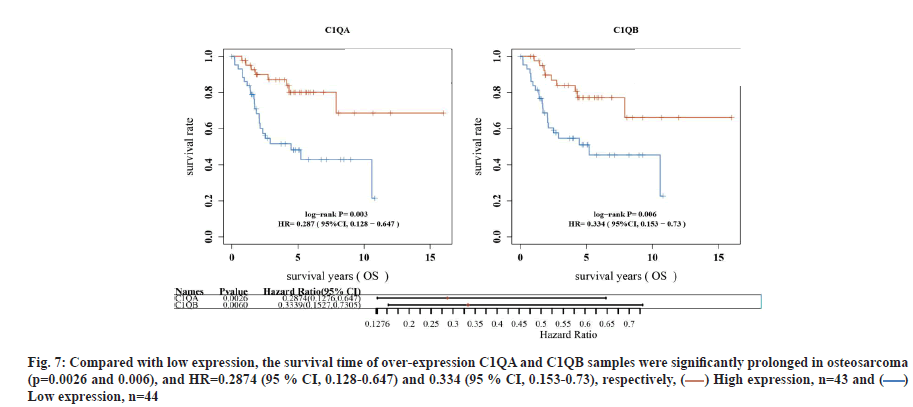
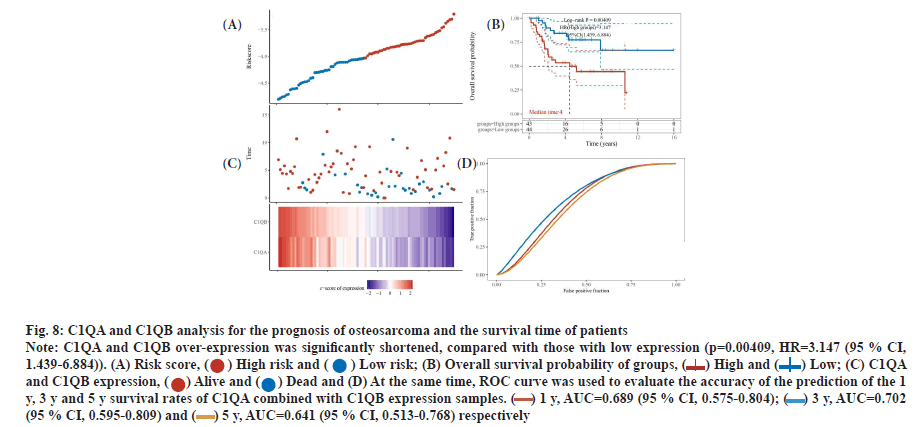
C1QA and C1QB can be used as factors to predict the survival time of osteosarcoma. In TARGET database, compared with low expression, the survival time of over-expression C1QA and C1QB samples was significantly prolonged in osteosarcoma (p=0.0026 and p=0.006), and Hazard Ratio (HR)=0.2874 (95 % Confidence Interval (CI), 0.128-0.647) and 0.334 (95 % CI, 0.153-0.73), respectively (fig. 7). Interestingly, C1QA combined with C1QB analysis for the prognosis of osteosarcoma, the survival time of patients with both C1QA and C1QB over-expression was significantly shortened, compared with those with low expression (p=0.00409, HR=3.147 (95 % CI, 1.439-6.884)). At the same time, ROC curve was used to evaluate the accuracy of the prediction of the 1 y, 3 y and 5 y survival rates of C1QA combined with C1QB expression samples. Area Under the Curve (AUC)=0.689 (95 % CI, 0.575-0.804), 0.702 (95 % CI, 0.595-0.809), 0.641 (95 % CI, 0.513- 0.768), respectively (fig. 8A-fig. 8D).
Fig. 7: Compared with low expression, the survival time of over-expression C1QA and C1QB samples were significantly prolonged in osteosarcoma
(p=0.0026 and 0.006), and HR=0.2874 (95 % CI, 0.128-0.647) and 0.334 (95 % CI, 0.153-0.73), respectively, ( ) High expression, n=43 and (
 )
Low expression, n=44
Fig. 8: C1QA and C1QB analysis for the prognosis of osteosarcoma and the survival time of patients
Note: C1QA and C1QB over-expression was significantly shortened, compared with those with low expression (p=0.00409, HR=3.147 (95 % CI,
1.439-6.884)). (A) Risk score, ( ) High risk and (
 ) Low risk; (B) Overall survival probability of groups, (
 ) High and (
 ) Low; (C) C1QA
and C1QB expression, (
 ) Alive and (
 ) Dead and (D) At the same time, ROC curve was used to evaluate the accuracy of the prediction of the 1
y, 3 y and 5 y survival rates of C1QA combined with C1QB expression samples. (
 ) 1 y, AUC=0.689 (95 % CI, 0.575-0.804); (
 ) 3 y, AUC=0.702
(95 % CI, 0.595-0.809) and (
 ) 5 y, AUC=0.641 (95 % CI, 0.513-0.768) respectively
The prognosis of osteosarcoma is related to many factors, although it has been clearly related to clinical characteristics such as age, sex, metastasis and primary site[12,13]. With the update of chemotherapy, the prognosis of osteosarcoma has been improved. However, the prognosis of patients with chemotherapy resistance and metastasis is still only 30 % [11,14].
In our study, we used mRNA data obtained from differential key genes of C1QA and C1QB in GEO database. C1Q can perform various immune and non-immune tasks in a complement-dependent or complement independent manner[15]. C1Q is the starting molecule of the classical complement pathway, which can recognize immune complexes and start the classical complement pathway. C1Q in many types of cancer microenvironments show overexpression[ 16] and it has anti-tumor effect. Kaur et al. found that C1Q can promote apoptosis in ovarian cancer cells, it is through the upregulation of Tumor Necrosis Factor alpha (TNF-α)-induced apoptosis path by regulating Bcl-2-Associated X protein (BAX) and Fas Cell Surface Death Receptor (FAS)[17]. In the study of breast cancer, C1Q can induce apoptosis and has anti-angiogenic effect. C1Q includes C1QA, C1QB and C1QC[18]. Some studies reported, C1QB is a reliable biomarker in cutaneous melanoma. It can be identified and observed from the treatment outcomes in cutaneous melanoma[19,20].
In this study, we found that the expressions are significantly different in C1QA and C1QB in normal tissues vs. tumor tissues and in non-tumor bone cells vs. cell lines. Meanwhile, the C1QA and C1QB expressions are closely related in clinical samples obtained from TARGET database and then, we analyzed the prognostic correlation between C1QA and C1QB, including the risk factors in OAS sample. The over-expression of C1QA and C1QB are protective factors to significantly prolong the survival time and the risk factors<1. In a study about skin cutaneous melanoma, the researcher found that over-expression levels of C1QA, C1QB and C1QC are protective factors which improve survival time at different stages[21]. The results obtained are consistent with our results. Yang et al.[22] study on pancreatic cancer found that C1QA and C1QB were overexpressed in cancer tissues than in normal pancreatic tissues. They speculated that C1QA and C1QB might be a new predictor of pancreatic cancer disease. Thus, we can conclude that the overexpression levels of C1QA and C1QB are protective factors which improve survival in OAS.
Interestingly, combined analysis of C1QA and C1QB is a high risk factor which mean, the over-expression of C1QA and C1QB in the same time indicates poor prognosis. The cause of this situation is not clear. This may be related to C1Q as a complement and it can active the immune system. Kou et al.[23] through GEO database and the research on Idiopathic Pulmonary Fibrosis (IPF) and non-small cell lung cancer, they found that the prognosis of non-small cell lung cancer and IPF patients with high levels of C1Q is poor. Vidergar et al.[24] reported that C1Q promoted the growth of malignant pleural mesothelioma. Besides, in liver cancer, C1Q promoted migratory and invasive phenotypes[25]. From our results and other tumor research reports, we believe that the high expression of C1Q can promote tumors, but the high expression of C1QA and C1QB components in C1Q plays a protective role. C1QA and C1QB are closely related with OSA. It may be an effective factor to predict the prognosis of OSA.
Funding:
This work was supported by a grant from the Natural Science Foundation of Hunan province (No. 2020JJ6110).
Acknowledgements:
We would like to acknowledge that this study is very grateful to Dr. Yin Tao of Zhuzhou Central Hospital for his guidance.
Conflict of interests:
The authors declared no conflict of interest.
References
- Strauss SJ, Frezza AM, Abecassis N, Bajpai J, Bauer S, Biagini R,et al. Bone sarcomas: ESMO-EURACAN-GENTURIS-ERN PaedCan Clinical Practice Guideline for diagnosis, treatment and follow-up. Ann Oncol 2021;32(12):1520-36.
[Crossref] [Google scholar] [PubMed]
- Gatta G, Capocaccia R, Botta L, Mallone S, de Angelis R, Ardanaz E, et al. Burden and centralised treatment in Europe of rare tumours: Results of RARECAREnet-a population-based study. Lancet Oncol 2017;18(8):1022-39.
[Crossref] [Google scholar] [PubMed]
- de Pinieux G, Karanian M, Le Loarer F, Le Guellec S, Chabaud S, Terrier P, et al. Nationwide incidence of sarcomas and connective tissue tumors of intermediate malignancy over four years using an expert pathology review network. PLoS One 2021;16(2):1-22.
[Crossref] [Google scholar] [PubMed]
- Cho WH, Song WS, Jeon DG, Kong CB, Kim MS, Lee JA, et al. Differential presentations, clinical courses and survivals of osteosarcomas of the proximal humerus over other extremity locations. Ann Surg Oncol 2010;17(3):702-8.
[Crossref] [Google scholar] [PubMed]
- Antonescu CR, Huvos AG. Low-grade osteogenic sarcoma arising in medullary and surface osseous locations. Am J Clin Pathol 2000;114(1):90-103.
[Crossref] [Google scholar] [PubMed]
- Hansen MF, Seton M, Merchant A. Osteosarcoma in Paget's disease of bone. J Bone Miner Res 2006;21(2):58-63.
[Crossref] [Google scholar] [PubMed]
- Rosen G, Murphy ML, Huvos AG, Gutierrez M, Marcove RC. Chemotherapy, en bloc resection and prosthetic bone replacement in the treatment of osteogenic sarcoma. Cancer 1976;37(1):1-11.
[Crossref] [Google scholar] [PubMed]
- Sutow WW. Multidrug chemotherapy in osteosarcoma. Clin Orthop Relat Res 1980;153:67-72.
[Crossref] [Google scholar] [PubMed]
- Goorin AM, Perez-Atayde A, Gebhardt M, Andersen JW, Wilkinson RH, Delorey MJ, et al. Weekly high-dose methotrexate and doxorubicin for osteosarcoma: The Dana-Farber Cancer Institute/the Children's Hospital--study III. J Clin Oncol 1987;5(8):1178-84.
[Crossref] [Google scholar] [PubMed]
- Howlader NN, Noone AM, Krapcho ME, Miller D, Brest A, Yu ME, et al. SEER cancer statistics review, 1975-2016. Bethesda: National Cancer Institute; 2019. p. 1423-37.
- Harrison DJ, Geller DS, Gill JD, Lewis VO, Gorlick R. Current and future therapeutic approaches for osteosarcoma. Expert Rev Anticancer Ther 2018;18(1):39-50.
[Crossref] [Google scholar] [PubMed]
- Iwata S, Ishii T, Kawai A, Hiruma T, Yonemoto T, Kamoda H, et al. Prognostic factors in elderly osteosarcoma patients: A multi-institutional retrospective study of 86 cases. Ann Surg Oncol 2014;21(1):263-8.
[Crossref] [Google scholar] [PubMed]
- Ruggieri P, Calabrò T, Montalti M, Mercuri M. The role of surgery and adjuvants to survival in Pagetic osteosarcoma. Clin Orthop Relat Res 2010;468(11):2962-8.
[Crossref] [Google scholar] [PubMed]
- Stiller CA, Bielack SS, Jundt G, Steliarova-Foucher E. Bone tumours in European children and adolescents, 1978–1997. Report from the Automated Childhood Cancer Information System project. Eur J Cancer 2006;42(13):2124-35.
[Crossref] [Google scholar] [PubMed]
- Kishore U, Thielens NM, Gaboriaud C. State-of-the-art research on C1q and the Classical Complement Pathway. Front Immunol 2016;7:1-3.
[Crossref] [Google scholar] [PubMed]
- Espericueta V, Manughian-Peter AO, Bally I, Thielens NM, Fraser DA. Recombinant C1q variants modulate macrophage responses but do not activate the classical complement pathway. Mol Immunol 2020;117:65-72.
[Crossref] [Google scholar] [PubMed]
- Kaur A, Sultan SH, Murugaiah V, Pathan AA, Alhamlan FS, Karteris E, et al. Human C1q induces apoptosis in an ovarian cancer cell line via tumor necrosis factor pathway. Front Immunol 2016;7:1-3.
[Crossref] [Google scholar] [PubMed]
- Nayak A, Pednekar L, Reid KB, Kishore U. Complement and non-complement activating functions of C1q: A prototypical innate immune molecule. Innate Immun 2012;18(2):350-63.
[Crossref] [Google scholar] [PubMed]
- Borden ES, Adams AC, Buetow KH, Wilson MA, Bauman JE, Curiel-Lewandrowski C, et al. Shared gene expression and immune pathway changes associated with progression from nevi to melanoma. Cancers 2021;14(1):1-21.
[Crossref] [Google scholar] [PubMed]
- Luo Y, Robinson S, Fujita J, Siconolfi L, Magidson J, Edwards CK, et al. Transcriptome profiling of whole blood cells identifies PLEK2 and C1QB in human melanoma. PloS One 2011;6(6):e20971.
[Crossref] [Google scholar] [PubMed]
- Yang H, Che D, Gu Y, Cao D. Prognostic and immune-related value of complement C1Q (C1QA, C1QB and C1QC) in skin cutaneous melanoma. Front Genet 2022;13:1-19.
[Crossref] [Google scholar] [PubMed]
- Yang J, Lin P, Yang M, Liu W, Fu X, Liu D, et al. Integrated genomic and transcriptomic analysis reveals unique characteristics of hepatic metastases and pro-metastatic role of complement C1q in pancreatic ductal adenocarcinoma. Genome Biol 2021;22(1):1-20.
[Crossref] [Google scholar] [PubMed]
- Kou W, Li B, Shi Y, Zhao Y, Yu Q, Zhuang J, et al. High complement protein C1q levels in pulmonary fibrosis and non-small cell lung cancer associated with poor prognosis. BMC Cancer 2022;22(1):1-6.
[Crossref] [Google scholar] [PubMed]
- Vidergar R, Balduit A, Zacchi P, Agostinis C, Mangogna A, Belmonte B, et al. C1q-Ha matrix regulates the local synthesis of hyaluronan in malignant pleural mesothelioma by modulating has3 expression. Cancers 2021;13(3):1-18.
[Crossref] [Google scholar] [PubMed]
- Lee JH, Poudel B, Ki HH, Nepali S, Lee YM, Shin JS, et al. Complement C1q stimulates the progression of hepatocellular tumor through the activation of discoidin domain receptor 1. Sci Rep 2018;8(1):1-11.
[Crossref] [Google scholar] [PubMed]
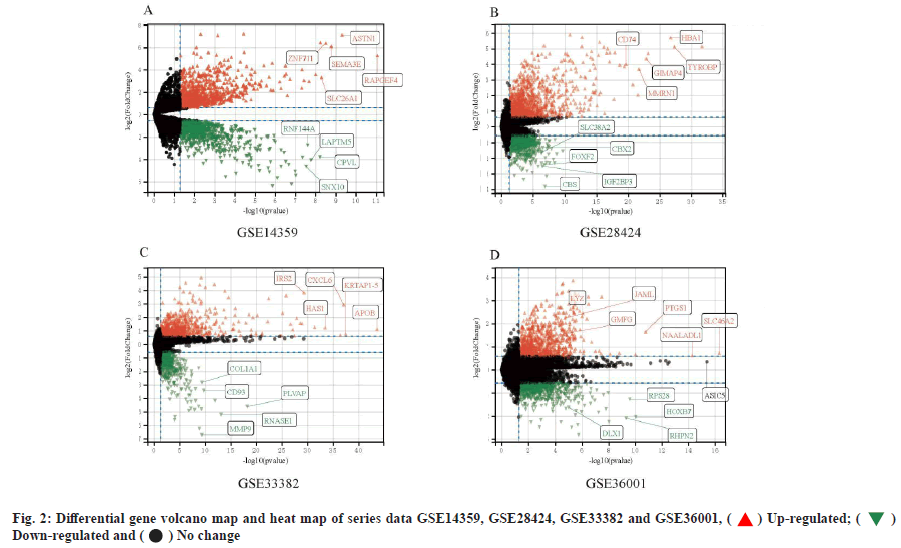
 ) Up-regulated; (
 )
Down-regulated and (
 ) No change