- Corresponding Author:
- Talegaonkar
Department of Pharmaceutics, Faculty of Pharmacy, Jamia Hamdrd, Handard Nagar, New Delhi–110 062, India
E–mail: stalegaonkar@gmail.com
| Date of Submission | 24 November 2013 |
| Date of Revision | 17 October 2014 |
| Date of Acceptance | 01 January 2015 |
| Indian J Pharm Sci 2015;77(1):14-23 |
Abstract
The present work is aimed to develop a simple, sensitive, robust and reliable HPLC method for the estimation of irinotecan in the physiological media in order to assess the permeability profile of irinotecan, using the everted gut sac, in the presence of various P-gp modulators. Separation was achieved using, C18 column with mobile phase consisting of acetonitrile and 0.045 µM sodium dihydrogen phosphate dihydrate buffer containing ion pair agent heptane sulphonic acid sodium salt (0.0054 µM), pH 3. The flow rate was maintained at 1 ml/min and analysis was performed at 254.9 nm using PDA detector. Calibration data showed an excellent linear relationship between peak-area verses drug concentration (r 2 , 0.9999). Linearity was found to be in the range of 0.060-10.0 µg/ml. Limits of detection and quantification were found to ~0.020 µg/ml and ~0.060 µg/ml, respectively. The developed method was found to be precise (RSD < 1.5%, for repeatability and <2.55% for intermediate precision, acceptable ranges of precision), accurate (The recovered content of irinotecan in the presence of various P-gp modulators varied from 96.11-101.51%, within acceptable range, 80-120%), specific and robust (% RSD < 2). Developed method has been applied successfully for the evaluation of eleven P-gp modulators from diverse chemical class.
Keywords
HPLC, irinotecan, P−gp modulators, everted gut sac, oral bioavailability enhancement
Irinotecan, (IRT, CPT−11) is a topoisomerase I inhibitor. It is a FDA approved drug for the treatment of colorectal and small cell lung cancer. It inhibits DNA−topoisomerase−I and stabilizes the complexes formed during DNA replication resulting in cell death[1]. IRT itself is a prodrug and converts into an active metabolite (7−ethyl−10−hydroxycamptothecin, SN−38) via enzyme (carboxylesterases)−induced hydrolysis[2]. Both these molecules simultaneously exist into two forms viz., the active lactone form and an inactive carboxylate form which does not impart any topoisomerase I inhibitory activity[3]. At lower pH, lactone form exist predominantly, opposite to it carboxylate form exist exclusively at pH above 8[4]. CPT−11 and SN−38 undergo excretion to the gut (ex−sorption) by the action of drug efflux transporters like P−glycoprotein (P−gp)[5]. SN−38 is also excreted to intestine via hepatobilliary excretory route in the form of SN−38−glucuronide after undergoing glucuronidation[6,7] where it reconverts into SN−38 via hydrolytic reaction induced by enterobacterial β−glucuronidase. P−glycoprotein is one of the drug efflux transporters which plays a major role in the disposition of both CPT−11 and SN−38[8] and is also responsible for low (20−30%) and erratic oral bioavailability of IRT[1]. Hence, modulation of this intestinal efflux pump would be an effective approach to enhance oral bioavailability and improve toxicity profile of IRT. Numerous efforts have been made in the search of suitable P−gp−inhibitors for clinical use. Unfortunately, the concomitant use of first−generation or second−generation P−gp inhibitors and anticancer drugs had been a disappointment either due to their poor modulatory activity, high toxicity or unpredictable pharmacokinetic interactions[9]. Recently, some commonly used pharmaceutical excipients like polymers, surfactants, solvents and flavonoids have shown potential to inhibit the function of P−gp in the intestine. These additives offer advantage of being safe and pharmaceutically acceptable[9,10]. These findings revealed a new area of research for oral chemotherapeutics especially to surmount P−gp−mediated MDR by employing pharmaceutical excipients having P−gp modulation activity. Novel drug delivery systems such as microparticles, noisome, liposome, SLN or nanoparticles themselves inherently possess P−gp escaping property. Hence, here along with such excipients could further enhance the efficacy of chemotherapy[11,12].
Our research team is working on the development of various nano−structured formulations by using excipients having P-gp modulation property. Hence, we have screened various excipients including oil, surfactants, polymer and flavonoids for their P−gp modulation efficiency by everted gut sac technique. In addition, Self-emulsifying drug delivery (SEDD) formulations have been developed using such excipients and in vivo studies shown encouraging results (data not shown).
A suitable analytical method was a prerequisite to quantify IRT in the presence of various excipients. In this perspective, a simple, sensitive, isocratic HPLC method with UV detection was developed in the Tyrode’s solution, the commonly used physiological media for conducting the in vitro studies associated with intestinal tissues. However, various HPLC methods have been reported for determination of IRT, some of them coupled with expensive equipments such as LC−MS or fluorescence detectors[13−15]. Gradient−programmed HPLC method coupled with UV−detector was also reported but with a drawback of long run time of 35 min[1]. Furthermore, HPLC−UV analytical methods with lower run time were also reported[3,16]. However, these methods were not validated for their accuracy/recovery with wide range of excipients as per our review of literature. Hence, a suitable analytical method was developed. In addition, the developed method has been validated for its accuracy/recovery in the presence of wide range of formulation excipients.
Materials and Methods
IRT was provided ex−gratia by Fresenius Kabi Private Limited, India. Verapamil hydrochloride was procured from Nimbus Fine Chemicals, Mumbai, India. DMSO (AR grade), acetonitrile (HPLC grade), o−phosphoric acid (HPLC Grade), sodium chloride (NaCl), anhydrous magnesium chloride (MgCl2), Span 80, Tween 20, anhydrous calcium chloride (CaCl2), potassium chloride (KCl), sodium bicarbonate (NaHCO3) and sodium dihydrogen phosphate dihydrate (NaH2PO4.2H2O) were purchased from S. D. Fine−Chem, Mumbai, India. Glucose and PEG 400 were obtained from Thomas Baker, India. Plutonics 188, 121 and cremophor EL were obtained ex gratia from BASF Mumbai, India. Acconon 400 and Transcutol were gifted by Abitec Corporation Limited, USA and Gattefosse, Gennevilliers, France, respectively. Quercetin, hesperetin, and naringenin were acquired from Sigma Aldrich, USA. Water was obtained from Milli−Q water purification system (Millipore, MA, USA).
Composition of Tyrode’s solution
The Tyrode’s solution consisted of 137 mM NaCl, 3 mM KCl, 2 mM CaCl2, 2 mM MgCl2, 12 mM NaHCO3, 0.4 mM NaH2PO4, and 6 mM D−glucose[17]. IRT hydrolyses with higher speed at or above pH 7.4, hence, pH of perfusion media was adjusted to 6 with orthophosphoric acid and all the studies were performed at this pH[18].
Preparation of stock and standard Solution
Stock solution of IRT (1000 μg/ml) was prepared in DMSO by dissolving 10 mg in 10 ml and stored at −20°. Standard calibration solutions were prepared in the range of 0.01−10 μg/ml everyday by serial dilution with Tyrode’s solution. Similarly, quality control (QC) samples of IRT at three different levels were independently prepared at three different concentration level, low QC (LQC, 100 ng/ml), medium QC (MQC, 1000 ng/ml) and high QC (HQC, 5000 ng/ml).
Instrument and liquid chromatographic conditions
The liquid chromatographic system e2695 separation module (Waters Alliance, Milford, MA, USA) equipped with a gradient flow control pump, online solvent degasser, autosampler, PDA detector 2998, column manager and precolumn heater was used for the analysis. All the parameters of HPLC were controlled by LC solutions software Empower 2.
Chromatographic separations were obtained by using Supelco C−18, RP column (5 μm, 250×4.6 mm) column, which was maintained at 25°. Twenty microlitre of samples were injected into HPLC system. The mobile phase consisted of 0.045 μM NaH2PO4.2H2O buffer containing ion pair agent heptane sulphonic acid sodium salt 0.0054 μM, pH 3 and acetonitrile. Buffer and acetonitrile were used in the ratio of 72:28 v/v and flow rate was kept at 1.0 ml/min. Before running into the LC system, mobile phase was filtered through 0.45 μm filter (Sartorius, Germany) and deaerated for 15 min by sonication and column was initially equilibrated with mobile phase for 20 min. The samples analysis was conducted at a wavelength of 254.9 nm with a total run time of 12 min. Data acquisition and data handling were performed by Empower Software v2.0. The developed LC method was validated for specificity, sensitivity, linearity, precision, accuracy and robustness according to the ICH guidelines[19].
Specificity
Specificity of the method was determined by comparing the chromatograms of drug with the chromatogram obtained from blank Tyrode’s solution and Tyrode’s solution collected after perfusion of intestinal segment for 2 h. To check the specificity of method six samples of each was injected and the obtained chromatograms were compared to identify any possible interference i.e. any overlapping of peaks obtained from blank Tyrode’s solution, intestinal perfusate and drug or any change in RT due to the Tyrode’s constituent or any endogenous components of intestinal segment.
Linearity
Linearity was investigated by 8 point calibration curve constructed in parallel of six replicates of each analyte. The mean peak area of IRT was plotted against its concentration and regression analysis was performed.
Limit of detection and Limit of quantification
Limit of detection (LOD) and limit of quantification (LOQ) in Tyrode’s solution were determined based on the signal−to−noise ratios using analytical responses of three and ten times of the background noise, respectively[20].
Precision
Precision of the methods was determined in term of repeatability and intermediate precision. Repeatability (intra−assay precision) of method was assessed by assaying 18 independent subsamples (3 concentration and 6 replicates) covering the specified range for the developed method (100, 1000, 5000 ng/ ml). It was determined on the identical test material using identical analytical method under similar experimental conditions over the short period of time followed by testing of results by the identical evaluation method. Intra−assay precision of the developed method was expressed as relative standard deviation (RSD, %).
Intermediate precision (Intra−laboratory precision) of the developed method was determined by assaying 18 independent subsamples (3 concentration and 6 replicates) covering the specified range for the developed method (100, 1000, 5000 ng/ml). It was determined on the identical test material using developed analytical method but on different days by different analyst followed by testing of results by the evaluation method Intra−laboratory precision of the developed method was expressed as relative standard deviation (RSD, %).
Accuracy
Accuracy of the developed method was assessed in term of percentage recovery (%). To determine the accuracy of method, blank Tyrode’s solution was spiked with 3 levels (Low, medium and high, 100, 1000 and 5000 ng/ml, respectively) of quality control samples in the presence of highest level of P−gp modulator. Samples were prepared as per the developed method. Percent recovery was calculated using Eqn. 1, % recovery = (experimental concentration/theoretical concentration)×100.
Robustness
It is an indicator of stability of methods and represents its capacity to remain unaffected by little but intentional changes in the method conditions. Robustness was studied in six replicates at 2500 ng/ml by making small changes in the pH of mobile phase and using two different columns from two different manufacturers. The effects on the results were examined by RSD (%) with respect to peak areas and RT.
Stability studies
Stability studies were performed in quality control samples to assess the stability of analyte in the Tyrode’s solution, keeping our experimental condition in consideration. Experiments were performed to establish on−bench stability (25±2°, after 6 h), freeze thaw stability (3 cycles) and short−term stability at −20° for 30 days[16].
Screening of excipients for P−gp modulation activity using everted gut sac method
Male Wistar rats, weighing 200±50 g, were obtained from the Central Animal House, Jamia Hamdard (New Delhi, India). The animal study protocol was reviewed and approved by the institutional animal ethics committee of Jamia Hamdard (Approval No. 436, 2012). The animals were kept under standard laboratory conditions (temperature 25±2° and relative humidity 55±5%) and were housed in polypropylene cages with free access to standard laboratory diet (Lipton Feed, Mumbai, India) and water ad libitum.
Permeation through everted gut sac was carried out as discribed in a previous report with some modification[21]. Animals were starved for 12 h with free access to water ad libitum before each experiment. The animals were sacrificed by cervical dislocation under ether anesthesia, the ileum was excised from the rat and rinsed in ice−cold saline. Ileum was slid onto a glass rod to evert the sac to expose the epithelial surface. One end of each everted segments were ligated with a thread and the other end was mounted on the sampling port of an in−house developed assembly. Sacs of each segment were filled with 2 ml of Tyrode’s solution and incubated in prewarmed (37±0.5°) and preoxygenated (with O2/ CO2, 95:5) Tyrode’s buffer for 30 min for stabilization followed by incubation in 60 ml of Tyrode’s buffer containing IRT (50 μg/ml). To determine the mucosal to serosal transport, samples were collected at different time intervals of 15, 30, 45, 60 min. All the samples were analyzed by the developed HPLC method. Similar procedure was followed in the presence of different P−gp modulator. The P−gp modulators which have been included in the study are surfactants such as cremophor EL, PEG 400, Acconon 400, plutonic 188, pluronic 121, Span 80, Transcutol, Tween 80 and flavonoids like quercetin, hesperetin, naringenin. Verapamil (200 μM) has been used as a standard P−gp modulator. All the excipients were used in three different concentrations/strengths. The surfactants were used in the strength of 0.1, 0.5 and 1% while the strength of flavonoids was kept at 20, 50 and 100 μM.
Data analysis and statistics
The cumulative amount of permeated drug through unit surface area of intestine (Qt) was calculated using Eqn. 2, followed by flux determination using Eqn. 3, subsequently, permeability coefficient was determined using Eqn. 4., 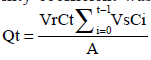 Eqn.2,
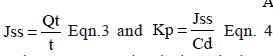 where Ct is the drug concentration in intestinal segment at each sampling time, Ci the drug concentration of the ith sample, and Vr and Vs are the Tyrode’s volumes in the intestinal lumen and the volume of collected samples, respectively, A represents the exposed surface area and Cd is the concentration of the drug in incubation media.
The enhancement ratio (ER) was also calculated usingS following Eqn. 5:
ER = Flux of IRT across the ileum in the presence of Pgp modulators/ Flux of IRT across the ileum in the absence of Pgp modulators Eqn. 5.
Data was expressed as mean±SD and compared by applying a one−way ANOVA followed by Tukey’s Kramer all pairs of column test and P<0.05 was considered as the level of significance.
Results
Method development and validation
The best shape and symmetry of peak with high resolution at RT 8.75±0.15 was achieved with mobile phase consisting of 0.045 μM NaH2PO4.2H2O buffer containing ion pair agent heptane sulphonic acid sodium salt 0.0054 μM, pH 3 and acetonitrile, 72:28 (v/v) at the flow rate of 1 ml/min. Three absorption maxima at 220.6 nm, 254.9nm and 358.3 nm were observed for IRT (Fig. 1a). Furthermore, significant UV absorbance at 254.9 nm was observed, hence, it was chosen for the detection.
Specificity
It was evaluated by comparing representative chromatogram of drug with chromatograms of blank Tyrode’s solution and blank intestinal perfusate. figs. 1b−d shows the representative chromatograms of a blank Tyrode’s solution, blank intestinal perfusate and IRT, respectively. Retention time of IRT was found to be 8.75 min and no interference was observed i.e. any change in retention time of IRT and no peak overlapping was observed either with Tyrode’s solution or endogenous constituents of intestinal perfusate, which demonstrates method’s specificity.
Linearity
The linear regression data for the calibration curves showed a good linear relationship over the concentration range of 0.060−10.0 μg/ml with r2, 0.9999. Different linear regression data are shown in Table 1.
Limit of detection and limit of quantification
The LOD and LOQ for IRT in different pharmaceutical formulation have been reported in the range of 4−80 ng/ml and 10−260 ng/ml, respectively[3,22−25]. The LOD and LOQ of this method were found to be 20 ng/ml and 60 ng/ml, respectively.
Precision
The precision of method was determined at two levels i.e. repeatability and intermediate precision. Repeatability was assessed by using 18 determinants (3 concentrations level and for 6 replicates of each level). Chromatograms for the respective concentrations were evaluated and statistically analyzed. The % RSD with respect to repeatability was found to be in the range of 0.84−0.95 (Table 2). The acceptable range for the repeatability is ≤1.5%. Similarly, intermediate precision was assessed by using 18 determinants (3 concentrations level and for 6 replicates of each level). Chromatograms for the respective concentrations were evaluated and statistically analyzed. % RSD with respect to intermediate precision was found to be in the range of 1.47−1.74 (Table 2). The acceptable range for intermediate precision is 1.3−1.7* acceptable RSD of repeatability, 1.5[19]. Low values of % RSD for both repeatability and intermediate precision suggest a good precision of the developed method.

Figure 1:UV spectrum of irinotecan and chromatograms from everted gut sac experiments; A. UV Spectra of irinotecan; B. Chromatogram of blank Tyrode’s solution; C. Chromatogram of intestinal perfusate in Tyrode’s solution; D. Representative chromatogram of irinotecan.
| Parameters | Regression values |
|---|---|
| Linearity range (µg/ml) | 0.060-10 µg/ml |
| Regression equation | Y=32.58 X -155.58 |
| Correlation coefficient (r2) | 0.9999 |
| Slope±SD | 32.58±0.35 |
| Confidence limit of slope | 32.23-32.97 |
| Intercept±SD | 155.58±2.23 |
| Confidence limit of intercept | 152.62-157.30 |
| SD: Standard deviation |
Table 1: Linear regression data for calibration plots (n=6)
Accuracy
Developed method was assessed for its accuracy in term of % recovery after spiking three different concentrations of quality control samples. Table 3 summarizes the recovery data, it was found to be in the range of 96.11−101.51% and difference between the measured value and true value was found to be in the range of 1.51−3.89% (both positive and negative difference). Acceptable range for recovery is 80−120%[19]. Recovery studies suggested the high accuracy of developed method.
Robustness
Robustness of method was evaluated by deliberate changes in pH of mobile phase and using two different columns from two different manufacturers. Parameters like % assay and RT were analyzed and no substantial variation in result was observed retention upon varying the pH (3±0.3) of mobile phase and column (Supelco C18 and Purosphere C18). The developed method was found to be robust, % RSD was less than 2 (Table 4).
Stability studies
Stability studies for IRT were performed in quality control samples and it was found to be stable at bench top conditions (drug in Tyrode’s solution kept for 6 h at room temperature, 25±2°) as well as freezing and thawing condition, three cycles of freezing (at − 20°) and thawing (at room temperature). Samples were also found be stable stored at − 20° for at least 30 days. Stability results are summarized in Table 5.
| Conc. | RSD (%) | ||
|---|---|---|---|
| (ng/ml) | Repeatability | Intermediate precision | |
| (Intra assay precision) | (Intra laboratory precision) | ||
| 100 | 0.924 | 1.47 | |
| 1000 | 0.84 | 1.74 | |
| 5000 | 0.95 | 1.49 | |
Table 2:Precision of the method (n=6).
| Excipients | Amount | Mean % | % RSD |
|---|---|---|---|
| added (ng) | Recovered | ||
| Cremophore EL (1%) | 100 | 96.78±2.43 | 2.50 |
| 1000 | 97.65±2.37 | 2.35 | |
| 5000 | 99.02±1.40 | 1.43 | |
| PEG 400 (1%) | 100 | 100.77±1.82 | 1.81 |
| 1000 | 100.92±2.01 | 1.99 | |
| 5000 | 100.72±0.72 | 0.71 | |
| Acconum 400 (1%) | 100 | 96.11±2.61 | 2.72 |
| 1000 | 97.73±1.92 | 1.97 | |
| 5000 | 98.63±1.75 | 1.77 | |
| Pluronics 188 (1%) | 100 | 98.13±2.75 | 2.78 |
| 1000 | 101.51±1.61 | 1.58 | |
| 5000 | 100.72±1.26 | 1.26 | |
| Pluronics 121 (1%) | 100 | 97.68±2.56 | 2.62 |
| 1000 | 97.30±2.18 | 2.24 | |
| 5000 | 98.54±1.52 | 1.54 | |
| Span 80 (1%) | 100 | 97.00±0.92 | 0.95 |
| 1000 | 98.40±1.15 | 1.17 | |
| 5000 | 98.59±1.57 | 1.59 | |
| Tween 80 (1%) | 100 | 98.20±2.367 | 2.41 |
| 1000 | 100.69±2.04 | 2.03 | |
| 5000 | 100.53±1.59 | 1.58 | |
| Quercetin (100 µM) | 100 | 99.34±1.26 | 1.27 |
| 1000 | 100.06±1.8 | 1.80 | |
| 5000 | 100.11±1.76 | 1.76 | |
| Hesperetin (100 µM) | 100 | 99.39±2.06 | 2.08 |
| 1000 | 100.49±1.93 | 1.92 | |
| 5000 | 100.23±1.35 | 1.35 | |
| Naringenin (100 µM) | 100 | 100.11±1.69 | 1.69 |
| 1000 | 100.69±1.79 | 1.78 | |
| 5000 | 100.26±1.37 | 1.36 | |
| Verapamil (100µM) | 100 | 99.34±1.72 | 1.74 |
| 1000 | 100.55±1.70 | 1.69 | |
| 5000 | 100.77±1.25 | 1.24 |
Table 3: Accuracy of method (n=3)
| Parameters | % Assay | % RSD | RT value | % RSD |
|---|---|---|---|---|
| pH of mobile phase | ||||
| (3.0±0.1) | ||||
| 2.7 | 99.95±1.06 | 1.06 | 8.745±0.122 | 1.40 |
| 3.0 | 100.24±0.78 | 0.78 | 8.750±0.098 | 1.12 |
| 3.3 | 99.9±0.60 | 0.60 | 8.771±0.118 | 1.35 |
| Column | ||||
| Supelco C18 | 100.24±0.78 | 0.78 | 8.760±0.112 | 1.19 |
| Purosphere C18 | 100.54±0.795 | 0.79 | 8.812±0.105 | 1.28 |
Table 4: Robustness studies.
| IRT | Bench top | 3 freeze thaw | Stored at -20° for | |||
|---|---|---|---|---|---|---|
| Conc. | stability for 6 h | cycle | 30 days | |||
| (ng/ml) | % Recovered % RSD | % Recovered % RSD | % Recovered % RSD | |||
| 100 | 98.32±1.24 | 1.26 | 96.06±0.51 | 0.53 | 95.76±0.74 | 0.77 |
| 1000 | 99.39±0.88 | 0.88 | 96.90±0.73 | 0.75 | 96.29±0.73 | 0.75 |
| 5000 | 99.19±0.56 | 0.57 | 97.98±0.40 | 0.41 | 97.73±0.51 | 0.52 |
Table 5: Stability studies (n=3)
| Excipients | Excipients | Flux | Permeability coefficient |
|---|---|---|---|
| Conc. | (J=µg/cm2/h | (x 10-3cm/h) | |
| Control | - | 0.362±0.049 | 7.24 |
| Verapamil | 100 µM | 0.823±0.091 | 16.4 |
| Cremphore EL | 0.1% | 0.813±0.098 | 16.26 |
| 0.5% | 0.951±0.132 | 19.02 | |
| 1.0% | 1.05±0.162 | 21.07 | |
| Tween 80 | 0.1% | 0.74±0.098 | 14.8 |
| 0.5% | 0.902±0.11 | 18.0 | |
| 1.0% | 0.841±0.107 | 16.8 | |
| Span 20 | 0.1% | 0.44±0.064 | 8.73 |
| 0.5% | 0.488±0.053 | 9.8 | |
| 1.0% | 0.552±0.067 | 11.05 | |
| Pluronics 188 | 0.1% | 0.47±0.071 | 9.4 |
| 0.5% | 0.595±0.109 | 11.9 | |
| 1.0% | 0.688±0.12 | 13.76 | |
| Pluronics 121 | 0.1% | 0.42±0.056 | 8.35 |
| 0.5% | 0.466±0.049 | 9.33 | |
| 1.0% | 0.56±0.062 | 11.17 | |
| PEG 400 | 0.1% | 0.86±0.128 | 17.22 |
| 0.5% | 1.11±0.17 | 22.22 | |
| 1.0% | 1.00±0.14 | 20.06 | |
| Acconon 400 | 0.1% | 0.44±0.017 | 8.8 |
| 0.5% | 0.487±0.065 | 9.7 | |
| 1.0% | 0.546±0.079 | 10.85 | |
| Quercetin | 20 µM | 0.64±0.082 | 12.8 |
| 50 µM | 0.76±0.093 | 15.14 | |
| 100µM | 0.79±0.084 | 15.83 | |
| Naringenin | 20µM | 0.483±0.058 | 9.6 |
| 50µM | 0.534±0.068 | 10.67 | |
| 100µM | 0.644±0.082 | 12.89 | |
| Hesperetin | 20µM | 0.59±0.066 | 11.76 |
| 50µM | 0.673±0.079 | 13.45 | |
| 100µM | 0.73±0.081 | 14.61 |
Table 6: Intestinal permeability study data(n=3).
Screening of excipients for P−gp modulation activity using everted gut sac method
Permeability study data (apical to basal) of different P−gp modulators have shown the concentration dependent variation in their activity (Table 6). Cremophor EL, Span 20, pluronic 188, pluronic 121, Acconon 400, quercetin, naringenin and hesperetin all showed greater transport across intestine at higher concentration (1%). However, Tween 80 and PEG 400 showed highest activity at medium concentration, 0.5%. In majority of cases, higher transport was observed at all the used concentrations of excipients in comparison to control (P<0.05). Similarly, marked variation was observed when comparison was made between verapamil (standard P−gp modulator) and different pharmaceutical excipients. Tween 80 showed significantly higher transport (J, 0.902±0.11 μg/cm2/h, P<0.05) than verapamil (J, 0.823±0.091 μg/cm2/h) only at 0.5% concentration, while PEG 400 showed significantly higher transport (P<0.05) at 0.5% (J, 1.11±0.17 μg/cm2/h) as well as at 1.0% concentration (J, 1.0±0.14 μg/cm2/h). Similarly, cremophor EL also showed higher transport at 0.5% (P<0.01, J, 0.951±0.13 μg/cm2/h) and 1% (P<0.001, J, 1.05±0.16 μg/cm2/h) while rest of the P−gp modulators like Span 20, pluronic 188, pluronic 121, Acconon 400, quercetin (20 μM), naringenin and hesperetin (20 and 50 μM) showed significantly lower uptake in comparison to verapamil P<0.05. Absorption enhancement ratio of different modulators at different concentration has been depicted in the fig. 2. Absorption enhancement ratio for PEG 400, Tween 80, and cremophor El were found to be 2.9±0.229, 2.3±0.181, and 2.68±0.15 fold higher than control, respectively while in case of verapamil it was found to be 2.1±0.097 fold. The absorption enhancement ratio for rest of excipients was observed higher than control but lesser than verapamil. Therefore, it can be concluded that PEG 400, Tween 80, and cremophor El could be a better substitute of verapamil.
Discussion
IRT is an ionisable compound, hence, it was expected that best separation can be obtained with mobile phases of pH less than 4.0. Initially, method development was started with acetonitrile and water as mobile phase using C18 column (5 μm, 250×4.6 mm) and flow rate of 1 ml/min resulting in a broad peak. Subsequently, sodium dihydrogen phosphate buffer was added in the mobile phase and pH was adjusted to 3 with o−phosphoric acid resulting in early elution of IRT HCl. However, at high buffer content peak tailing and poor resolution was observed which was further improved by optimizing the buffer content in the mobile phase and incorporation of ion pairing agent sodium salt of heptane sulphonic acid resulting into the peak of best shape and symmetry with high resolution due to formation of ion pair with charged analytes consequently improved retention. Optimized mobile phase consisting of 0.045 μM NaH2PO4.2H2O buffer containing ion pair agent heptane sulphonic acid sodium salt 0.0054 μM, pH 3 and acetonitrile, 72:28 (v/v) at the flow rate of 1 ml/min. Absorption maxima at 254.9 nm demonstrated significant UV absorbance hence, it was chosen for the detection.
Specificity is the ability to assess unequivocally the analyte in the presence of components, which may be expected to be present, typically these might include impurities, degradants and matrix[19]. The developed method was found to be able to separate the peaks of IRT from Tyrode’s and perfusion media and no change in retention time of IRT and no peak overlapping either with Tyrode’s solution or endogenous constituents of intestinal perfusate was observed which demonstrates method’s specificity. The linearity of an analytical method is its capability (within a given range) to achieve test results which are directly proportional to the concentration (amount) of analyte in the sample. The linear regression data over the concentration range of 0.060−10.0 μg/ml did not show significant difference in the regression values of standard curves (ANOVA, P>0.05) and linearity was found to be 0.999. Limits of detection and quantification (LOD and LOQ) reflect the sensitivity of the method. LOD is the lowest amount of analyte which can be detected but not essentially quantified exactly, while LOQ is the lowest quantity of analyte, which can be quantitatively analyzed with suitable precision and accuracy. Low values of LOD and LOQ reflect that the developed method is sensitive[19]. Above discussed data reflects that the developed method is specific.

Figure 2:Absorption enhancement of IRT determined by everted gut sac experiments in the presence of varying concentrations of P-gp modulators.
Results of any analytical method are influenced by two types of experimental errors called random and systematic error. Random errors are connected with the precision of the methods. Precision of methods reflects the combination of errors which occurs in every step of analysis, from sampling to evaluation and calculation. Therefore, the ICH Guideline Q2A (R2) suggests the precision determination at three levels including repeatability (1st level), intermediate precision (2nd level) and reproducibility (3rd level). We assess the precision in terms of repeatability and intermediate precision by varying the condition i.e. by assessing method on the same day over a short period of time and on different days, by different analysts and with some changes in equipment part with the intention to expose the method for maximum random errors. % RSD with respect to repeatability and intermediate precision was found to within acceptable range. Similarly, systematic error or bias was evaluated in term of accuracy which is the difference of the measured mean value from the “true” value. Results of accuracy studies were obtained within acceptable range[19]. In addition, method was also evaluated for its robustness, to measure its capacity to remain unaltered by little but intentional variations in method parameters. The method was subjected to change in pH of mobile phase and column manufacturer, no substantial change in retention time and assay was observed which offers an indication of its consistency during normal usage. From the above discussion it can be inferred that the method is precise, accurate and robust.
Recently, various studies have been reported that several common pharmaceutical excipients can modulate the activity of the efflux transporter (P−gp) and possibly other transporters also which in turn lead to enhancement of bioavailability. Such pharmaceutical excipients are being evaluated for their possible potential for the enhancement of oral bioavailability. In our study, we included some synthetic, semisynthetic surfactants and natural flavonoids to evaluate their impact on the permeability parameters of IRT. For this purpose, we have used everted gut sac method as this method had already been successfully used to study the effect of P−gp modulator on drug absorption[26−28]. In addition, a better prediction of human absorption can be established from in situ intestinal perfusion model rather than the cell−based assays[29].
In our study, wide difference in activity of P−gp modulators and pattern of absorption enhancement was observed. However, it is corroborating with previous studies. Various studies reported P−gp modulatory effect of PEG 400 on the transport of the P−gp substrate drugs like paclitaxel and doxorubicin across Caco−2 cells at the concentration range of 2.5 to 20%[30−32]. At the same time, Rege et al. reported no effect of PEG 400 on the transport of cimetidine and furosemide across the Caco2 cell line at 1.5%[33]. In addition, Cornaire et al. reported a very diverse activity pattern of same excipients on different drugs[34], at concentration of 0.5% w/v, the activity of different excipients on digoxin was found to be in the following order Acconon E>Cremophor EL>Polysorbate 20>Polysorbate 80. Surprisingly, in the same study, Cremophor EL and Acconon E, which increased 3 and 4 folds digoxin transport, had no significant effect on celiprolol transport. Li et al. reported the highest activity of PEG 400 and lowest for Tween 80 against ganciclovir in the following order PEG 400>Cremophor EL>luronic 188>Tween 80[35]. Furthermore, some researcher established a correlation between HLB and drug efflux inhibition and demonstrated that surfactants with HLB value, range 10−17 was optimal for inhibiting the efflux of drugs and enhancing transport[36,37]. From the results of aforementioned studies it can be concluded that the mechanisms of action of the excipients/ surfactants on efflux transport are undoubtedly complex and may be multiple which might be due to their different affinity to P−gp, mechanism of transport of drugs, surfactants/excipients induced fluidization/rigidization of lipid bilayers, different effect on different transporter, and activity on the multiple transporters.
The HPLC UV analytical method was successfully developed for the determination of IRT in Tyrode’s solution and validated in accordance to ICH guidelines. The developed method was found to be simple, sensitive, specific, precise, accurate and robust. LOD and LOQ of method were found to be 20 ng/ml and 60 ng/ml, respectively. Recovery studies suggested that the reported method can be used for the analysis of IRT in the presence of various excipients (P−gp modulators) verapamil, Tween 80, Span 20, pluronics, Acconon, PEG 400, cremophor EL, quercetin, naringenin, and hesperetin. The developed method was successfully exploited to study the effect of different P−gp modulators on the permeability parameters of IRT. The results of intestinal permeability studies revealed the potential application of Tween 80, PEG 400 and cremophor EL for the oral bioavailability enhancement of IRT.
References
- drugs based on P-glycoprotein modulation. Drug Discov Today 2009;14:1067-74.
- Werle M, Hoffer M. Glutathione and thiolated chitosan inhibit multidrug resistance P-glycoprotein activity in excised small intestine. J Control Release 2006;111:41-6.
- Wong HL, Bendayan R, Rauth AM, Wu XY. Development of solid lipid nanoparticles containing ionicallycomplexed chemotherapeutic drugs and hemosensitizers. J Pharm Sci 2004;93:1993-2008.
- Dharmala K, Yoo JW, Lee CH. Development of chitosan SLN microparticles for chemotherapy: In vitro approach through efflux-transporter modulation. J Control Release 2008;131:190-7.
- Sai K, Kaniwa N, Ozawa S, Sawada J. An analytical method for irinotecan (CPT-11) and its metabolites using a high performance liquid chromatography: Parallel detection with fluorescence and mass spectrometry. Biomed Chromatogr 2002;16:209-18.
- Bardin S, Guo W, Johnson JL, Khan S, Ahmad A, Duggan JX, et al. Liquid chromatographic-tandem mass spectrometric assay for the simultaneous quantification of Camptosar and its metabolite SN-38 in mouse plasma and tissues. J Chromatogr A 2005;1073:249-55.
- D’Esposito F, Tattam BN, Ramzan I, Murray M. A liquid chromatography/electro spray ionization mass spectrometry (LC-MS/ MS) assay for the determination of irinotecan (CPT-11) and its two major metabolites in human liver microsomal incubations and human plasma samples. J Chromatogr B AnalytTechnol Biomed Life Sci 2008;875:522-30.
- Rabba AK, Si L, Xue K, Li M, Li G. In Situ intestinal perfusion of irinotecan: Application to P-gp mediated drug interaction and introduction of an improved HPLC assay. J Pharm Pharm Sci 2011;14:138-47.
- Takemoto I, Itagaki S, Chiba M, Itoh T, Hirano T, Iseki K. Characterization of secretory intestinal transport of the lactone form of CPT-11. Cancer ChemotherPharmacol 2006;57:129-33.
- Akimoto K, Kawai A, Ohya K. Kinetic studies of the hydrolysis and lactonization of camptothecin and its derivatives, CPT-11 and SN-38, in aqueous solution. Chem Pharm Bull 1994;42:2135-8.
- Bansal T, Awasthi A, Jaggi M, Khar RK, Talegaonkar S. 19. ICH harmonised tripartite guideline: Validation of analytical Development and validation of reversed phase liquid chromatographic method utilizing ultraviolet detection for quantification of irinotecan (CPT-11) and its active metabolite, SN-38, in rat plasma and bile samples: Application to pharmacokinetic studies. Talanta 2008;76:1015-21.
- Gupta E, Lasting TM, Mick R, Ramirez J, Vokes EE,Ratain MJ. Metabolic fate of irinotecan in humans: Correlation of glucuronidation with diarrhea. Cancer Res 1994;54:3723-5.
- Mohammadi A, Esmaeili F, Dinarvand R, Atyabi A, Walker RB. Simultaneous Determination of Irinotecan Hydrochloride and its Related Compounds by High Performance Liquid Chromatography Using Ultraviolet Detection. Asian J Chem 2010;22:3966-72.
- Zufía L, Aldaz A, Giráldez J. Separation methods for camptothecin and related compounds. J Chromatogr B Biomed Sci Appl 2001;764:141-59.
- Arimori K, Kuroki N, Hidaka M, Iwakiri T, Yamsaki K, Okumura M, et al. Effect of P-glycoprotein modulator, cyclosporin A, on thegastrointestinal excretion of irinotecan and its metabolite SN-38 in rats. Pharm Res 2003;20:910-7.
- Yang X, Hu Z, Chan SY, Chan E, Goh BC, Duan W, et al. Novel agents that potentially inhibit irinotecan-induced diarrhea. Curr Med Chem 2005;12:1343-58.
- Araki E, Ishikawa M, Iigo M, Koide T, Itabashi M, Hoshi A. Relationship between development of diarrhea and the concentration of SN-38, an active metabolite of CPT-11, in the intestine and the blood plasma of athymic mice following intraperitoneal administration of CPT-11. Jpn J Cancer Res 1993;84:697-702.
- Yamamoto W, Verweij J, de Bruijn P, de Jonge MJ, Takano H, Nishiyama M, et al. Active transepithelial transport of irinotecan (CPT-11) and its metabolites by human intestinal Caco-2cells. Anticancer Drugs 2001;12:419-32.
- Bansal T, Akhtar N, Jaggi M, Khar RK, Talegaonkar S. Novel formulation approaches for optimising delivery of anticancer procedures: Text and methodology, Q2 (R1), Geneva. Available from: http://www.ich.org/LOB/media/MEDIA417.pdf [Last accessed on 2005]. (Parent Guideline dated 27 October 1994, Complementary Guideline on Methodology dated 6 November 1996 incorporated in November 2005).
- Warsi MH, Chaurasiya A, Jain GK, Pathan SA, Chander P, Singh AK, et al. Aqueous Humor Pharmacokinetics of Dorzolamide Loaded PLGAChitosan Nanoparticles by Ultra Performance Liquid Chromatography. Curr Pharm Anal 2011;7:189-94.
- Itagaki S, Chiba M, Shimamoto S, Sugawara M, Kobayashi M, Miyazaki K, et al. Characterization of secretory intestinal transport of phenolsulfonphthalein. Drug MetabPharmacokinet 2005;20:72-8.
- Murali BV, Venkateswara RJ, Ramakrishna S, Sankar GG, Balamurali KT. Validated Reverse Phase HPLC Method for the Determination of Irinotecan in Pharmaceutical Dosage Forms. E-J Chem 2007;4:128-36.
- Ebrahimnejad P, Dinarvand R, Sajadi A, Jafari MA, Movaghari F, Atyabi F. Development and Validation of an Ion-pair HPLC Chromatography for Simultaneous Determination of Lactone and Carboxylate Forms of SN-38 in Nanoparticles. J Food Drug Anal 2009;17:246-56.
- Shende P, Gaud R. Validated RP-HPLC Analysis of Irinotecan HCl in the Bulk Material and in Pharmaceutical Formulations. Acta Chromatograph 2009;21:71-82.
- Kumar VK, Raju NA, Rani N, SeshagiriRao JV, Satyanarayana T. The Estimation of Irinotecan HCl in Parenterals by RP-HPLC. Asian J Res Chem 2009;2:54-6.
- Barthe L, Bessouet M, Woodley JF, Houin G. The improved everted gut sac: A simple method to study intestinal P-glycoprotein. Int J Pharm 1998;173:255-8.
- Carreño-Gómez B, Duncan R. Everted rat intestinal sacs: A new model for the quantitation of P-glycoprotein mediated-efflux of anticancer agents. Anticancer Res 2000;20:3157-61.
- Cornaire G, Woodley JF, Saivin S, Legendre JY, Decourt S, Cloarec A, et al. Effect of polyoxyl 35 castor oil and Polysorbate 80 on theintestinal absorption of digoxin in vitro. Arzneimittelforschung 2000;50:576-9.
- Salphati L, Benet LZ. Metabolism of digoxin and digoxigenindigitoxosides in rat liver microsomes: Involvement of cytochrome P4503A. Xenobiotica 1999;29:171-85.
- Hugger ED, Novak BL, Burton PS, Audus KL, Borchardt RT. A comparison of commonly used polyethoxylated pharmaceutical excipients on their ability to inhibit P-glycoprotein activity in vitro. J Pharm Sci 2002;91:1991-2002.
- Hugger ED, Audus KL, Borchardt RT. Effects of poly(ethylene glycol) on efflux transporter activity in Caco-2 cell monolayers. J Pharm Sci 2002;91:1980-90.
- Hugger ED, Cole CJ, Raub TJ, Burton PS, Borchardt RT. Automated analysis of polyethylene glycol-induced inhibition of P-glycoprotein activity in vitro. J Pharm Sci 2003;92:21-6.
- Rege BD, Yu LX, Hussain AS, Polli JE. Effect of common excipients on Caco-2 transport of low-permeability drugs. J Pharm Sci 2001;90:1776-86.
- Cornaire G, Woodley J, Hermann P, Cloarec A, Arellano C, Houin G. Impact of excipients on the absorption of P-glycoprotein substrates in vitro and in vivo. Int J Pharm 2004;278:119-31.
- Li M, Si L, Pan H, Rabba AK, Yan F, Qiu J, et al. Excipients enhance intestinal absorption of ganciclovir by P-gp inhibition: Assessed in vitro by everted gut sac and in situ by improved intestinal perfusion. Int J Pharm 2011;403:37-45.
- Buckingham LE, Balasubramanian M, Emanuele RM, Clodfelter KE, Coon JS. Comparison of solutol HS 15, Cremophor EL and novel ethoxylated fatty acid surfactants as multidrug resistance modification agents. Int J Cancer 1995;62:436-42.
- Lo YL. Relationships between the hydrophilic-lipophilic balance values of pharmaceutical excipients and their multidrug resistance modulating effect in Caco-2 cells and rat intestines. J Control Release 2003;90:37-48.