- *Corresponding Author:
- Qian Jiang
Department of Pediatric Dentistry, Shanghai Ninth People’s Hospital, Shanghai Jiao Tong University School of Medicine, Shanghai 200025, China
E-mail: jiangqian0720@hotmail.com
| This article was originally published in a special issue, “Trends in Therapeutic Management of Various Clinical Conditions II” |
| Indian J Pharm Sci 2021:83(2)Spl issue;222-230 |
This is an open access article distributed under the terms of the Creative Commons Attribution-NonCommercial-ShareAlike 3.0 License, which allows others to remix, tweak, and build upon the work non-commercially, as long as the author is credited and the new creations are licensed under the identical terms
Abstract
To explore the regulation and potential mechanism of long non-coding ribonucleic acid taurine upregulated gene 1 on the apoptosis and cell cycle of osteoblasts is the main purpose. The overexpression plasmid and small interfering ribonucleic acid were used to regulate the expression of taurine upregulated gene 1 in osteoblasts. The expression of taurine upregulated gene 1 was detected by quantitative reverse transcription polymerase chain reaction and the effect of taurine upregulated gene 1 on the apoptosis and cell cycle of osteoblasts were detected by flow cytometry, quantitative reverse transcription polymerase chain reaction and western blot analyses were used to detect the regulation of taurine upregulated gene 1 on cell division control protein 42 homolog and combined with functional recovery experiments to verify that taurine upregulated gene 1 regulated the apoptosis and cell cycle of osteoblasts through cell division control protein 42 homolog. Silencing taurine upregulated gene 1 promoted the apoptosis of osteoblasts and blocked osteoblasts from entering the growth 2 phase/mitotic phase. Overexpression of taurine upregulated gene 1 had no significant effect on the apoptosis and cell cycle of osteoblasts. Silencing taurine upregulated gene 1 inhibited the expression of cell division control protein 42 homolog and overexpression of taurine upregulated gene 1 promoted the expression of cell division control protein 42 homolog. In addition, compared with the taurine upregulated gene 1 overexpression group, the apoptosis of osteoblasts in the taurine upregulated gene 1 overexpression+cell division control protein 42 homolog antagonist group increased significantly. Compared with the taurine upregulated gene 1 silencing group, the apoptosis of osteoblasts in the taurine upregulated gene 1 silencing+cell division control protein 42 homolog agonist group was significantly reduced and the number of osteoblasts entering the growth 2 phase/mitotic phase was significantly increased. Silencing taurine upregulated gene 1 promotes the apoptosis of osteoblasts and prevented osteoblasts from entering growth 2 phase/mitotic phase by downregulating the expression of cell division control protein 42 homolog. The normal expression level of taurine upregulated gene 1 maintains the normal apoptosis and cycle of osteoblasts by stabilizing the expression of cell division control protein 42 homolog.
Keywords
Long non-coding ribonucleic acid, taurine upregulated gene 1, osteoblasts, apoptosis, cell cycle
Osteoporosis is one of the most common type of skeletal diseases, the clinical characteristics of which include low bone mass and increased risk of fracture[1]. Due to increased osteoclast activity and reduced osteoblast bone formation, bone loss is inevitable in patients with osteoporosis[2]. Most of the existing therapies for osteoporosis include anti absorption drugs, such as bisphosphonates and anabolic drugs, such as dinosemide and tripatide[3]. Although these drugs effectively inhibit osteoclast activity, they also inhibit osteoblast bone remodeling, reduce bone mass, increase bone fragility and enhance the risk of bisphosphonate related jaw necrosis[1].
Long non-coding ribonucleic acid (lncRNA) has become an important epigenetic regulator, controlling gene expression and affecting numerous biological processes[4]. It has been reported that taurine upregulated gene 1 (TUG1), as a sponge of microRNA (miR)-204-5p, upregulates the expression of Runt-related transcription factor (RUNX) family transcription factor 2 to promote the differentiation of osteoblasts[5]. Silencing TUG1 can inhibit the wingless-related integration site (Wnt)/β- catenin signaling pathway, as well as reduce osteoblast proliferation and differentiation[6], while overexpression of TUG1 (OE-TUG1) promotes osteoblast proliferation and differentiation by regulating the miR-545-3p/ cannabinoid receptor 2 axis[7]. However, the effect of TUG1 on osteoblast apoptosis and cell cycle remains unknown.
Long non-coding ribonucleic acid (lncRNA) has become an important epigenetic regulator, controlling gene expression and affecting numerous biological processes[4]. It has been reported that taurine upregulated gene 1 (TUG1), as a sponge of microRNA (miR)-204-5p, upregulates the expression of Runt-related transcription factor (RUNX) family transcription factor 2 to promote the differentiation of osteoblasts[5]. Silencing TUG1 can inhibit the wingless-related integration site (Wnt)/β- catenin signaling pathway, as well as reduce osteoblast proliferation and differentiation[6], while overexpression of TUG1 (OE-TUG1) promotes osteoblast proliferation and differentiation by regulating the miR-545-3p/ cannabinoid receptor 2 axis[7]. However, the effect of TUG1 on osteoblast apoptosis and cell cycle remains unknown.
Therefore, the present study focused on the important association between TUG1 and CDC42 with osteoblast apoptosis and cell cycle progression. These findings will help to further analyze the potential underlying mechanism regulating the biological function of osteoblasts and provide novel insights into the clinical treatment of patients with osteoporosis.
Materials and Methods
Cell cultivation:
Human calvarial osteoblasts (cat. no. 4600) were purchased from Shanghai Zhongqiao Xinzhou Biotechnology Co., Ltd. Osteoblast culture medium consisted of 500 ml basic Roswell Park Memorial Institute (RPMI) 1640 medium (Biological Industries, USA), 25 ml fetal bovine serum (FBS) (cat. no. 0025), 5 ml osteoblast growth factors (ObGS; cat. no. 4652, ScienCellTM, USA) and 5 ml Penicillin/streptomycin antibiotic solution (cat. no. 0503). Cells were incubated under a saturated humidity condition at 37° and supplied with 5 % CO2.
Relevant agents and kit:
The TUG1 overexpression vector pIRSE2-EGFP and blank vector pIRSE2-EGFP were provided by Shanghai Shenggong Biological Engineering Co, Ltd. Small interfering (si) RNA-negative control (NC) (5’-UUCGAGAGAUGCACGGAAAU-3’; cat. no. 439084) and siRNA-TUG1 (5’-GGGAUAUAGCCAGAGAACAAUUCU-3;’ cat. no. 1299001) were supplied by Thermo Fisher Scientific, Inc. A total of 40 nmol siRNA or 10 nmol plasmid was used with 10 or 20 μl Lipofectamine® 2000 reagent (Invitrogen; Thermo Fisher Scientific, Inc.) to transfect the cells. After 24 h of cell transfection, the cells were collected for subsequent experiments. The concentrations of the CDC42 antagonist (ML141; MCE) [15] and the CDC42 agonist (CN02-A; Cytoskeleton)[16] were 0.2 μmol and 1.0 Units/ml, respectively. Both treatments were conducted for 24 h at room temperature.
Quantitative reverse transcription polymerase chain reaction (qRT-PCR):
TRIzol® reagent (Invitrogen; Thermo Fisher Scientific, Inc.) was used to extract total RNA from cells. Briefly, 200 μl chloroform was added to the homogenized lysate and shaken vigorously for 15 sec, left for 5 min at room temperature and then centrifugated at 4° for 15 min at 12 000 x g (relative centrifugal force). After centrifugation, 400 μl supernatant was transferred to a new centrifuge tube and an equal volume of 400 μl isopropanol was added and mixed by inverting the tube up and down. After the tube was left at room temperature for 10 min, centrifugation was conducted again at 12 000 x g at 4° for 15 min; a pellet should have formed at the bottom of the tube. Then, 1 ml of 75 % ethanol with diethyl pyrocarbonate (DEPC) water was added to wash the pellet after decanting the supernatant, which was subjected to centrifugation at 12 000 x g at 4° for 10 min; the white precipitate remaining in the tube was dried at room temperature after discarding the supernatant. RNase-free water was added to resuspend the pellet, gently pipetting with an up and down motion until it was completely dissolved. The concentration was measured and products were used for polymerase chain reaction (PCR) amplification and reverse transcription into complementary deoxyribonucleic acid (cDNA). All cDNA samples were subjected to quantitative reverse transcription polymerase chain reaction (qRT-PCR) analysis. Aliquots of cDNA were used for messengerRNA quantification by qPCR using a LightCycler 96 real-time quantitative PCR detection system (Roche Applied Science). The thermocycling conditions were as follows: 35 cycles of denaturation at 94° for 30 sec, annealing at 37° for 30 sec and extension at 72° for 1 min. The reaction system (25 μl) contained the cDNA, forward and reverse primers and SYBR Green PCR MasterMix (Roche Applied Science). Data were analyzed using β-actin gene expression as the internal standard and the 2-Cq method was used for quantification[17]. The system configuration is shown in Table 1. All primers used in this experiment are presented in Table 2.
| Component | Volume |
|---|---|
| SYBR™ Green supermix | 5 μl |
| Upstream primer | 0.5 μl |
| Downstream primers | 0.5 μl |
| Double distilled water (ddH2O) | 3 μl |
| The sample cDNA | 1 μl |
| Total volume | 10 μl |
Table 1: Pcr Reaction System
| Gene | Forward primer | Reverse primer | UPL probe no. | Accession no. |
|---|---|---|---|---|
| TUG1 | 5'-TTGTCACGTCCACCGGACCTG-3' | 5'-CACAAATTCCCATCATTCCC-3' | 12 | NR_152871 |
| CDC42 | 5’-GCAGTCACAGTTATGATTGGTGGA-3’ | 5’-TTGTGGATAACTCAGCGGTCGTA-3’ | 22 | NM_044472 |
| β-actin | 5'-GACCTCTATGCCAACACAGT-3' | 5'-AGTACTTGCGCTCAGGAGGA-3' | 64 | NM_001101.4 |
TUG1: taurine-upregulated gene 1; CDC42: cell division control protein 42 homolog
Table 2: Primers Used For Qrt-Pcr
Western blot analysis:
Cells were lysed using radioimmunoprecipitation assay (RIPA) buffer (Sigma-Aldrich) supplied with phenylmethylsulfonyl fluoride (PMSF). The extracted protein concentration then was determined using a bicinchoninic acid (BCA) kit (Sigma-Aldrich; Merck KGaA). Equal quantities of protein (50 μg) were loaded on a Sodium dodecyl sulfate (SDS) gel, resolved using 12 % sodium dodecyl sulfate polyacrylamide gel electrophoresis (SDS-PAGE) and transferred to a polyvinylidene fluoride (PVDF) membrane.
The primary antibodies used in the experiment were α-Tubulin (cat. no. ab9385; Abcam; 1:5,000) and CDC42 (cat. no. ab41429; Abcam; 1:2,000). Subsequently, the membranes were washed three times with phosphatebuffered saline (PBS) containing 0.05 % Tween-20 and incubated with a horseradish peroxidase conjugated secondary antibody (1: 2000; cat. no. sc-2005; Santa Cruz Biotechnology, Inc.) at room temperature for 2 h. The membranes were washed again and target bands are detected using an enhanced chemiluminescence reagent (Thermo Fisher Scientific, Inc.) and analyzed using ImageJ software v1.8.0 (National Institutes of Health). β-actin was used as the internal control. The experiments were repeated three times.
Flow cytometric analysis of cell apoptosis (Annexin V/propidium iodide (PI) double staining method):
Cells in the logarithmic growth phase were collected and inoculated at 2 ml in a 6 well plate (1x10⁶ cells/ml). The culture was stopped and cells were harvested after 24 h. The culture was then centrifuged at 12 000 x g at 4° for 5 min and the supernatant was discarded. The cells were washed once with the incubation buffer and then pelleted at 12 000 x g at 4° for 5 min. Subsequently, the cells were resuspended with 100 μl labeling solution and incubated at room temperature for 10-15 min in the dark. The resuspension was centrifuged at 12 000 x g at 4° for 5 min and the cells were washed with incubation buffer once again. 100 μl of the sample solution was transferred to a 5 ml culture tube and incubated with 5 μl of fluorescein isothiocyanate (FITC) conjugated annexin V (Pharmingen) and 5 μl of PI (Pharmingen) for 15 min at room temperature in the dark. Flow cytometry analysis was conducted as follows: 488 nm was used as the excitation light wavelength for flow cytometry; a band pass filter with a wavelength of 515 nm was used to detect FITC fluorescence and another filter with a wavelength >560 nm was used to detect PI. The result was determined based on the fact that apoptotic cells are resistant to all dyes used for cell viability identification, such as PI. Necrotic cells do not have this feature. The DNA of cells with damaged cell membranes can be stained with PI to produce red fluorescence, while cells with intact cell membranes will not[18]. On the scatter diagram of the bivariate flow cytometer, the lower left quadrant shows variable cells (FITC&ddeg;/PI&ddeg;); the upper left quadrant includes nonviable (necrotic) cells (FITC+/PI+) and the upper right and lower quadrants shows apoptotic cells (FITC+/ PI&ddeg;). Samples were analyzed by fluorescence-activated cell sorting (FACS) (Becton Dickinson) using Cell Quest Research Software (Becton Dickinson).
Flow cytometric analysis of the cell cycle:
A flow cytometer was used to determine the cell cycle distribution. Cells in the logarithmic growth phase were collected after which they were digested using trypsin-ethylenediamine tetraacetic acid (EDTA) and inoculated at 2 ml in a 6-well plate (1x10⁶ cells/ml). The culture incubation was terminated after 24 h, followed by subsequent experimentation. Cells were centrifuged at 400 x g for 5 min at 37&ddeg;, the cell pellet was collected and the supernatant was then discarded. The cell pellet was washed twice with pre-cooled PBS and then precooled 75 % ethanol was added. Subsequently, the cells were fixed by adding 4 ml of &ddeg;20&ddeg;, absolute ethanol for more than 4 h. The cells were centrifuged at 12 000 x g at 4&ddeg; for 5 min and the supernatant was discarded. Then, cells were washed once with 3 ml PBS, followed the addition of 400 μl carboxysomal carbonic anhydrases (CCAA) solution (PI stain; Engreen Biosystem Co, Ltd.) and 100 μl RNase A (100 μg/ml). The mixture was incubated at 4&ddeg; for 30 min in the dark. The flow cytometer (Attune NxT; Thermo Fisher Scientific, Inc.) was used according to standard procedures for detection: 20 000-30 000 cells were counted and the results were analyzed with the cell cycle simulation software using Invitrogen Attune NxT software version 4.2 (Invitrogen; Thermo Fisher Scientific, Inc.).
Statistical analysis:
The statistical software SPSS 19.0 (IBM Corp.) was used for data analysis. Data are presented as the mean±standard deviation of three repeats and an independent samples t-test was used for comparison between groups, p<0.05 was considered to indicate a statistically significant difference.
Results and Discussion
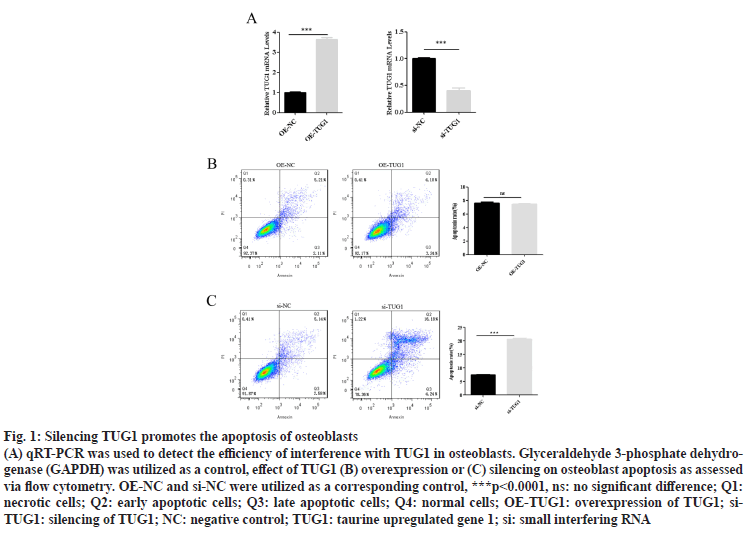
AThe qRT-PCR results identified that OE-TUG1 significantly upregulated the expression of TUG1 in osteoblasts (fig. 1A), while silencing TUG1 in osteoblasts significantly inhibited the expression of TUG1 (fig. 1A). Moreover, the flow cytometry results demonstrated that OE-TUG1 had no significant effect on osteoblast apoptosis (fig. 1B). However, silencing TUG1 significantly promoted osteoblast apoptosis (fig. 1B). These results suggest that TUG1 maintains the normal apoptosis of osteoblasts. However, when TUG1 is absent, osteoblast apoptosis is disrupted.
Figure 1: Silencing TUG1 promotes the apoptosis of osteoblasts
(A) qRT-PCR was used to detect the efficiency of interference with TUG1 in osteoblasts. Glyceraldehyde 3-phosphate dehydrogenase (GAPDH) was utilized as a control, effect of TUG1 (B) overexpression or (C) silencing on osteoblast apoptosis as assessed via flow cytometry. OE-NC and si-NC were utilized as a corresponding control, ***p<0.0001, ns: no significant difference; Q1: necrotic cells; Q2: early apoptotic cells; Q3: late apoptotic cells; Q4: normal cells; OE-TUG1: overexpression of TUG1; si- TUG1: silencing of TUG1; NC: negative control; TUG1: taurine upregulated gene 1; si: small interfering RNA
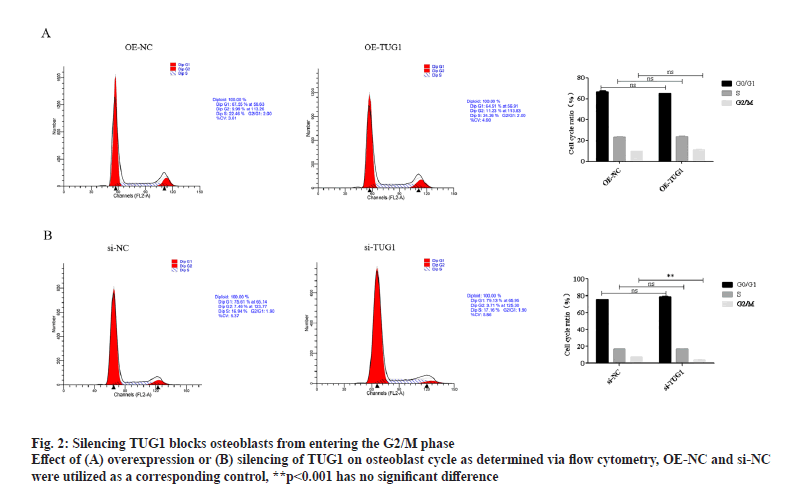
As demonstrated by the flow cytometry results, OETUG1 had no significant effect on the cell cycle of osteoblasts (fig. 2A). However, silencing TUG1 significantly blocked the entry of osteoblasts into the growth 2 phase/mitotic phase (G2/M phase) (fig. 1B). Thus, TUG1 may maintain the normal cell cycle progression of osteoblasts and when TUG1 is absent, the entry of osteoblasts into the G2/M phase is blocked.
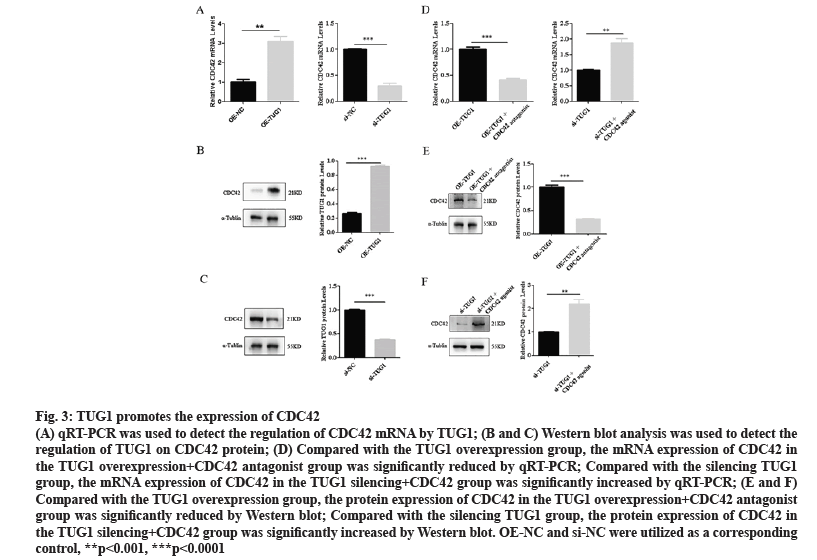
OE-TUG1 promoted the expression of CDC42, while silencing TUG1 inhibited the expression of CDC42, as determined by qRT-PCR and western blotting (fig. 3A, fig. 3B and fig. 3C). Compared with the TUG1 overexpression group, the expression of CDC42 in the TUG1 overexpression+CDC42 antagonist group was significantly reduced. Compared with the silencing TUG1 group, the expression of CDC42 in the TUG1 silencing+CDC42 group was significantly increased (fig. 3D, fig. 3E and fig. 3F).
Figure 3: TUG1 promotes the expression of CDC42
(A) qRT-PCR was used to detect the regulation of CDC42 mRNA by TUG1; (B and C) Western blot analysis was used to detect the regulation of TUG1 on CDC42 protein; (D) Compared with the TUG1 overexpression group, the mRNA expression of CDC42 in the TUG1 overexpression+CDC42 antagonist group was significantly reduced by qRT-PCR; Compared with the silencing TUG1 group, the mRNA expression of CDC42 in the TUG1 silencing+CDC42 group was significantly increased by qRT-PCR; (E and F) Compared with the TUG1 overexpression group, the protein expression of CDC42 in the TUG1 overexpression+CDC42 antagonist group was significantly reduced by Western blot; Compared with the silencing TUG1 group, the protein expression of CDC42 in the TUG1 silencing+CDC42 group was significantly increased by Western blot. OE-NC and si-NC were utilized as a corresponding control, **p<0.001, ***p<0.0001
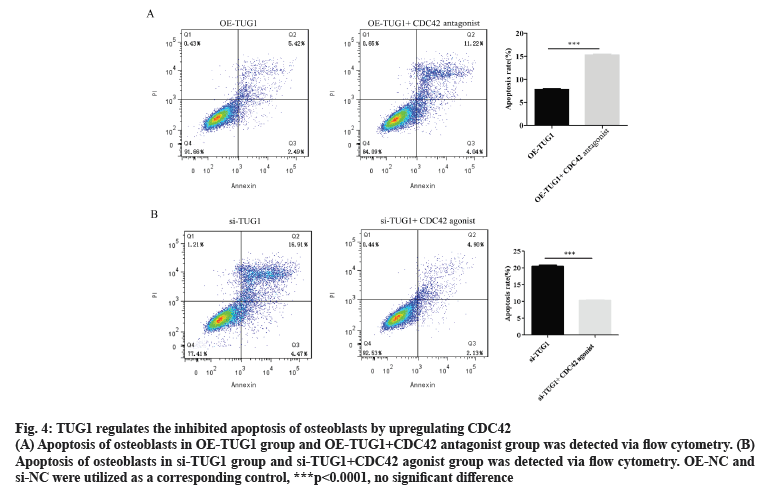
As presented in fig. 4A, compared with the OETUG1 group, the apoptosis of osteoblasts in the TUG1 overexpression+CDC42 antagonist group was significantly increased. Based on these findings in fig. 1B and fig. 3, it was suggested that TUG1 maintains the normal apoptosis of osteoblasts by promoting the expression of CDC42. Compared with the si-TUG1 group, the apoptosis of osteoblasts in the si-TUG1+CDC42 agonist group was significantly decreased (fig. 4B). Based on these findings in fig. 1C and fig. 3, it was indicated that silencing TUG1 promotes apoptosis in osteoblast by inhibiting the expression of CDC42.
Figure 4: TUG1 regulates the inhibited apoptosis of osteoblasts by upregulating CDC42
(A) Apoptosis of osteoblasts in OE-TUG1 group and OE-TUG1+CDC42 antagonist group was detected via flow cytometry. (B) Apoptosis of osteoblasts in si-TUG1 group and si-TUG1+CDC42 agonist group was detected via flow cytometry. OE-NC and si-NC were utilized as a corresponding control, ***p<0.0001, no significant difference
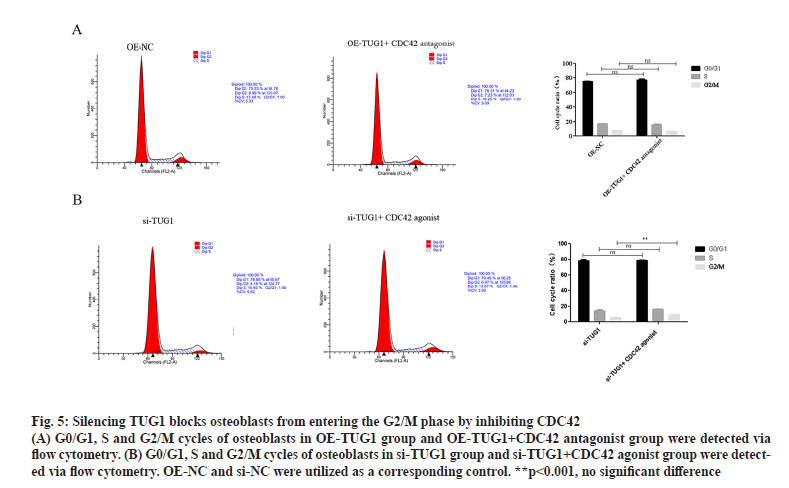
As presented in fig. 5A, there was no significant difference in the cell cycle of osteoblasts between the TUG1 overexpression group and the TUG1 overexpression+CDC42 antagonist group. Compared with the si-TUG1 group, the osteoblasts in the si- TUG1+CDC42 agonist group were blocked from entering the G2/M phase (fig. 5B). Based on these findings in fig. 2B and fig. 3, it was suggested that silencing TUG1 promotes apoptosis of osteoblasts by inhibiting CDC42 expression.
Figure 5: Silencing TUG1 blocks osteoblasts from entering the G2/M phase by inhibiting CDC42
(A) G0/G1, S and G2/M cycles of osteoblasts in OE-TUG1 group and OE-TUG1+CDC42 antagonist group were detected via flow cytometry. (B) G0/G1, S and G2/M cycles of osteoblasts in si-TUG1 group and si-TUG1+CDC42 agonist group were detected via flow cytometry. OE-NC and si-NC were utilized as a corresponding control. **p<0.001, no significant difference
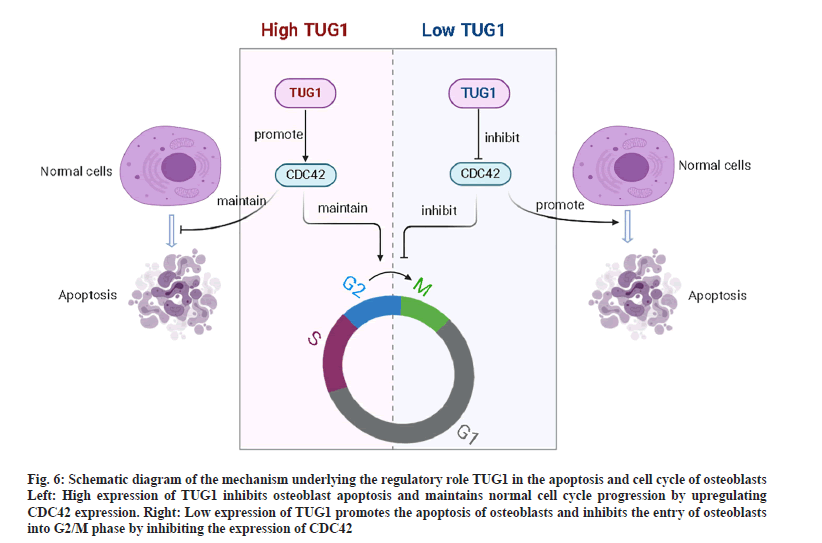
The present study demonstrated that TUG1 promoted the expression of CDC42 in osteoblasts, thereby maintaining the normal cell cycle progression of osteoblasts and inhibiting apoptosis by upregulating CDC42. However, silencing TUG1 facilitated osteoblast apoptosis and blocked osteoblasts from entering the G2/M phase by inhibiting CDC42 expression (fig. 6).
Figure 6: Schematic diagram of the mechanism underlying the regulatory role TUG1 in the apoptosis and cell cycle of osteoblasts Left: High expression of TUG1 inhibits osteoblast apoptosis and maintains normal cell cycle progression by upregulating CDC42 expression. Right: Low expression of TUG1 promotes the apoptosis of osteoblasts and inhibits the entry of osteoblasts into G2/M phase by inhibiting the expression of CDC42
It has been reported that TUG1 promoted cell proliferation and inhibited cell apoptosis by regulating the expression of aurora kinase A in epithelial ovarian cancer cells[17]. In osteosarcoma cells, over expression of TUG1 accelerates cell proliferation and inhibits apoptosis by regulating the miR-212-3p/FOXA1 axis[18], TUG1 knockdown inhibited cell proliferation and colony formation and induced G0/ G1 cell cycle arrest and apoptosis in vitro and suppressed tumor growth in vivo through a novel TUG1/miR-9- 5p/POU2F1 pathway[19]. In addition, TUG1 blocks the proliferation and apoptosis of multiple myeloma cells promoted by miR-29b-3p[20]. In the present study, the flow cytometry results demonstrated that OE-TUG1 did not significantly change the apoptosis of osteoblasts, while silencing TUG1 significantly increased the apoptosis of osteoblasts. It was therefore suggested that the normal expression level of TUG1 may be essential to sustain a low level of apoptosis of osteoblasts and when TUG1 is absent, the apoptosis of osteoblasts may increase significantly.
Li et al.[21] revealed that TUG1 impeded the proliferation of ovarian cancer cells by regulating the expression of amplified in breast cancer 1 (AIB1) and thus the cell cycle was arrested in the G1 phase. In pancreatic cancer, silencing TUG1 blocks the cell cycle and accelerates apoptosis via Rho family GTPase 3 and metallothionein 2A, thereby inhibiting pancreatic cancer cell proliferation[22]. Furthermore, silencing TUG1 blocks cell cycle progression and promotes the apoptosis of breast cancer cell line (MCF-7) cells[23]. It has been shown that inhibition of miR- 9 eliminated the effects of TUG1 knockdown on MCF-7 cell proliferation, cell cycle progression and apoptosis[24]. In the present study, it was found that silencing TUG1 blocked osteoblasts from entering the G2/M phase, but OE-TUG1 had no significant effect on the cell cycle progression of osteoblasts. Therefore, it was suggested that an appropriate level of TUG1 is sufficient to maintain the normal cycle progression of osteoblasts. However, the cell cycle progression of osteoblasts is blocked when TUG1 is absent.
The present study identified that silencing TUG1 significantly inhibited the expression of CDC42 in osteoblasts, while OE-TUG1 significantly promoted the expression of CDC42 in osteoblasts, as detected by (qRTPCR) and western blotting. Therefore, it was suggested that the regulation of TUG1 on osteoblast apoptosis and cell cycle may depend on CDC42.
Apoptosis is a process of programmed cell death, which maintains a healthy survival or death balance of epigenetic cells[25]. Defects in apoptosis could lead to cancer or autoimmunity, while increased apoptosis could cause degenerative diseases[26,27]. Moreover, CDC42 deficiency induces podocyte apoptosis by inhibiting the Nwasp (neuronal Wiskott-Aldrich syndrome protein)/Stress Fiber/Yes-associated protein (YAP) pathway[28]. CDC42 inhibition also reverses the protective effect of miR-137 downregulation on cardiomyocyte apoptosis[29]. In the present study, the apoptosis of osteoblasts in the TUG1 silencing+CDC42 antagonist group was significantly increased compared with the TUG1 overexpression group. On the contrary, the apoptosis of osteoblasts in the TUG1 silencing+CDC42 agonist group was significantly reduced compared with the TUG1 silencing group. Therefore, it was suggested that the regulation of TUG1 on osteoblast apoptosis depended on CDC42.
The eukaryotic cell cycle involves a series of highly coordinated events in which the cell genome is replicated[30]. During the synthetic phase, each strip of the two DNA strain resulting copies is correctly separated[31]. Host cytokine 1 (HCF-1) is a transcriptional co-regulator and is essential for basic cellular processes such as transcriptional regulation and cell cycle progression[30]. A previous study has shown that HCF-1 ensured normal cell cycle progression by regulating CDC42 expression[30]. In breast cancer cells, the negative regulation of CDC42 prevents cell cycle progression[32]. In the present study, there was no significant change in the cell cycle of osteoblasts in the TUG1 overexpression group and the TUG1 overexpression+CDC42 antagonist group. However, osteoblasts in the TUG1 silencing group entering the G2/M were significantly impeded compared with the TUG1 silencing+CDC42 agonist group. Thus, it was indicated that the regulation of TUG1 on cell cycle progression was dependent on CDC42 in osteoblasts.
The present study preliminarily demonstrated the key role of the TUG1/CDC42 axis in regulating osteoblast apoptosis and cell cycle progression, thereby providing a novel idea and theoretical basis for the clinical application of this axis in the treatment of osteoporosis in the future.
Funding:
This study was funded by the National Natural Science Foundation of China (grant no. 31800816) and Fundamental Research Program Funding of the Ninth People’s Hospital Affiliated to Shanghai Jiao Tong University School of Medicine (Grant No. JYZZ109).
Conflicts of Interest:
The authors declared no conflict of interest
References
- Wu QY, Li X, Miao ZN, Ye JX, Wang B, Zhang F, et al. Long non-coding RNAs: a new regulatory code for osteoporosis. Front Endocrinol 2018;9:587.
- Yuan FL, Xu MH, Li X, Xinlong H, Fang W, Dong J. The roles of acidosis in osteoclast biology. Front Physiol 2016;7:222.
- Asafo-Adjei TA, Chen AJ, Najarzadeh A, Puleo DA. Advances in controlled drug delivery for treatment of osteoporosis. Curr Osteoporos Rep 2016;14(5):226-38.
- Laurent GS, Wahlestedt C, Kapranov P. The landscape of long noncoding RNA classification. Trends Genet 2015;31(5):239-51.
- Yu C, Li L, Xie F, Guo S, Liu F, Dong N, et al. LncRNA TUG1 sponges miR-204-5p to promote osteoblast differentiation through upregulating Runx2 in aortic valve calcification. Cardiovasc Res 2018;114(1):168-79.
- Liu SC, Sun QZ, Qiao XF, Li XG, Yang JH, Wang TQ, et al. LncRNA TUG1 influences osteoblast proliferation and differentiation through the Wnt/beta-catenin signaling pathway. Eur Rev Med Pharmacol Sci 2019;23(11):4584-90.
- Han Y, Liu C, Lei M, Sun S, Zheng W, Niu Y, et al. LncRNA TUG1 was upregulated in osteoporosis and regulates the proliferation and apoptosis of osteoclasts. J Orthop Surg Res 2019;14(1):1-6.
- Wang Z, Liu J, Wang R, Wang Q, Liang R, Tang J. Long non-coding RNA taurine upregulated gene 1 (TUG1) downregulation constrains cell proliferation and invasion through regulating cell division cycle 42 (CDC42) expression via MiR-498 in esophageal squamous cell carcinoma cells. Med Sci Monit 2020;26:e919714-1.
- Strzelecka-Kiliszek A, Mebarek S, Roszkowska M, Buchet R, Magne D, Pikula S. Functions of Rho family of small GTPases and Rho-associated coiled-coil kinases in bone cells during differentiation and mineralization. Biochim Biophys Acta Gen Subj 2017;1861(5):1009-23.
- Mo H, Yeganehjoo H, Shah A, Mo WK, Soelaiman IN, Shen CL. Mevalonate-suppressive dietary isoprenoids for bone health. J Nutr Biochem 2012;23(12):1543-51.
- Yoshida T, Clark MF, Stern PH. The small GTPase RhoA is crucial for MC3T3-E1 osteoblastic cell survival. J Cell Biochem 2009;106(5):896-902.
- Tan ML, Shao P, Friedhuber AM, van Moorst M, Elahy M, Indumathy S, et al. The potential role of free chitosan in bone trauma and bone cancer management. Biomaterials 2014;35(27):7828-38.
- Weivoda MM, Oursler MJ. The roles of small GTPases in osteoclast biology. Orthop Muscular Syst 2014;3.
- Etienne-Manneville S. Cdc42-the centre of polarity. J Cell Sci 2004;117(8):1291-300.
- Cheng SL, Ramachandran B, Behrmann A, Shao JS, Mead M, Smith C, et al. Vascular smooth muscle LRP6 limits arteriosclerotic calcification in diabetic LDLR-/- mice by restraining noncanonical Wnt signals. Circ Res 2015;117(2):142-56.
- Azios NG, Krishnamoorthy L, Harris M, Cubano LA, Cammer M, Dharmawardhane SF. Estrogen and resveratrol regulate Rac and Cdc42 signaling to the actin cytoskeleton of metastatic breast cancer cells. Neoplasia 2007;9(2):147-58.
- Li T, Chen Y, Zhang J, Liu S. LncRNA TUG1 promotes cells proliferation and inhibits cells apoptosis through regulating AURKA in epithelial ovarian cancer cells. Medicine 2018;97(36).
- Xie C, Chen B, Wu B, Guo J, Cao Y. LncRNA TUG1 promotes cell proliferation and suppresses apoptosis in osteosarcoma by regulating miR-212-3p/FOXA1 axis. Biomed Pharmacother 2018;97:1645-53.
- Xie CH, Cao YM, Huang Y, Shi QW, Guo JH, Fan ZW, et al. Long non-coding RNA TUG1 contributes to tumorigenesis of human osteosarcoma by sponging miR-9-5p and regulating POU2F1 expression. Tumor Biol 2016;37(11):15031-41.
- Liu D, Wang J, Liu M. Long noncoding RNA TUG1 promotes proliferation and inhibits apoptosis in multiple myeloma by inhibiting miR-29b-3p. Biosci Rep 2019;39(3).
- Li L, Gan ZH, Qin L, Jiao SH, Shi Y. AIB1 regulates the ovarian cancer cell cycle through TUG1. Eur Rev Med Pharmacol Sci 2017;21(24):5610-7.
- Hui B, Xu Y, Zhao B, Ji H, Ma Z, Xu S, et al. Overexpressed long noncoding RNA TUG1 affects the cell cycle, proliferation and apoptosis of pancreatic cancer partly through suppressing RND3 and MT2A. Onco Targets Ther 2019;12:1043-57.
- Wang S, Cheng M, Zheng X, Zheng L, Liu H, Lu J, et al. Interactions between lncRNA TUG1 and miR-9-5p modulate the resistance of breast cancer cells to doxorubicin by regulating eif5A2. Onco Targets Ther 2020;13:13159-70.
- Zhao XB, Ren GS. LncRNA taurine-upregulated gene 1 promotes cell proliferation by inhibiting microRNA-9 in MCF-7 cells. J Breast Cancer 2016;19(4):349-57.
- Elmore S. Apoptosis: a review of programmed cell death. Toxicol Pathol 2007;35(4):495-516.
- Goldar S, Khaniani MS, Derakhshan SM, Baradaran B. Molecular mechanisms of apoptosis and roles in cancer development and treatment. Asian Pac J Cancer Prev 2015;16(6):2129-44.
- Ventura MT, Casciaro M, Gangemi S, Buquicchio R. Immunosenescence in aging: between immune cells depletion and cytokines up-regulation. Clin Mol Allergy 2017;15(1):1-8.
- Huang Z, Zhang L, Chen Y, Zhang H, Zhang Q, Li R, et al. Cdc42 deficiency induces podocyte apoptosis by inhibiting the Nwasp/stress fibers/YAP pathway. Cell Death Dis 2016;7(3):e2142.
- Wang J, Xu R, Wu J, Li Z. MicroRNA-137 negatively regulates H2O2-induced cardiomyocyte apoptosis through CDC42. Med Sci Monit 2015;21:3498-504.
- Xiang P, Li F, Ma Z, Yue J, Lu C, You Y, et al. HCF-1 promotes cell cycle progression by regulating the expression of CDC42. Cell Death Dis 2020;11(10):1-2.
- Saqcena M, Patel D, Menon D, Mukhopadhyay S, Foster DA. Apoptotic effects of high-dose rapamycin occur in S-phase of the cell cycle. Cell Cycle 2015;14(14):2285-92.
- Zhang M, Guo W, Qian J, Wang B. Negative regulation of CDC42 expression and cell cycle progression by miR-29a in breast cancer. Open Med 2016;11(1):78-82.
