- *Corresponding Author:
- Xiaoni Kong
Department of Liver Surgery, Renji Hospital, School of Medicine, Shanghai Jiao Tong University, Shanghai,China
E-mail: xiaoni-kong@126.com
| This article was originally published in a special issue, “Clinical Research in Pharmaceutical and Biomedical Sciences” |
| Indian J Pharm Sci 2021:83(1)spl issue “141-147” |
This is an open access article distributed under the terms of the Creative Commons Attribution-NonCommercial-ShareAlike 3.0 License, which allows others to remix, tweak, and build upon the work non-commercially, as long as the author is credited and the new creations are licensed under the identical terms
Abstract
Hepatoblastoma is the most common tumor of liver in childhood. The onset of the disease is insidious, and the early stage is mostly asymptomatic. About 20 % of the children had distant metastasis at diagnosis. Only 50 %-60 % of the tumors can be completely resected by surgery, and the relapse percentage of children who undergo surgical treatment alone is still high. Therefore, the aim was to conduct a multimessenger RNA signature to improve hepatoblastoma progression prediction. Messenger RNA expression profiling of Gene Expression Ominus dataset (GSE131329) was analyzed in a large hepatoblastoma cohort and screened the significantly differential expressed Messenger RNAs between normal tissues and tumors. Weighted correlation network analysis was used to select genes that correlated to disease progression. Data fitting analysis was performed and three samples were removed from subsequent analyses in GSE131329. A total of 1263 differentially expressed genes were screened, consisting 569 up-regulated genes and 694 down-regulated genes. Gene ontology and Kyoto encyclopedia of genes and genomes pathway enrichment analyses were performed and by using weighted correlation network analysis, 8 hub genes were selected and an 8-messenger RNA-based signature was established that was significantly related to the disease progression of hepatoblastoma. Our results might provide an efficient clinical multiple-messenger RNA signature for predicting disease progression and be potentially efficient targets for hepatoblastoma patients.
Keywords
Hepatoblastoma, gene expression omnibus database, weighted correlation network analysis, messenger RNA signature, hub gene
Hepatoblastoma (HB) is a vulgar primary malignant pediatric hepatic tumor worldwide and over 90 % of the patients are younger than 5 y old [1,2]. Despite of the rarity, the incidence is increasing slowly [3]. Premature birth and very low birth weight are generally considered as major risk factors of HB [3-6]. There are also many factors such as oxygen therapy, medications, Total parenteral nutrition (TPN) and some toxins, but the exact mechanisms still remain unclear [3,4].
An increasing amount of evidences have demonstrated that genetic abnormalities may play an important role and can be identified as molecular biomarkers of HB [7,8]. Numerous studies are focused on genes involved in the Wnt signaling pathway [7,9], as the activation of this pathway could lead to the proliferation of HB and promote its development. However, functions of numerous genes and signal pathways were involved in HB, thus targeting single gene as a prognostic or therapeutic factor for HB was lack of accuracy. Therefore, the aim of this study was discovering multimessenger RNA signature to get a better prediction of disease progression of HB.
Gene Expression Omnibus database (GEO) is one of the public databases that offer large amounts of raw and normalized array-related and sequence-related data for study [10,11]. Large amounts of data for studies could be obtained and analyzed by the usage of bioinformatic methods [11,12]. We identified significant differential genes between HB tumors and normal liver tissues in a dataset of GEO database. Then, we conducted weighted correlation network analysis (WGCNA) [13,14] and established an 8-mRNA signature for disease progression prediction. Enrichment analysis and pathway analysis were performed. All of these may discover some efficient targets to individualized therapy for HB patients.
Materials and Methods
Data collection of HB
The gene expression data of HBs were searched and downloaded from GEO (https://www.ncbi.nlm.nih.gov/ geo/) database. There was one appropriate HB dataset from GEO database (GSE131329) met the following criteria: samples from tumor or normal tissues of homo sapiens, not from cell lines or other species; the number of samples larger than 10, consisting both tumor and non-neoplastic tissues; more than 90 % of the total transcriptional genes (n>17000) are annotated; and a total of more than 100 differentially expressed genes (DEGs).
Data Preprocessing
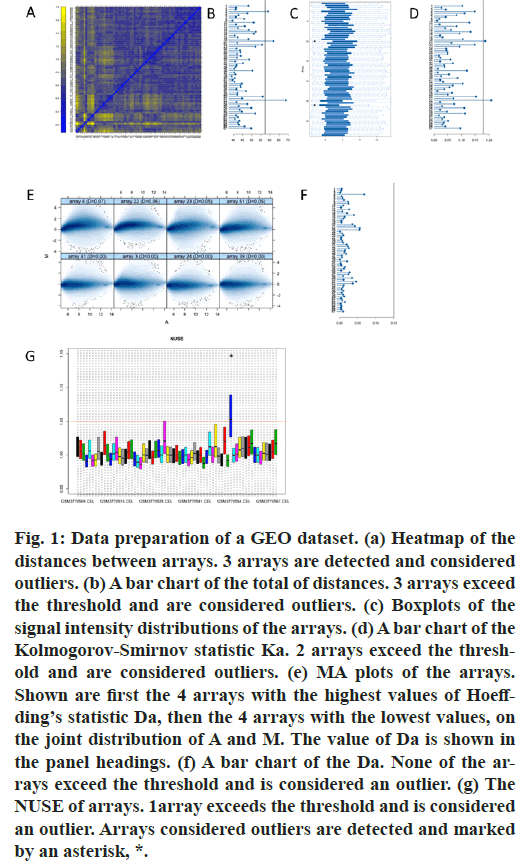
The R package “arrayQualityMetrics” was used for preparing and normalizing the raw microarray data in order to give more accurate information of the original datasets [15]. By using averaging and data fitting methods, microarray quality was evaluated. First, a heatmap was obtained covered the range of distances of samples. Intended biological factors or batch effects could lead to the outlier of the arrays. Then, boxplots of the intensity distributions of the arrays was conducted. Similar positions and widths of the boxes indicate the normalized and accessible data. Furthermore, MA plots were conducted. M and A are defined as: M=log2(I1)- log2(I2); A=1/2 (log2(I1)+log2(I2)). Finally, boxplots of normalized unscaled standard errors (NUSE) were conducted for data fitting. If the NUSE separated from 1, the samples were considered unqualified. After preprocessing data, qualified data of the dataset went on for further studying.
Analysis of microarray datasets
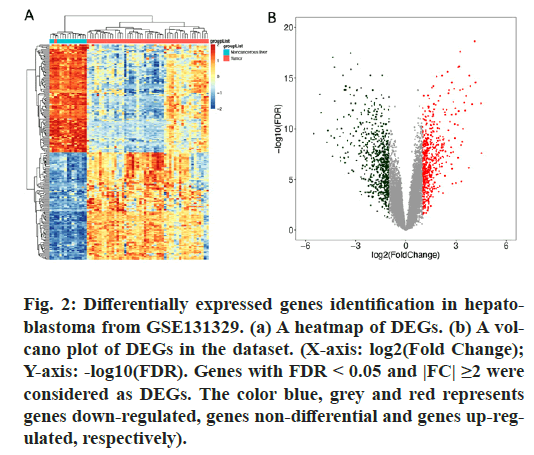
The R packages “GEOquery” and “limma” were used to obtain data and screen DEGs between samples of HB and nonneoplastic tissues in GSE131329 [16,17]. Calculated genes with adjusted p value<0.05 and |fold change (FC)|≥2 were considered as DEGs. A total of 1263 DEGs were screened, among which 569 genes were up-regulated and 694 were down-regulated.
GO enrichment analysis and KEGG pathway analysis
Gene Ontology (GO) analysis is an annotating method of genes and its products consist of three aspects, such as biological processes (BP), cellular component (CC) and molecular function (MF). The Kyoto Encyclopedia of Genes and Genomes (KEGG), (http://www.genome. ad.jp/kegg/) database is used for systematic biological analysis and annotation of gene functions, and it also can be used to visualize these associations. In this study, we used the R package “clusterProfiler” [18] to provide functional systematization analysis and KEGG pathway analysis of the DEGs, respectively.
Establishment of WGCNA
R package “WGCNA” was used for the establishment. First, the best thresholding power parameter (β) was determined by the approximate scale-free topology criterion. Modules which involved similar genes were aggregated through the dynamic tree cut method. Module eigengenes (MEs) and module significance (MS) were used to identify the distinguished modules which are related to the different clinical traits of HB patients. The module which was highly related to given clinical characteristics was chosen. Hub genes were selected from the module, and accorded with the clinical feature relationship (cor.geneTraitSignificance)>0.2 and the absolute value of the Pearson’s correlation (cor. geneModuleMembership)>0.8.
Statistical analysis
SPSS 17.0 and GraphPad Prism 6 software were used for statistical analysis. Results are exhibited as the mean±SEM. The results were assessed using twotailed, unpaired or paired Student’s t-test. p<0.05 was considered statistically significant.
Results and Discussion
First, we performed data fitting analysis for all the original data in GSE131329 by the usage of R package “arrayQualityMetrics”. Heatmap of the distances between arrays, signal intensity distribution boxplot, MA plot, NUSE boxplot were shown (fig.1). Therefore, our results showed that GSM3770505, GSM3770521, GSM3770553 were unqualified. These three samples should be dislodged without further analysis in GSE131329.
Figure 1: Data preparation of a GEO dataset. (a) Heatmap of the distances between arrays. 3 arrays are detected and considered outliers. (b) A bar chart of the total of distances. 3 arrays exceed the threshold and are considered outliers. (c) Boxplots of the signal intensity distributions of the arrays. (d) A bar chart of the Kolmogorov-Smirnov statistic Ka. 2 arrays exceed the threshold and are considered outliers. (e) MA plots of the arrays. Shown are first the 4 arrays with the highest values of Hoeffding’s statistic Da, then the 4 arrays with the lowest values, on the joint distribution of A and M. The value of Da is shown in the panel headings. (f) A bar chart of the Da. None of the arrays exceed the threshold and is considered an outlier. (g) The NUSE of arrays. 1array exceeds the threshold and is considered an outlier. Arrays considered outliers are detected and marked by an asterisk, *.
After analyzing the HB dataset using the R packages “GEOquery” and “limma”, a total of 1263 DEGs were screened, including 569 genes up-regulated and 694 genes down-regulated in HB patients’ samples compared to normal samples. Heatmap and volcano plots (fig. 2) showed the distribution and correlation of the total of DEGs.
Figure 2: Differentially expressed genes identification in hepatoblastoma from GSE131329. (a) A heatmap of DEGs. (b) A volcano plot of DEGs in the dataset. (X-axis: log2(Fold Change); Y-axis: -log10(FDR). Genes with FDR < 0.05 and |FC| ≥2 were considered as DEGs. The color blue, grey and red represents genes down-regulated, genes non-differential and genes up-regulated, respectively).
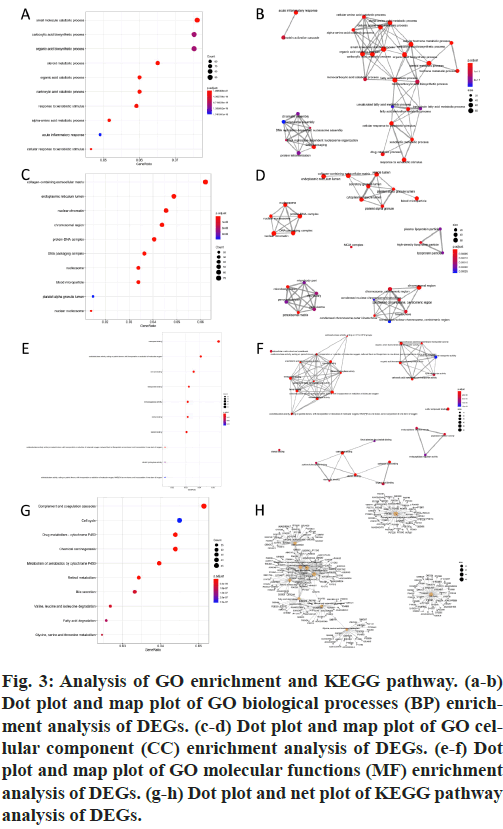
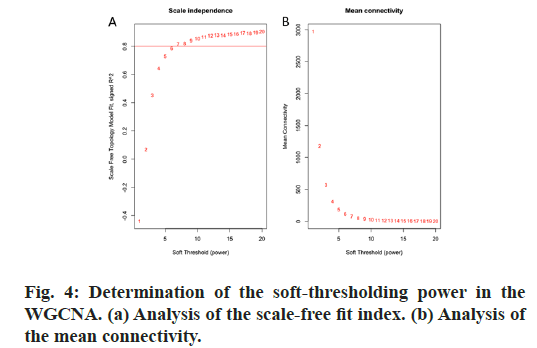
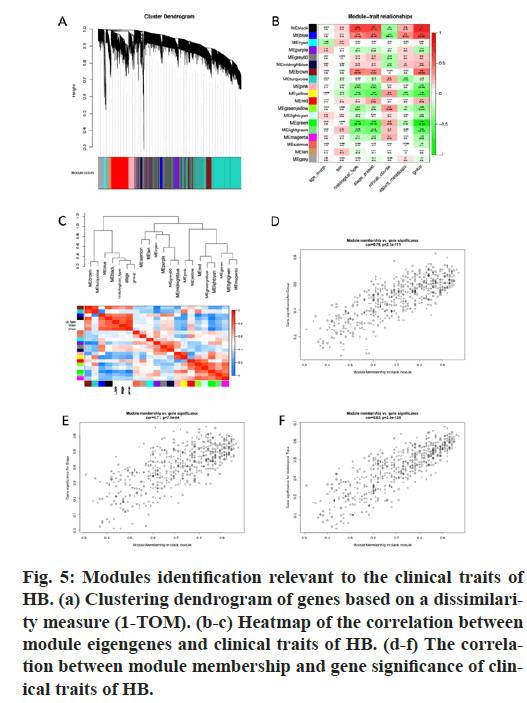
GO and KEGG pathway enrichment analyses were conducted for these differential genes. As shown in fig. 3A-F, differential genes were most enriched in small molecule catabolic process, collagen-containing extracellular matrix and coenzyme binding by GOBP, GO-CC and GO-MF, respectively. Meanwhile, differential genes were most enriched in complement and coagulation cascades by KEGG pathway analyses (fig. 3G-H).64 qualified HB samples with clinical data were all included. By the usage of the R package “WGCNA”, involved genes which have similar expression patterns were incorporating into one module. In our work, according to the calculation, β=7 was determined as the soft-threshold (fig. 4). In this way, 19 modules were identified (fig. 5A). Relevance between key module and the disease progression of HB was tested. Our results showed that genes of the black module possessed the closely relationship with tumor progression ((p=6×10- 9, R2=0.64 for histological type, p=4×10⁻⁷, R2=0.57 for PRETEXT, p=4×10-11, R2=0.7 for group, respectively ), fig. 5B-C). Moreover, we also indicated the strong correlation between gene significance and the black module (fig. 5D-F), which was considered to have more connection with tumor occurrence and development. Therefore, the black module was identified to be a clinically significant module related to HB disease progression in the dataset.
Figure 3: Analysis of GO enrichment and KEGG pathway. (a-b) Dot plot and map plot of GO biological processes (BP) enrichment analysis of DEGs. (c-d) Dot plot and map plot of GO cellular component (CC) enrichment analysis of DEGs. (e-f) Dot plot and map plot of GO molecular functions (MF) enrichment analysis of DEGs. (g-h) Dot plot and net plot of KEGG pathway analysis of DEGs.
Figure 5: Modules identification relevant to the clinical traits of HB. (a) Clustering dendrogram of genes based on a dissimilarity measure (1-TOM). (b-c) Heatmap of the correlation between module eigengenes and clinical traits of HB. (d-f) The correlation between module membership and gene significance of clinical traits of HB.
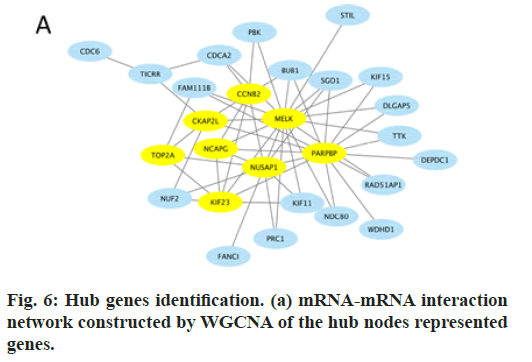
In this study, by the usage of R package “WGCNA”, 8 genes were identified as hub genes and an 8-mRNA signature was established, which had high connectivity in the black module and were also DEGs in GSE131329 (fig. 6). Therefore, Cyclin B2 (CCNB2), Cytoskeleton Associated Protein 2 Like (CKAP2L), Maternal Embryonic Leucine Zipper Kinase (MELK), HB is fatal malignancy. Over the past decades, surgery alone can cure very few patients with HB, mostly ones with the pure fetal HB variant [19]. With the help of preand pro-operative chemotherapy, the overall survival rate has increased from 30 % to more than 70 % [20,21]. Despite of the increasing survival rate, the occurrence and the development of HB still remain unclear. Therefore, prediction of HB is still arduous and urgent.
From past to nowadays, tumor biomarkers have been used in patients with HB. An elevated serum alphafetoprotein (AFP) level was observed in approximately 90 % of HB patients at diagnosis [21]. Other two studies have demonstrated that HB patients with low AFP level (<100 ng/ml) at diagnosis are a risk factor, which could lead to negative response to chemotherapy and ultimate poor outcome [22,23]. However, this tumor marker is not specific to HB, since its elevation can also be observed in hepatocellular carcinoma (HCC) or hepatitis. It has also been reported in numerous studies that β-catenin/ Wnt pathway, deletion and mutation of Catenin Beta 1 (CTNNB1) are important in the pathogenesis of HB [7,9,24]. In a recent study, a signature has been designed, and the combination of four genes (Hydroxysteroid 17-Beta Dehydrogenase 6 (HSD17B6), Integrin Subunit Alpha 6 (ITGA6), TOP2A and Vimentin (VIM)), is established and observed to distinguish each subgroup [25]. Nevertheless, the association with the genetic prediction with some clinical features, such as tumor size, stage, remains controversial.
The PRE-Treatment extent of tumor (PRETEXT) system, which was established as part of the risk stratification and treatment planning process, has become the most widely used staging system for pediatric HB patients nowadays. This staging system has been certified useful, not only in selecting treatment plans, but also in predicting overall and disease-free survival outcomes [26]. However, this system still had some limitations. It is lack of assessment on account of dependable data [27]. It might also neglect the backgrounds of different gene and epigenetics among different tumor subtypes. In conclusion, disease progression prediction of HB still remains obstacle, thus a multi-mRNA signature was conducted to improve more accurately predicting the disease progression for HB patients.
In this study, firstly we selected a dataset from GEO database. Then, we checked data quality, eliminated outlier samples, and finally obtain 1292 DEGs conform to selection standards (adj.pval<0.05 and |FC|≥2). WGCNA was utilized to identify the most relevant modules and genes associated with clinical features, such as histological type and stage of HB. Finally, a multiple-mRNA signature was established for HB patients. The black module was identified and selected, in which 8 genes were screened as hub genes.
Functions of majority of the 8 genes have been demonstrated in numerous tumor-related studies. Qian et al. found that overexpression of CCNB2 protein was associated with clinical progression and poor prognosis in non-small cell lung cancer [28]. Shubbar et al. also confirmed that cytoplasmic CCNB2 may act as an oncogene and could be a potential prognosis biomarker in breast cancer [29]. Xiong et al. found that CKAP2L played an important role in lung adenocarcinoma (LAD) development and could predict poor prognosis of LAD patients [30]. Chen et al. found that MELK enhances tumorigenesis, migration, invasion and metastasis of esophageal squamous cell carcinoma cells via activation of forkhead box protein M1 (FOXM1) signaling pathway [31]. Xu et al. demonstrated a similar result which suggested that the MELK axis may play a crucial role in the disease progression of endometrial carcinoma (EC) [32]. Zhang et al. found that the knockdown of TOP2A could increase the sensitivity to paclitaxel in EC cells [33]. Abraham et al. demonstrated that TOP2A was required for T-cell factor transcription as a DNA-binding factor, thus could be an epithelialmesenchymal transition regulator and be the metastatic colorectal cancer therapeutic target [34]. Gong et al. found that NCAPG functioned as an oncogene in HCC and its overexpression could promote proliferation and antiapoptosis of tumor cells through PI3K/AKT/ FOXO4 pathway activation [35]. Meanwhile, Zhang et al. found that expression level of NCAPG in clinical HCC samples was in accordance with recurrence and poor survival [36]. Nicolae et al. showed that in myeloid leukemia cells, PARPBP was overexpressed, and PARPBP downregulation could reduce cell proliferation via the activation of the NF-κB pathway [37]. Zhang et al. found that NUSAP1 was overexpressed in ovarian cancer tissues and cell lines, and knocking down NUSAP1 could lead to significantly proliferation and colony forming, migration and invasion ability inhibition, meanwhile promote apoptosis and affect cell cycle distribution [38]. Also, Gao et al. found that NUSAP1 was upregulated in bladder cancer, and its expression was relevant to the poor prognosis of patients via the TGF-β signaling pathway [39]. Li et al. found that KIF23 expression was correlated with poor prognosis of gastric cancer and associated between KIF23 and Pathological Tumor-Node-Metastasis (pTNM) stage [40]. In summary, these 8 genes had been researched in many other types of tumors, while few studies involved in HB, both in clinical and basic fields.
There were still some limitations in our study. Firstly, we only used a dataset of HBs in only one database. Because of the lack of clinical information (such as recurrence free survival time and overall survival time), the GEO dataset could not be used to construct a more precise model. Besides, the most commonly used database, The Cancer Genome Atlas (TCGA) database, does not include HB. Secondly, in addition to mRNA, the predictive value of whole transcriptome, including microRNA, lncRNA and circRNA in tumor prognosis and outcomes had been validated to some extent. Multi-dimensional data analysis could enhance the predictive accuracy and efficiency. Finally, because of the lack of clinical samples, this signature model needs to be further validated. In conclusion, our study established an 8-mRNA signature for the prediction of the occurrence and development of HB, which might serve as potential molecular targets for personalized medicine in HB.
Therefore, it is found that the chondrorepair activity of progenitor cells can be stimulated by the modification of various genes in stem cells by the independent gene transduction of slow virus vector, which provides the basis for controlling the cartilage repair process after hADSCs are implanted into cartilage defects.
The benefit of co-transduction of therapeutic lentiviral vector gene repairer hADSCs provides evidence that enhancing the expression of Sox9 and knockdown β-catenin can significantly improve its cartilage repair activity in vitro.
Author’s Contributions
Bingrui Wang and Qiucheng Han have contributed equally to this research.
Conflict of Interests
The authors declared no conflicts of interest.
References
- Allan BJ, Parikh PP, Diaz S, Perez EA, Neville HL, Sola JE. Predictors of survival and incidence of hepatoblastoma in the paediatric population. Hpb 2013;15(10):741-6.
- Hadzic N, Finegold MJ. Liver neoplasia in children. Clin Liver Dis 2011;15(2):443-62.
- Czauderna P, Lopez-Terrada D, Hiyama E, Haberle B, Malogolowkin MH, Meyers RL. Hepatoblastoma state of the art: pathology, genetics, risk stratification, and chemotherapy. Curr Opin Pediatr 2014;26(1):19-28.
- von Schweinitz D. Hepatoblastoma: recent developments in research and treatment. Semin Pediatr Surg 2012;21(1):21-30.
- Spector LG, Birch J. The epidemiology of hepatoblastoma. Pediatr Blood Cancer 2012;59(5):776-9.
- Hiyama E. Pediatric hepatoblastoma: diagnosis and treatment. Transl Pediatr 2014;3(4):293-9.
- Matsumoto S, Yamamichi T, Shinzawa K, Kasahara Y, Nojima S, Kodama T, et al. GREB1 induced by Wnt signaling promotes development of hepatoblastoma by suppressing TGFbeta signaling. Nat Commun 2019;10(1):3882.
- Beck A, Trippel F, Wagner A, Joppien S, Felle M, Vokuhl C, et al. Overexpression of UHRF1 promotes silencing of tumor suppressor genes and predicts outcome in hepatoblastoma. Clin Epigenetics 2018;10:27.
- Cairo S, Armengol C, De Reynies A, Wei Y, Thomas E, Renard CA, et al. Hepatic stem-like phenotype and interplay of Wnt/beta-catenin and Myc signaling in aggressive childhood liver cancer. Cancer Cell 2008;14(6):471-84.
- Edgar R, Domrachev M, Lash AE. Gene Expression Omnibus: NCBI gene expression and hybridization array data repository. Nucleic Acids Res 2002;30(1):207-10.
- Clough E, Barrett T. The Gene Expression Omnibus Database. Methods Mol Biol 2016;1418:93-110.
- Barrett T, Wilhite SE, Ledoux P, Evangelista C, Kim IF, Tomashevsky M, et al. NCBI GEO: archive for functional genomics data sets--update. Nucleic Acids Res 2013;41(D1):D991-5.
- Pei G, Chen L, Zhang W. WGCNA Application to Proteomic and Metabolomic Data Analysis. Methods Enzymol 2017;585:135-58.
- Langfelder P, Horvath S. WGCNA: an R package for weighted correlation network analysis. BMC Bioinformatics 2008;9:559.
- Kauffmann A, Gentleman R, Huber W. arrayQualityMetrics-a bioconductor package for quality assessment of microarray data. Bioinformatics 2009;25(3):415-6.
- Davis S, Meltzer PS. GEOquery: a bridge between the Gene Expression Omnibus (GEO) and BioConductor. Bioinformatics 2007;23(14):1846-7.
- Ritchie ME, Phipson B, Wu D, Hu Y, Law CW, Shi W, et al. limma powers differential expression analyses for RNA-sequencing and microarray studies. Nucleic Acids Res 2015;43(7):e47.
- Yu G, Wang LG, Han Y, He QY. clusterProfiler: an R package for comparing biological themes among gene clusters. OMICS 2012;16(5):284-7.
- Malogolowkin MH, Katzenstein HM, Meyers RL, Krailo MD, Rowland JM, Haas J, et al. Complete surgical resection is curative for children with hepatoblastoma with pure fetal histology: a report from the Children's Oncology Group. J Clin Oncol 2011;29(24):3301-6.
- Roebuck DJ, Perilongo G. Hepatoblastoma: an oncological review. Pediatr Radiol 2006;36(3):183-6.
- Meyers RL. Tumors of the liver in children. Surg Oncol 2007;16(3):195-203.
- Semeraro M, Branchereau S, Maibach R, Zsiros J, Casanova M, Brock P, et al. Relapses in hepatoblastoma patients: clinical characteristics and outcome--experience of the International Childhood Liver Tumour Strategy Group (SIOPEL). Eur J Cancer 2013;49(4):915-22.
- De Ioris M, Brugieres L, Zimmermann A, Keeling J, Brock P, Maibach R, et al. Hepatoblastoma with a low serum alpha-fetoprotein level at diagnosis: the SIOPEL group experience. Eur J Cancer 2008;44(4):545-50.
- Takayasu H, Horie H, Hiyama E, Matsunaga T, Hayashi Y, Watanabe Y, et al. Frequent deletions and mutations of the β-catenin gene are associated with overexpression of cyclin D1 and fibronectin and poorly differentiated histology in childhood hepatoblastoma. Clin Cancer Res 2001;7(4):901-8.
- Hooks KB, Audoux J, Fazli H, Lesjean S, Ernault T, Dugot-Senant N, et al. New insights into diagnosis and therapeutic options for proliferative hepatoblastoma. Hepatology 2018;68(1):89-102.
- Aronson DC, Schnater JM, Staalman CR, Weverling GJ, Plaschkes J, Perilongo G, et al. Predictive value of the pretreatment extent of disease system in hepatoblastoma: results from the International Society of Pediatric Oncology Liver Tumor Study Group SIOPEL-1 study. J Clin Oncol 2005;23(6):1245-52.
- Meyers RL, Maibach R, Hiyama E, Häberle B, Krailo M, Rangaswami A, et al. Risk-stratified staging in paediatric hepatoblastoma: a unified analysis from the Children's Hepatic tumors International Collaboration. Lancet Oncol 2017;18(1):122-31.
- Qian X, Song X, He Y, Yang Z, Sun T, Wang J, et al. CCNB2 overexpression is a poor prognostic biomarker in Chinese NSCLC patients. Biomed Pharmacother 2015;74:222-7.
- Shubbar E, Kovács A, Hajizadeh S, Parris TZ, Nemes S, Gunnarsdóttir K, Einbeigi Z, Karlsson P, Helou K. Elevated cyclin B2 expression in invasive breast carcinoma is associated with unfavorable clinical outcome. BMC Cancer 2013;13(1):1.
- Xiong G, Li L, Chen X, Song S, Zhao Y, Cai W, et al. Up-regulation of CKAP2L expression promotes lung adenocarcinoma invasion and is associated with poor prognosis. Onco Targets Ther 2019;12:1171-80.
- Chen L, Wei Q, Bi S, Xie S. Maternal Embryonic Leucine Zipper Kinase Promotes Tumor Growth and Metastasis via Stimulating FOXM1 Signaling in Esophageal Squamous Cell Carcinoma. Front Oncol 2020;10:10.
- Xu Q, Ge Q, Zhou Y, Yang B, Yang Q, Jiang S, et al. MELK promotes Endometrial carcinoma progression via activating mTOR signaling pathway. EBioMedicine 2020;51:102609.
- Zhang S, Jiang H, Xu Z, Jiang Y, She Y, Huang X, et al. The resistance of esophageal cancer cells to paclitaxel can be reduced by the knockdown of long noncoding RNA DDX11-AS1 through TAF1/TOP2A inhibition. Am J Cancer Res 2019;9(10):2233-48.
- Abraham AD, Esquer H, Zhou Q, Tomlinson N, Hamill BD, Abbott JM, et al. Drug Design Targeting T-Cell Factor-Driven Epithelial-Mesenchymal Transition as a Therapeutic Strategy for Colorectal Cancer. J Med Chem 2019;62(22):10182-203.
- Gong C, Ai J, Fan Y, Gao J, Liu W, Feng Q, et al. NCAPG Promotes The Proliferation Of Hepatocellular Carcinoma Through PI3K/AKT Signaling. Onco Targets Ther 2019;12:8537-52.
- Zhang Q, Su R, Shan C, Gao C, Wu P. Non-SMC Condensin I Complex, Subunit G (NCAPG) is a Novel Mitotic Gene Required for Hepatocellular Cancer Cell Proliferation and Migration. Oncol Res 2018;26(2):269-76.
- Nicolae CM, O'Connor MJ, Schleicher EM, Song C, Gowda R, Robertson G, et al. PARI (PARPBP) suppresses replication stress-induced myeloid differentiation in leukemia cells. Oncogene 2019;38(27):5530-40.
- Zhang Y, Huang K, Cai H, Chen S, Sun D, Jiang P. The role of nucleolar spindle-associated protein 1 in human ovarian cancer. J Cell Biochem 2020;121(11):4397-405.
- Gao S, Yin H, Tong H, Zhan K, Yang G, Hossain MA, et al. Nucleolar and Spindle Associated Protein 1 (NUSAP1) Promotes Bladder Cancer Progression Through the TGF-beta Signaling Pathway. Onco Targets Ther 2020;13:813-25.
- Li XL, Ji YM, Song R, Li XN, Guo LS. KIF23 Promotes Gastric Cancer by Stimulating Cell Proliferation. Dis Markers 2019;2019:9751923.
