- *Corresponding Author:
- Qin Zhang
Department of Rheumatology and Immunology, The Second Affiliated Hospital of Zhejiang Traditional Chinese Medicine University, Hangzhou, Zhejiang 310005, China
E-mail: zqzjtcm@163.com
| This article was originally published in a special issue, “Advanced Targeted Therapies in Biomedical and Pharmaceutical Sciences” |
| Indian J Pharm Sci 2023:85(1) Spl Issue “98-107” |
This is an open access article distributed under the terms of the Creative Commons Attribution-NonCommercial-ShareAlike 3.0 License, which allows others to remix, tweak, and build upon the work non-commercially, as long as the author is credited and the new creations are licensed under the identical terms
Abstract
Systemic lupus erythematosus are all involved autoimmune illnesses with similar clinical, genetic and pathogenic characteristics. However, it is still uncertain what characteristics these disorder’s deoxyribonucleic acid methylation patterns have in common. To determine the typical methylation patterns of autoimmune illnesses, we undertook to analyze the methylation data for numerous inflammatory disorders in a unified manner, which included samples from systemic lupus erythematosus. In clusters of differentiation 4+ T cells, we discovered 15 289 locations that were differently methylated in patients with various autoimmune diseases compared to controls in medical imaging. In addition to this, the artificial intelligence plays a greater role in predicting the model of therapeutic effect of systemic lupus erythematosus. We determined that genes involved in the type I interferon pathway were significantly enriched at the regions that displayed the most substantial differential methylation. Interferon-induced protein 44-like is another interferon-related gene, but it is not annotated by gene ontology. The results showed that clusters of differentiation 4+ T cells from systemic lupus erythematosus patients often had hypo methylation of interferon-related genes; moreover interferon-related gene deoxyribonucleic acid methylation patterns may be useful diagnostic indicators for systemic lupus erythematosus.
Keywords
Systemic lupus erythematosus, medical imaging, traditional Chinese medicine, deoxyribonucleic acid methylation, interferon, artificial intelligence, clusters of differentiation 4+
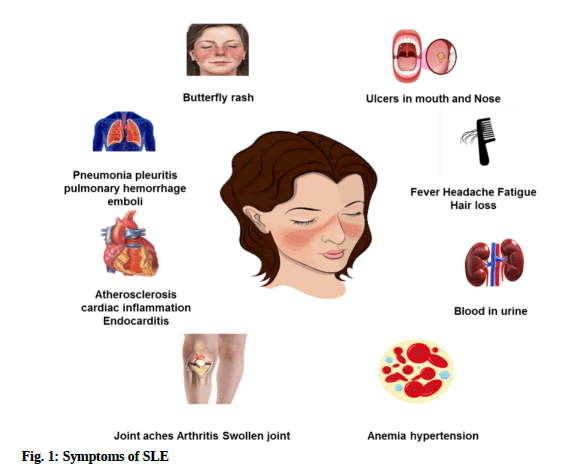
People who have the autoimmune disease known as Systemic Lupus Erythematosus (SLE) can have damage to several different tissues and body systems, the most prominent of which are the “kidneys and the cardiovascular system”. There are various technologies used for evaluating the function of human body. The term "medical imaging" encompasses a wide range of techniques used to obtain visuals of the human body for the purposes of diagnosis, monitoring and treatment. Different medical technologies provide unique insights about disease, injury and treatment outcomes in a given body part. Patients suffering from SLE appear to experience relapses regularly and the condition has a high rate of both death and disability. Unfortunately, there is now no effective treatment available for people who have SLE, which causes a significant burden not only on individuals but also on society as a whole. The synthesis of a significant number of antigens, which are subsequently formed in the biological membranes, cytoplasm and lymphocytes, is one of the characteristics that set SLE apart from other autoimmune diseases[1]. While doing so, these antibodies attach to important proteins in the circulatory system and cause particular alterations, both of which help make a diagnosis of SLE. Clinical investigations have indicated that the symptoms of the patient and the findings of the physical examination, such as thrombocytopenia, are used to diagnose SLE; nevertheless, it is still possible for the diagnosis to be incorrect[2]. Therefore, studying the root causes of SLE and looking for specific targets and markers is crucial for developing effective treatments and identifying at-risk individuals at an early stage. Autoimmune diseases are the lack of immunological sensitivity to one’s own "self-antigens" is the defining feature of this condition, incorrect stimulation of inflammatory mechanisms and harm to targeted major organs[3]. There are currently over a hundred different forms of autoimmune disorders and they are one of the leading causes of illness and mortality, affecting 5 %-10 % of the global population[4]. Fig. 1 depicts the symptoms of SLE.
High rates of disability and comorbidity, in addition to rising treatment costs, place a significant financial strain on society due to autoimmune disorders. However, there is still much we don't know about autoimmune disorders, including their root causes and how they develop. The pathophysiology of autoimmune illnesses involves a wide variety of epigenetic changes, including regulation of non-coding Ribonucleic Acid (RNA), nucleosome remodeling, nucleosome modifications and Deoxyribonucleic Acid (DNA) methylation[5]. DNA methylation, the best-studied regulatory mechanism and a well-established regulatory regulator have been linked to the regulation of both messenger RNA and microRNA production[6]. Recent years have seen a surge in the number of research that suggests that aberrant methylation of DNA in gene promoter regions is implicated in the pathophysiology of SLE. Multiple recent types of research have revealed that the development of various autoimmune disorders shares many similarities. Consequently, a more complete understanding of the etiology of autoimmune disorders may be gleaned from an integrative analysis of multiple such conditions. Common examples of autoimmunity include SLE. Autoantibody synthesis, immunological abnormality induction in Clusters of Differentiation (CD) 4+ or CD8+ T cells and numerous risk loci are all features shared by these disorders, which affect women more frequently than men. This suggests that there may be shared mechanisms in the development of several autoimmune disorders. Scientists studying neuroplasticity investigate how contextual signals might modify the expression of genes in a way that is heritable but does not change the DNA sequence. Epigenomics networks are an essential connection among genetic and environment-related variables of illness and several stressors may impact the aetiology of inflammatory disease[7]. DNA methylation instability has lately been implicated in the pathogenesis of inflammatory disorders such as Autoimmune Encephalomyelitis (AE), Rheumatoid Arthritis (RA) and SLE. The study evaluates the instability of DNA methylation using artificial intelligence and medical imaging techniques. To better understand the pathogenesis of these diseases, more study of their DNA methylation patterns is needed.
SLE is distinguished by a wide range of clinical signs, a complex illness history and many additional disciplines that affect the kidney, blood, nerves, etc. Many issues, including lupus complications during pregnancy, opportunistic infections associated with lupus and malignancies, are still not addressed by the research. Additionally, very uncommon organ involvement is also gaining more and more attention. Examples include pulmonary hypertension related to lupus, albumin enteropathy and lupus paired with pseudo-intestinal obstruction[8].Clarifying the immunological pathophysiology and therapy of SLE was the goal of this review. The primary pathophysiology of SLE is the loss of personality. Through the cellular apparatus of cytokines, complementing, humeral immunity and kinases, the innate and adaptive immune networks are connected. Clinical studies have evaluated treatments aimed at potential immune targets. Most of them did not demonstrate superior safety and effectiveness to conventional therapies. But new targeted therapies are continuously being investigated[9]. In the United States of America (USA), Hydroxychloroquine (HCQ) has just been administered to most SLE patients. Given more current recommendations, the sole strength available (200 mg tablets) may restrict the flexibility and ability to precisely dose lupus patients. To evaluate the state of HCQ acceptability and compliance, the Lupus Foundation of America conducted survey[10]. Kinase inhibitors and biological that target certain molecules are anticipated to be quite successful and to have few side effects, although they can occasionally result in opportunistic infections or the reactivation of viruses. A growing problem is the creation of medications with a balanced efficacy and safety profile[11]. This review’s objective is to compile information on SLE therapy that has been available in the previous 3 y. Studies examining possible therapies using medical imaging techniques for severe lupus symptoms such as lupus nephritis will be highlighted. Several treatment medications are available for SLE, however, the illness still has a high morbidity rate[12]. Treatments that target IFN receptors directly and block the actions of all type I Interferons (IFNs) show promise for decreasing SLE-related disability and progression. In phase IIb investigation, the results were promising for anifrolumab (previously MEDI546), a recombinant specific antibody that interacts with IFNAR1 subunit 1. The main endpoint of the Treatment of Uncontrolled Lupus via the Interferon Pathway-1 (TULIP-1) phase III study was not achieved. They will learn more about anifrolumab's potential as a novel SLE medication from the outcomes of ongoing phase II and phase III trials[13]. Neutrophils, a crucial element of acute inflammation, are absent from chronically inflammatory tissues, giving rise to the misconception that they are less significant in the latter. When a specific type of cell death known as Neutrophil Extracellular Trap (NET) occurs, activated neutrophils may release NETs. NETs are replete with bioactive chemicals that encourage thrombosis, inflammation and fibrosis. As a result, even though neutrophils may not be present in persistent inflammatory lesions, their leftovers may still increase the inflammatory response after their brief time in the tissues[14]. The epigenetic reprogramming and reeducation of these HSCs result in neutrophils that are ready to fight infections and respond with a heightened inflammatory response. A 27 y old woman who was given dupilumab had a rash on her face and neck. Her arms, legs and torso were affected by Atopic Dermatitis (AD) before treatment, but her forehead and head were spared. The skin lesions on her body have gotten better since the start of the dupilumab medication[15]. In this young SLE group that was well-controlled and had little comorbidities, ladies had a greater risk of infection than males did. Antimalarial were related to a decreased risk of infection, but prednisolone doses of more than 7.5 mg raised the likelihood of having[16]. SLE is difficult to treat for some individuals and is characterized by a broad assortment of symptoms. In this case study, they discuss a 51 y old lady who experienced an SLE flare that included arthritis and pleuropericarditis but did not improve with leflunomide, methotrexate, or large doses of prednisone. The patient quickly and significantly improved after beginning the belimumab medication. She is still stable now and receiving belimumab treatment[17]. Their findings using artificial intelligence provide more evidence linking diminished Regulatory T cells (Tregs) and an unbalanced Th17/Treg cell ratio to the emergence and progression of refractory SLE. The ratio of Th17 to Tregs was normalized and the total number of Tregs was increased after low-dose Interleukin-2 (IL-2) was used in conjunction with rapamycin. Therefore, immunological tolerance was induced and the illness was put into remission; this allowed for a decrease in prednisone use[18]. The development of the chemical industry in the nineteenth century allowed for the discovery and application of effective pharmaceuticals like antimalarial, capecitabine, azathioprine, immune suppressants and later, involved in the activity mofetil, which completely changed the clinical presentation and prognosis of the disease[19]. Five consecutive adult patients seeing rheumatologists for SLE supplied data. Principal-component factor analysis was used to condense the list of SLE symptoms down to a smaller set of variables based on the overlap between symptoms. Discrete patient clusters were found using a latent class cluster analysis with the factors as covariates. Both patient and doctor-reported data were compared between groups[20].
Materials and Methods
The SLE Disease Activity Index (SLEDAI) was used to evaluate disease activity in SLE patients. For this study, patients who had never been diagnosed with cancer, cardiovascular disease, an autoimmune illness, a known infectious disease, or received immunosuppressive medication made up the normal control group. Age and sex were used to match the control group to the sick group[21].
Data preprocessing for methylation:
Input data in the shape of IDAT files were initially checked for accuracy and prepared, and with the help of the Bio conductor package RnBeads (R Core Team, 2013). Each trial's IDAT data was processed separately from the others. Those hybridizing probes were ruled out of the further study because their sequence overlapped with Single-Nucleotide Polymorphism (SNP) or because they were found to be too similar to a large number of chromosomal locations. The "greedy cut" method was used to exclude “probes” by detecting “p>0.05” within any of the datasets. Additionally, “probes” with a lot of missing results and those on sex chromosomes were filtered out. Then, background subtraction was carried out via the "noob" technique. The methylation beta readings were then subjected to Beta-Mixture Quantile Normalization (BMIQ) to correct the variation brought on by the various kinds of probes (type I and type II).
Batch normalization and data integration:
The illnesses’ preprocessed data were standardized into a single format. Then, methylation beta values from samples in CD4+ sample subsets from various illness datasets were combined. The SVA program was used to perform batch normalization to eliminate batch effects in arrays used for samples of various illnesses. In most cases, the medical imaging techniques are used in the process of batch normalization.
Analysis of differential methylation:
Different testing corrections have been applied to the raw p values employing “Benjamini and Hochberg's method False Discovery Rate (FDR)”. Differentially methylated Cytosine and Guanine Dinucleotides (CpGs) sites were identified as those having “p values after an FDR of 0.01”. g: Profiler was used to do further “Gene Ontology (GO)” analysis on the “CpGs with the greatest methylation variance (n=50)”.
Methylation site features of gene and CpG islands:
The activation sites positions relative to transcripts and CpG island regional groups were identified using the information provided by Illumina. It was agreed that the gene product included the Transcription Start Sites (TSS) 1500, TSS200, 5′ Untranslated region (5'-UTR) and the first exon of a protein. CpG motifs in such transcripts were cataloged separately according to their locations.
Clustering analysis with Analysis of Variance (ANOVA):
Two-way ANOVA was employed to compare methylated beta values throughout many groups of patients with different diseases. “The top 50 CpG sites with the most variation across all treatment populations were subjected to a cluster formation analysis using two-way ANOVA to evaluate the strength of the disease connection. The most common DMS (n=50) and DMS at type I IFN-related genes were also analyzed using clustering. In order to visualize the cluster analysis findings, heat maps were employed.
Meta-analysis:
The number of samples averages and variance and standard deviation of individual “CpG site methylation beta values”, such as each disease were determined for the control and treatment groups. The metafor software was then used to do a meta-analysis. Dersimonian and Laird random effects modeling were used to pool the data and compute the results using the artificial intelligence techniques.
Results and Discussion
We gathered Illumina Methylation 45 000 “microarray data” from “116 patients with SLE and 117 matching controls” in “CD4+ T cells” to identify the commonality across several autoimmune illnesses SLE. The data were gathered from open databases and our earlier research. Supplemental Table 1 lists the patients and controllers clinical features can be accessed through medical imaging techniques. In addition to the treatments that were previously being utilized, such as acupuncture, Chinese Herbal Medicine (CHM) and Belimumab, we assessed testing’s such as (Erythrocyte Sedimentation Rate (ESR), (Complete Blood Count (CBC)," Urine routine and Direct Coombs test.
| CD4+ T cells | |||
|---|---|---|---|
| Gene | Cases | Controls | FDR |
| IFI44L | 0.69 | 0.81 | 5.02×10⁻¹⁵ |
| EIF2AK2 | 0.22 | 0.32 | 9.21×10⁻¹⁶ |
| IFIT1 | 0.83 | 0.91 | 1.30×10⁻¹¹ |
| PARP9-DTX3L | 0.54 | 0.68 | 3.99×10⁻¹² |
| MX1 | 0.6 | 0.76 | 9.33×10⁻¹¹ |
| UPF3A | 0.35 | 0.24 | 3.18×10⁻⁹ |
| ETV3 | 0.34 | 0.23 | 1.78×10⁻⁹ |
| PARP12 | 0.66 | 0.74 | 4.36×10⁻⁹ |
| OAS1 | 0.08 | 0.11 | 5.21×10⁻⁹ |
| USP18 | 0.58 | 0.7 | 4.36×10⁻⁹ |
| IRF7 | 0.66 | 0.72 | 7.39×10⁻⁹ |
| C10orf99 | 0.46 | 0.4 | 9.57×10⁻⁹ |
| CD5 | 0.21 | 0.12 | 1.44×10⁻⁸ |
| INPP4A | 0.36 | 0.25 | 1.10×10⁻⁸ |
| FASLG | 0.3 | 0.2 | 3.12×10⁻⁸ |
| LAPTM5 | 0.18 | 0.11 | 1.82×10⁻⁸ |
| FXYD2 | 0.29 | 0.21 | 2.00×10⁻⁸ |
| TSPAN4 | 0.47 | 0.53 | 3.99×10⁻⁸ |
| TBC1D10C | 0.28 | 0.18 | 3.60×10⁻⁸ |
| RSAD2 | 0.09 | 0.15 | 3.99×10⁻⁸ |
Table 1: DNA Methylation profiles of CD4+ T Lymphocytes show significant differences between cases and controls.
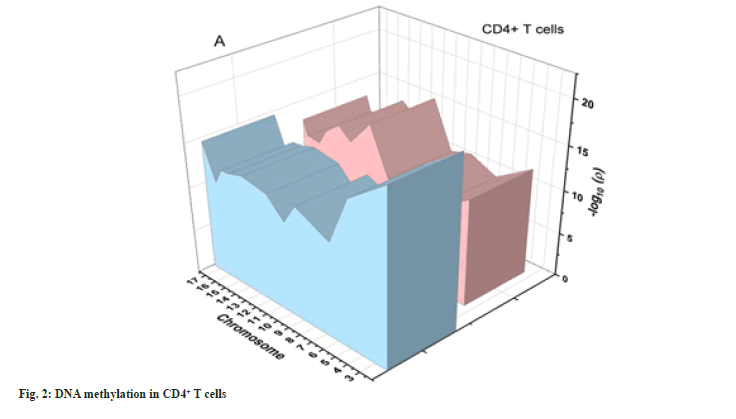
DNA sequencing by comparing the DNA methylation patterns of patients to those of healthy controls in CD4+ cell subsets, we were able to recognize shared genomic changes are associated with these autoimmune diseases. We found 15 289 in CD4+ T cells after performing severe production quality and differential methylation analyses. Methylation patterns of CD4+ T cells are shown as Manhattan plots in fig. 2. In this graph, the CpG site’s chromosomal locations (x-axis) are plotted against their-log 10 (p value) values (y-axis).
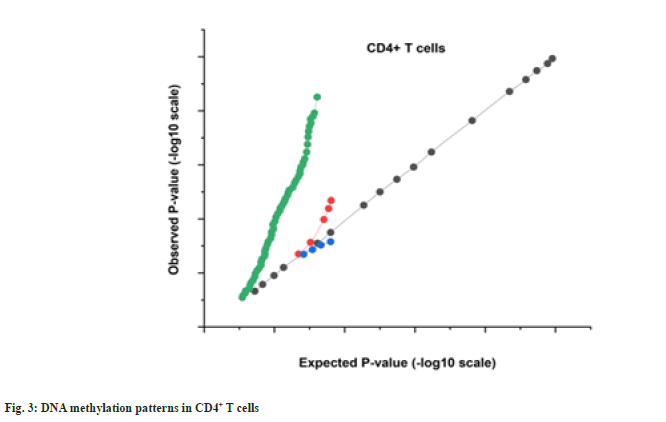
More hypo methylated sites vs. hyper methylated sites have been found in the CD4+ T cell activation database, which is consistent only with the percentage in SLE (nearly 50 % of the transcriptional CpGs detected, correspondingly, are hypo methylated) but dissimilar to the profile reported in malignancy. We also discovered that the majority of DMS were situated within genes, rather than on CpG islands (supplementary more than 30 % of the DMS were found within promoter sequences and over 40 % were found in the intragenic (body) territories. Methylation patterns for CD4+ T cells are shown as QQ plots in fig. 3.
Genes associated with the most abundant (n=50) DMS across all cell types were subjected to a GO analysis to identify their shared functional properties as part of the DMG. “Type I IFN-related genetic traits in CD4+ T cells may play a role in the development of autoimmune disease, SLE, according to the analysis of the CD4+, which disclosed that the type I interferon up regulating, response to type I interferon and cells respond to type I interferon were the majority achievers GO terms.
To be more accurate, we concentrated on the “type I IFN-related genes” that showed the most variation from illness and control samples. Then, we used meta-analysis to simultaneously monitor the methylation status of these genes in disease pools as well as individual disorders. This allowed us to determine which genes showed the most variation. A significant methylation difference was found to exist between the patients and the controls according to the majority of the gene test results, which were five out of a total of six. Although we were unable to uncover differential methylation of every expression in every illness, the overall methylation rates of the genes are significantly lower in SLE. Hence, the medical imaging process is used for intervening the human function. This is even though we were unable to discover differential methylation of every ailment. This leads one to believe that hypo-methylation, which is a defining characteristic of type I IFN, is present in a variety of auto-immune diseases. Based on the DMS at the “type I IFN-related gene”, it is possible to differentiate the vast majority of clinical specimens from controls.
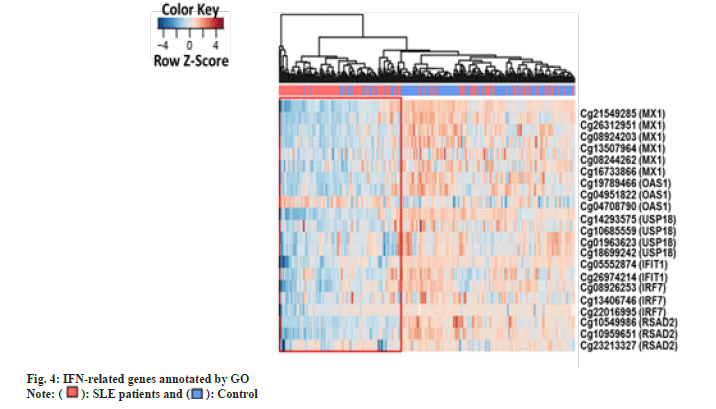
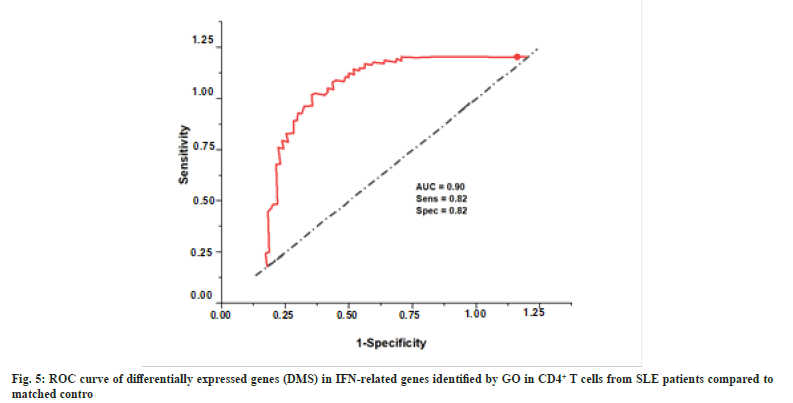
We intended to see whether the methylation levels of these genes may be diagnostic after finding substantial “hypo methylation of type I IFN associated genes identified by GO (IFIT1, IRF7, MX1, Oligoadenylate Synthetase 1 (OAS1), Ubiquitin-Specific Protease 18 (USP18), Radical S-Adenosyl Methionine Domain Containing 2 (RSAD2)) in CD4+ T cells of SLE patients compared with controls. Therefore, we analyzed the methylation status of type I IFN-related genes in CD4+ T cells using logistic regression. All the DMS on type I IFN-related genes among patients and control subjects were analyzed using Receiver Operator Characteristic (ROC) curves”. In fig. 4, we see a heat map of differentially expressed genes (DMS) in CD4+ T cells that are associated with IFNs as described by GO. The sample clustering tree is displayed in the upper left corner, with each column representing a random technique and each row representing the average methylation amount across all samples for a given CpG site.
Fig. 5 shows that the Area Under the Curve (AUC) for predicting 21 DMS methylation levels is 0.90, with a specificity and sensitivity of 0.82.
We generated “ROC curves for DMS” discovered on “IFIT1, IRF7, MX1, OAS1, USP18, and RSAD2” to further investigate the diagnostic usefulness of each “type I IFN-related gene” revealed. By using artificial intelligence techniques, this ROC curve has been evaluated. When comparing SLE patients and control subjects, the AUC for the 2 DMS in the IFIT1 study was 0.82 (sensitivity: 0.84 and specificity: 0.71). IRF7 research showed that between SLE patients and healthy controls, the AUC value for the three-dimensional multi-stage (DMS) was 0.78 (sensitivity: 0.74 and specificity: 0.75). “When comparing SLE patients to healthy controls, the AUCs were 0.92 times higher in the former group. When comparing SLE patients and healthy controls using the MX1 analysis, the AUC value of the 6-DMS was 0.80 (Sensitivity: 0.72, specificity: 0.78). The AUCs were 0.92, which is considerably higher in SLE patients than in healthy controls. When comparing SLE patients and healthy controls using the OAS1 analysis, the AUC value of the 3 DMS was 0.80 (sensitivity: 0.82 and specificity: 0.66). The AUCs were greater in SLE patients (relative to controls) (0.89 vs. 0.74). These variables are carried out by using medical imaging techniques. AUCs were 0.89 and significantly higher in SLE patients relative to healthy controls. When comparing SLE patients and healthy controls using the RSAD2 analysis, the AUC value of the 3 DMS was 0.81 (sensitivity: 0.83 and specificity: 0.69). The AUCs were greater in “SLE patients” 0.88.
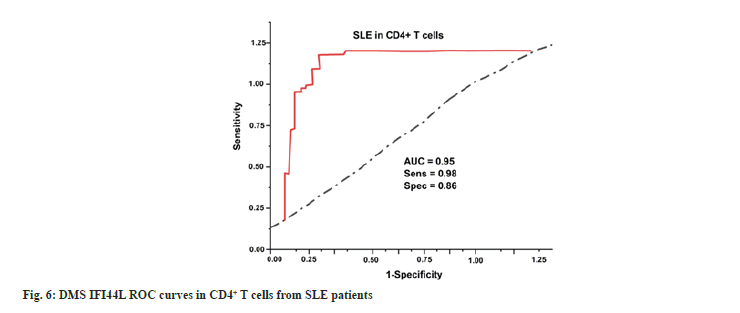
GO did not identify Interferon-Induced Protein 44-Like (IFI44L), another “type I IFN-related gene”, in type I Mitochondrial words but our integrated analysis identified it to be considerably hypo methylated in autoimmune disorders. Researchers have shown that IFI44L methylation status may be used as a biomarker in the identification of an autoimmune illness. We thus conducted a logistic regression study based on IFI44L methylation patterns in CD4+ T lymphocytes to assess its diagnostic value in SLE. Diagnosis efficacy for the abovementioned inflammatory illnesses was shown by generating a coefficient of determination in both T cell subsets using the differentially methylated CpG site, cg06872964, employed in this investigation. According to the results, the AUC for the CD4+ subgroup in treated patients vs. controls was 0.80.
Our findings support the hypothesis that IFI44L DNA methylation abnormalities are a hallmark of autoimmune disorders. DNA methylation signals in the CD4+ fraction are also comparable in SLE. Fig. 6 displays the correlation coefficients of DMS on IFI44L in CD4+ T cells from SLE patients.
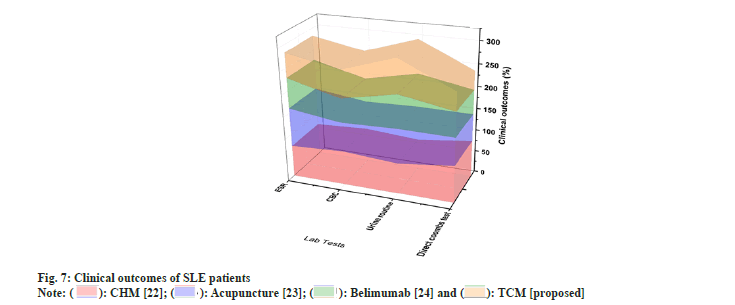
Clinical outcomes of SLE patients are assessed using the lab reports such as ESR, CBC, urine routine and Direct Coombs test. These datasets are processed in medical imaging. Fig. 7 and Table 2 depict the clinical outcomes of SLE patients for treating Traditional Chinese Medicine (TCM).
| Methods | ESR | CBC | Urine routine | Direct Coombs test |
|---|---|---|---|---|
| CHM | 72 | 88 | 68 | 55 |
| Acupuncture | 78 | 66 | 54 | 63 |
| Belimumab | 70 | 78 | 75 | 76 |
| TCM (proposed) | 85 | 62 | 55 | 42 |
Table 2: Findings of clinical outcomes of SLE Patients.
In order to evaluate the data set, the study used artificial intelligence technique called hierarchical clustering. This study employed hierarchical clustering and differentially methylation analysis to discover commonalities in “CD4+ T cells” in treated patients. We discovered that patients with SLE had comparable DNA methylation profiles. Furthermore, we found extensive hypo methylation at CpG sites near genes implicated in “type I IFN” signaling in “CD4+ T cells”, suggesting that “type I IFN” sensitivity may be increased in SLE patients. Additionally, “type I IFN-related genes”' methylation status has been identified as a possible biomarker of SLE. In this research, we assess the ESR, CBC, urine routine and Direct Coombs test using the existing methods such as CHM, acupuncture and belimumab are used. Overall lab tests the TCM has more effect when compared to the other existing methods. Using the CHM, easy to assume that herbal medicines are risk-free just because they're all-natural. Adverse effects of a severe nature have also been documented[22]. Acupuncture when administered by a trained professional using single-use, disposable needles, the hazards associated with acupuncture are minimal. Pain and sometimes bleeding or bruising at the injection sites are the most often reported adverse effects. The danger of infection has been greatly reduced because of the widespread adoption of disposable needles for single use[23]. Consuming Belimumab for SLE patients for problems breathing, feeling worried, having low blood pressure, feeling dizzy or fainting, having a headache, feeling nauseated, or having a rash appear on the skin are all symptoms of an allergic reaction. Severe allergic responses may occur the day of or days following Benlysta administration and can be fatal[24]. We deal with the problems listed above. Our suggested procedures (TCM) have shown to be effective for laboratory results in medical imaging.
Finally, we performed the first comprehensive investigation of methylation patterns throughout the genome in SLE with multiple autoimmune diseases. With the help of artificial intelligence, the predictive model of therapeutic effect of traditional medicine for SLE is generated. “Type I IFN” has been linked to autoimmune illnesses and this could be the reason why. We were only able to conduct a qualitative analysis of the methylation patterns of the few CpG sites that have been supplied for each gene. This limited our ability to draw any conclusions about the methylation patterns. The very substantial genomic inflating for "Human Methylation 450K accumulators" association research is most likely because the "methylation" status of "CpG sites" in the promoters of the same genes are generally strongly associated with one another; however, uncontrolled confounding variables may also play a role in this phenomenon. Furthermore, independence of the covariates is necessary for standard Genome-Wide Association Studies (GWAS)/Epigenome-Wide Association Studies (EWAS) research and the SNP-based relationship is corrected for. However, the identification of commonalities in the DNA methylation patterns of many autoimmune disorders may assist in our knowledge of the causes of these conditions, particularly the function of "type I IFN", and provide a framework for further investigation. This is because commonalities in DNA methylation patterns are associated with a wide variety of autoimmune diseases. In addition, the possible diagnostic significance of genes connected to "type I IFN" was discussed in the research. This indicates that keeping an eye on the mutation degree of these "genes as biomarkers" may help track the progress of the disease and measure the success of therapy. In this study, we evaluate the ESR, CBC, urine routine and Direct Coombs test with the current techniques such as CHM, acupuncture and belimumab. In addition, we evaluate the results of the test using artificial intelligence techniques. TCM is more effective in all lab tests when compared to other approaches that are now available. However, owing to the restricted sample size, the data were not divided into a training data set and a test data set obtained from medical imaging before carrying out the ROC analysis. This might have resulted in an inflated AUC. Because these results are from an early stage, it will be necessary to conduct more research using bigger sample sizes to validate the diagnostic value of these biomarkers.
In summary, IFN-related domains are “hypo ethylated in CD4+ T cells” from “GD/RA/SLE/SSc” individuals and the “DNA methylation” profile of these “genes” may serve as a diagnostic for SLE.
Authors’ contribution:
We developed an integrated approach of the many different disease methyl datasets, which includes samples from SLE using medical imaging and artificial intelligence technique, to discover the usual molecular mechanisms of autoimmune conditions.
Acknowledgements:
This work was supported by Zhejiang Provincial Administration of TMC, research on Risk prediction model of SLE based on interferon and methylation (Project No.2021ZZ015).
Conflict of interests:
The authors declared no conflict of interests.
References
- Durcan L, O'Dwyer T, Petri M. Management strategies and future directions for systemic lupus erythematosus in adults. Lancet 2019;393(10188):2332-43.
[Crossref] [Google Scholar] [PubMed]
- Chamani S, Moossavi M, Naghizadeh A, Abbasifard M, Majeed M, Johnston TP, et al. Immunomodulatory effects of curcumin in systemic autoimmune diseases. Phytother Res 2022;36(4):1616-32.
[Crossref] [Google Scholar] [PubMed]
- Krovi SH, Kuchroo VK. Activation pathways that drive CD4+ T cells to break tolerance in autoimmune diseases. Immunol Rev 2022;307(1):161-90.
[Crossref] [Google Scholar] [PubMed]
- Sun N, Guo H, Wang Y. Retinoic acid receptor-related orphan receptor gamma-t (RORγt) inhibitors in clinical development for the treatment of autoimmune diseases: A patent review (2016-present). Expert Opin Ther Patents 2019;29(9):663-74.
[Crossref] [Google Scholar] [PubMed]
- Al-Gahtani SN. A review of systemic lupus erythematosus (SLE): Symptoms, risk factors, treatment and health related quality of life issues. Open J Rheumatol Autoimm Dis 2021;11(4):115-43.
- Jesus D, Matos A, Henriques C, Zen M, Larosa M, Iaccarino L, et al. Derivation and validation of the SLE disease activity score (SLE-DAS): A new SLE continuous measure with high sensitivity for changes in disease activity. Ann Rheum Dis 2018;78(3):365-71.
[Crossref] [Google Scholar] [PubMed]
- Basta F, Fasola F, Triantafyllias K, Schwarting A. Systemic lupus erythematosus (SLE) therapy: The old and the new. Rheumatol Ther 2020;7(3):433-46.
[Crossref] [Google Scholar] [PubMed]
- Mohamed A, Chen Y, Wu H, Liao J, Cheng B, Lu Q. Therapeutic advances in the treatment of SLE. Int Immunopharmacol 2019;72:218-23.
[Crossref] [Google Scholar] [PubMed]
- Pan L, Lu MP, Wang JH, Xu M, Yang SR. Immunological pathogenesis and treatment of systemic lupus erythematosus. World J Pediatr 2020;16:19-30.
[Crossref] [Google Scholar] [PubMed]
- Wallace DJ, Tse K, Hanrahan L, Davies R, Petri MA. Hydroxychloroquine usage in US patients, their experiences of tolerability and adherence, and implications for treatment: Survey results from 3127 patients with SLE conducted by the Lupus Foundation of America. Lupus Sci Med 2019;6(1):e000317.
[Crossref] [Google Scholar] [PubMed]
- Tanaka Y. State-of-the-art treatment of systemic lupus erythematosus. Int J Rheum Dis 2020;23(4):465-71.
[Crossref] [Google Scholar] [PubMed]
- Liossis SN, Staveri C. What's new in the treatment of systemic lupus erythematosus. Front Med 2021;8:655100.
- Felten R, Scher F, Sagez F, Chasset F, Arnaud L. Spotlight on anifrolumab and its potential for the treatment of moderate-to-severe systemic lupus erythematosus: Evidence to date. Drug Des Devel Ther 2019:1535-43.
[Crossref] [Google Scholar] [PubMed]
- Frangou E, Vassilopoulos D, Boletis J, Boumpas DT. An emerging role of neutrophils and NETosis in chronic inflammation and fibrosis in systemic lupus erythematosus (SLE) and ANCA-associated vasculitides (AAV): Implications for the pathogenesis and treatment. Autoimm Rev 2019;18(8):751-60.
[Crossref] [Google Scholar] [PubMed]
- Jang DH, Lee JI, Bae JY, Jung HJ, Park MY, Ahn J. Facial erythema after the treatment of dupilumab in SLE patient. Allergy Asthma Clin Immunol 2020;16:1-4.
[Crossref] [Google Scholar] [PubMed]
- Prata AR, Luís M, Assunção H, da Silva JA, Inês LS. Antimalarial treatment and minimizing prednisolone are associated with lower risk of infection in SLE: A 24-month prospective cohort study. Clin Rheumatol 2022;41(4):1069-78.
[Crossref] [Google Scholar] [PubMed]
- Carrión-Barberà I, Salman-Monte TC, Castell S, Castro-Domínguez F, Ojeda F, Monfort J. Successful treatment of systemic lupus erythematosus pleuropericarditis with belimumab. Eur J Rheumatol 2019;6(3):150.
[Crossref] [Google Scholar] [PubMed]
- Zhao C, Chu Y, Liang Z, Zhang B, Wang X, Jing X, et al. Low dose of IL-2 combined with rapamycin restores and maintains the long-term balance of Th17/Treg cells in refractory SLE patients. BMC Immunol 2019;20:32.
- Felten R, Scher F, Sibilia J, Chasset F, Arnaud L. Advances in the treatment of systemic lupus erythematosus: From back to the future, to the future and beyond. Joint Bone Spine 2019;86(4):429-36.
[Crossref] [Google Scholar] [PubMed]
- Touma Z, Hoskin B, Atkinson C, Bell D, Massey O, Lofland JH, et al. Systemic lupus erythematosus symptom clusters and their association with patient-reported outcomes and treatment: Analysis of real-world data. Arthritis Care Res 2022;74(7):1079-88.
[Crossref] [Google Scholar] [PubMed]
- Gao B. Identification of feature autophagy-related genes and DNA methylation profiles in systemic lupus erythematosus patients. Med Sci Monit 2021;27:e933425.
[Crossref] [Google Scholar] [PubMed]
- Wang Y, Han M, Pedigo CE, Xie ZM, Wang WJ, Liu JP. Chinese herbal medicine for systemic lupus erythematosus: A systematic review and meta-analysis of randomized, placebo-controlled trials. Chin J Integr Med 2021;27:778-87.
[Crossref] [Google Scholar] [PubMed]
- Ignatovsky C. Acupuncture treatment for chronic pain, anxiety and fatigue associated with systemic lupus erythematosus: A case report; 2020.
- Wise LM, Stohl W. The safety of belimumab for the treatment of systemic lupus erythematosus. Expert Opin Drug Safety 2019;18(12):1133-44.
[Crossref] [Google Scholar] [PubMed]
 .
.
 .
.


