- *Corresponding Author:
- J. P. Yadav
Department of Genetics, Maharshi Dayanand University, Rohtak-124 001, India
E-mail: yadav1964@rediffmail.com
| Date of Submission | 27 June 2017 |
| Date of Revision | 22 February 2018 |
| Date of Acceptance | 20 August 2018 |
| Indian J Pharm Sci 2018;80(5):892-902 |
This is an open access article distributed under the terms of the Creative Commons Attribution-NonCommercial-ShareAlike 3.0 License, which allows others to remix, tweak, and build upon the work non-commercially, as long as the author is credited and the new creations are licensed under the identical terms
Abstract
In the present study different extracts of Acacia nilotica leaves were tested for total phenolic and flavonoid content, antioxidant activities. Extracts were also subjected to phytochemical analysis using GC-MS analytical techniques. Antioxidant potential was determined using DPPH free radical scavenging assay, hydrogen peroxide scavenging assay, metal chelating assay and β-carotene-linoleic acid assay. Methanol extract exhibited maximum antioxidant activity (94.3 %) followed by the ethyl acetate extract (90.7 %). Total phenolic content was highest in the methanol extract and total flavonoid content in ethyl acetate extract. Positive correlation was observed between the total phenolic content, total flavonoid content and antioxidant activities. Principle component analysis revealed correlation between different parameters. D-pinitol, catechol, N-2,4-dnp-L-arginine, squalene, R-limonene, 9-octadecen-12-ynoic acid, methyl ester, androst-5-en, 2(1-H)-quinolinone, heptacosane, 2-pentadecanone, 6,10,14-trimethyl, linoleic acid, γ-linoleic acid, palmitic acid, stearic acid were the main compounds present in different extracts of Acacia nilotica leaves and could serve as a possible source of natural antioxidants in food and pharmaceutical industry.
Keywords
Acacia nilotica, total phenolic content, total flavonoid content, antioxidant, principle component analysis, gas chromatography-mass spectrometry
Interaction between inherent antioxidant defence system and various reactive species inside the body has pivotal role in maintaining homeostasis, the fundamental necessity of every living being. Reactive species are by-products of physiological processes, quenched by internal defence line of enzymes, vitamins and other secondary metabolites [1]. These are usually charged moieties of oxygen and nitrogen. Current life style has led to excessive production of these reactive species, mainly due to stress and eating habits [2]. Overproduction of reactive species is the main cause of diseases like cancers, rheumatoid arthritis, atherosclerosis, asthma and diabetes [3].
Antioxidants are usually aromatic compounds, capable of terminating chain reactions via protonation [4]. Antioxidants radicalize themselves to stabilize free radicals. These then stabilize the charge by delocalization of an electron in their aromatic ring [5]. An array of secondary metabolites like phenolics [6], flavonoids [7], carotenoids [8], steroids [9] and thiol compounds [10] act as antioxidants. Antioxidants have found a promising place in food industry [11], cosmetics, antiaging products [12], healthcare [13] and pharmaceutical industry [14]. Diverse uses of antioxidants and the growing market have given the impetus to discover and develop more effective and safe antioxidants from natural sources. Plants due to their vast metabolic diversity offer great dimensions for exploring new antioxidant compounds.
Acacia nilotica is a popular cosmopolitan weed of Fabaceae family. It traces a long ethnobotanical history of use to treat cold, cough, diarrhoea, dysentery, malaria, respiratory ailments and teeth problems [15]. Various parts of A. nilotica were reported to exert antibacterial [16], antiviral, antioxidant [17], antidiabetic [18] and antimalarial activities [19]. Compounds like niloticane [20], β-sitosterol [21], γ-sitosterol [22], kaempferol [23], ethyl gallate [24] and various other gallates and catechins [25] have been isolated from this plant. Analytical detection techniques, gas chromatography with mass spectrometry (GC-MS) could be a promising tool for standardization of herbal medicine. GC-MS is an easy, time efficient method for estimation of bioactive metabolites based on their charge to mass ratio [26].
Present study was a comprehensive attempt to assess in vitro antioxidant activities of six different extracts of A. nilotica leaves and a correlation between the activities and the total phenolic and flavonoid contents. Principle component analysis (PCA) was employed as statistical validation of the correlation. Study also attempted to predict the main antioxidant compounds and phytochemical profile maps of all the six extracts used in this study with GC-MS detection technique.
Materials and Methods
Plant material collection and extract preparation
Full grown healthy leaves of A. nilotica were collected in October 2014 from Jhajjar district, Haryana, India. Sample was matched with herbarium specimen of A. nilotica (MDU 2601) available in the Department of Genetics, M. D. University, Rohtak (India). Leaves were washed properly and dried in shade. The dried leaves were ground into a coarse powder. Solvents used for extract preparation were, methanol, acetone, ethyl acetate, chloroform, benzene and petroleum ether. Leaf extracts were prepared by cold percolation method, filtered through Whatman filter paper No. 1 and concentrated with rotary vacuum evaporator.
Estimation of total phenolic content (TPC)
TPC was estimated by using Folin-Ciocalteau assay [27]. Gallic acid (Sigma-Aldrich) was used for standard curve preparation. To 1 ml of extract (1 mg/ml) or gallic acid (20, 40, 60, 80, 100 μg/ml) 100 μl of 10 % Folin-Ciocalteau reagent was added followed by 1 ml of 7 % Na2CO3 after 5 min. Final volume was adjusted to 4 ml with distilled water. After 90 min incubation, absorbance was recorded at 765 nm using a UV/Vis spectrophotometer. Results were expressed as mg/g gallic acid equivalent (GAE).
Estimation of total flavonoid content (TFC)
TFC was estimated using AlCl3 colorimetric method [28]. Quercetin (62.5, 125, 250, 500, 1000 μg/ml ) or extracts (1 mg/ml) were mixed with 1.5 ml of methanol, 100 μl of 10 % AlCl3, 100 μl of 1 M potassium acetate and 2.8 ml of distilled water. Mixture was incubated for 30 min at room temperature and measured at 415 nm using a UV/Vis spectrophotometer. Results were expressed as mg/g quercetin equivalent (QE).
2,2-diphenyl-1-picryl-hydrazyl-hydrate (DPPH) free radical scavenging assay
Extracts (1 mg/ml) were added to 2 ml of freshly prepared DPPH solution (0.1 mM) with continuous shaking, incubated in darkness for 30 min and absorbance was measured at 517 nm [29]. Ascorbic acid was used as a standard. Results were expressed as % of free radicals scavenged using the formula, % free radical scavenging = (1–As/Ac)×100, where, As refers to the absorbance of sample and Ac refers to the absorbance of control.
H2O2 scavenging assay
Extracts were dissolved in 3.4 ml of phosphate buffer (pH- 7.4, 50 mM), 600 μl of H2O2 (40 mM) solution was added [30] and incubated at room temperature for 10 min. The absorbance was measured at 230 nm. Percent of H2O2 scavenging was calculated as, % H2O2 scavenging = (1–As/Ac)×100, where, As denotes the absorbance of sample and Ac is the absorbance of control.
Metal chelating assay
To 2 ml of extract, 0.25 ml of 2 mM FeCl2 was added followed by 0.25 ml of 5 mM ferrozine. Mixture was kept at room temperature for 10 min. Absorbance was measured at 562 nm [31]. Percent of inhibition of ferrozine-Fe2+ complex formation was calculated from the formula, (1–As/Ac)×100, where, As is the absorbance of sample and Ac is the absorbance of control.
β-Carotene-linoleic acid assay
One milligram of β-carotene was dissolved in 1 ml of chloroform, to which 40 mg of linoleic acid and 400 mg of Tween 80 were added. Chloroform was evaporated using a rotary vacuum evaporator. Then 100 ml of distilled H2O was added with vigorous shaking to make an emulsion. Five millilitres of this emulsion was added to 0.2 ml of extract or standard. Immediately, absorbance was measured at 470 nm and then incubated at 50° for 60 min. After 60 min, absorbance was measured again at 470 nm [32]. Antioxidant activity was calculated using the formula (1–DRc/DRs)×100, where, DRc is the rate of degradation of control (ln(a/b)/60), DRs is the rate of degradation of sample (ln(a/b)/60); a= absorbance at zero time, b= absorbance at 60 min.
Derivatization and GC-MS analysis
Plant extracts were derivatized with N,Obistrifluoroacetamide (BSTFA) to form trimethylsilyl derivatives. BSTFA and anhydrous pyridine (300 μl, 1:1) was added to 100 μl plant extract (1 mg) and incubated first at 70° for 30 min and then overnight at room temperature [33]. Derivatized samples were subjected to GC-MS analysis in a Bruker 436- GC equipped with Rtx-5 (5 % diphenyl/95 % dimethyl polysiloxane) fused capillary column (30 m×0.25 mm ID×0.25 μm df). The chromatographic conditions were, an initial column temperature of 70° for 2 min, followed by a linear gradient of 10°/min up to 300°. Injector temperature was kept at 280° and the flow rate of helium (99.9 %) gas was 1 ml/min. Injection volume of 1 μl was used (split mode with split ratio 50:1). MS used in the system was SCION SQ with MS Workstation 8 software package from Bruker. Solvent delay was 4 min and the total run was of 26 min. The eluted peaks were identified by matching with National Institute Standard and Technology library and literature.
Statistical analysis
All experiments were performed in triplicates and the results were expressed as mean with standard deviation. One-way analysis of variance (ANOVA) followed by Tukey’s multiple comparison test was applied to determine variations among antioxidant activities of different extracts and reference standard using GraphPad Prism 7 (GraphPad software Inc., USA) software. Pearson correlation coefficient was determined between TPC, TFC and antioxidant activities of extracts by different assays. Correlation matrix was subjected to PCA using XLSTAT software. PCA was done to understand interrelationship between different variables i.e. antioxidant activities, TPC, TFC.
Results and Discussion
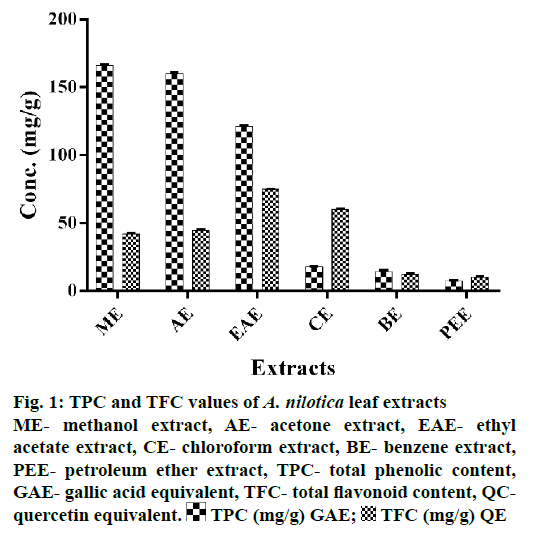
TPC of extracts was estimated using regression Eqn. (y=0.003x+0.053, r2=0.994) obtained from gallic acid standard curve. TPC values ranged between 7.40 to 166.33 mg/g GAE for different extracts. Polar solvents were quite effective in extracting out phenols; methanol being the most effective with TPC value of 166 mg/g GAE followed by acetone. Non-polar solvents extracted out minor amount of TPC; petroleum ether being the least effective.
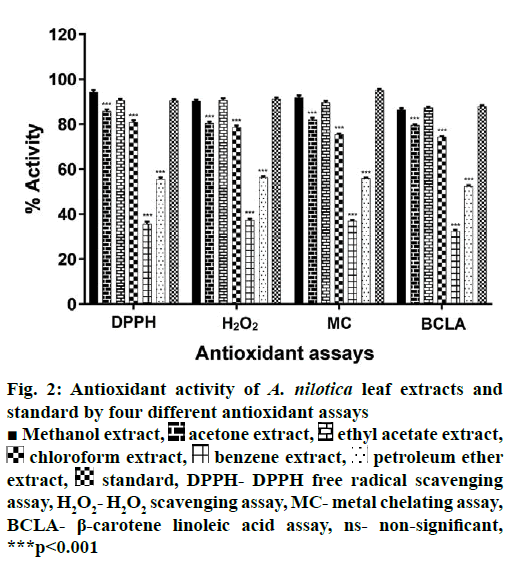
TFC of extracts was estimated using regression Eqn. (y=0.0018x+0.0486, r2=0.9991) obtained from quercetin standard curve. TFC values ranged from 10.34 to 75.11 mg/g QE. Ethyl acetate extract was most effective with TFC value of 75.11 mg/g QE. Petroleum ether was least effective (Figure 1). All extracts showed different levels of antioxidant activities in the 4 antioxidant assays employed (Figure 2). Methanol extract was most active followed by ethyl acetate as compared to standard.
Figure 1: TPC and TFC values of A. nilotica leaf extracts
ME- methanol extract, AE- acetone extract, EAE- ethyl acetate extract, CE- chloroform extract, BE- benzene extract, PEE- petroleum ether extract, TPC- total phenolic content, GAE- gallic acid equivalent, TFC- total flavonoid content, QCquercetin equivalent.  TPC (mg/g) GAE;
  TFC (mg/g) QE
Figure 2: Antioxidant activity of A. nilotica leaf extracts and standard by four different antioxidant assays
■ Methanol extract,  acetone extract,
  ethyl acetate extract,
  chloroform extract,
  benzene extract,
  petroleum ether extract,
  standard, DPPH- DPPH free radical scavenging assay, H2O2- H2O2 scavenging assay, MC- metal chelating assay, BCLA- β-carotene linoleic acid assay, ns- non-significant, ***p<0.001
Maximum DPPH free radical scavenging activity of 94.3 % was exhibited by the methanol extract followed by 90.7 % activity by the ethyl acetate extract. Ascorbic acid showed 90.63 % free radical scavenging activity. Benzene extract showed minimum activity with 36.9 %. All extracts showed H2O2 scavenging activity to different extents. Maximum scavenging activity was shown by methanol extract at 92.4 % Benzene extract (37.34 %) and petroleum ether extract (56.35 %) were less active compared to other extracts and control. Ascorbic acid showed 91.33 % activity.
Iron also decomposes lipid hydro-peroxides into reactive free radicals. Chelating agents reduces the Fe2+- ferrozine complex formation, observed as a reduction in red colour in solution. A. nilotica leaf extracts showed significant metal chelating activity. Maximum activity observed was 92 % by methanol extract followed by 84.06 % of acetone extract. Benzene extract showed minimum 37 % activity. EDTA showed 95 % activity.
Linoleic acid produces free radicals on incubation at 50°. These free radicals attack β-carotene resulting in lower absorbance values. Methanol extract exhibited maximum activity of 89.56 comparable to that of 88.03 % of control. Benzene extract was least effective with 32.4 % activity.
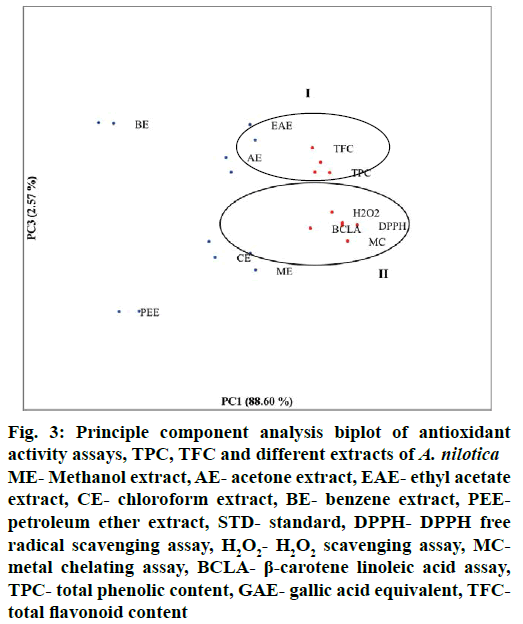
Correlation between TPC, TFC and antioxidant activities of extracts was analysed using Pearson correlation coefficient. Positive correlation was observed between all the parameters (Table 1). TFC showed maximum correlation (r=0.839) to H2O2 scavenging assay. TPC showed significant correlation (r=0.795) with metal chelating assay. TPC and TFC showed low level of correlation (r=0.481) with each other. Based on these correlation data, principle components (PCs) contributing to variation were analysed and represented in a two dimensional space (Figure 3). Two PCs explaining 91.17 % of variability were chosen for biplot. PC1 and PC3 accounted for 88.60 % and 2.57 % data variance, respectively. PC1 showed positive correlation with group II, which included all antioxidant assays, TPC, TFC and 4 extracts (methanol, acetone, ethyl acetate, chloroform). PC3 showed positive correlation with group I including TPC, TFC and 3 extracts (acetone, ethyl acetate, benzene). Benzene and petroleum ether extracts were observed separated from all other extracts and parameters. Benzene extract was observed in positive correlation with PC3 i.e. with TPC and TFC but in negative correlation with PC1 i.e., antioxidant assays while petroleum ether extract showed positive correlation with antioxidant assays (PC1) and negative correlation with TPC and TFC.
| TPC | TFC | DPPH | H2O2 | MC | BCLA | |
|---|---|---|---|---|---|---|
| TPC | 1.000 | |||||
| TFC | 0.481 | 1.000 | ||||
| DPPH | 0.771 | 0.815 | 1.000 | |||
| H2O2 | 0.747 | 0.839 | 0.995* | 1.000 | ||
| MC | 0.795 | 0.804 | 0.995* | 0.996* | 1.000 | |
| BCLA | 0.766 | 0.832 | 0.997* | 0.998* | 0.997* | 1.000 |
Table 1: Pearson correlation coefficient of different antioxidant parameters observed in A. nilotica leaves
Figure 3: Principle component analysis biplot of antioxidant activity assays, TPC, TFC and different extracts of A. nilotica
ME- Methanol extract, AE- acetone extract, EAE- ethyl acetate extract, CE- chloroform extract, BE- benzene extract, PEEpetroleum ether extract, STD- standard, DPPH- DPPH free radical scavenging assay, H2O2- H2O2 scavenging assay, MCmetal chelating assay, BCLA- β-carotene linoleic acid assay, TPC- total phenolic content, GAE- gallic acid equivalent, TFCtotal flavonoid content
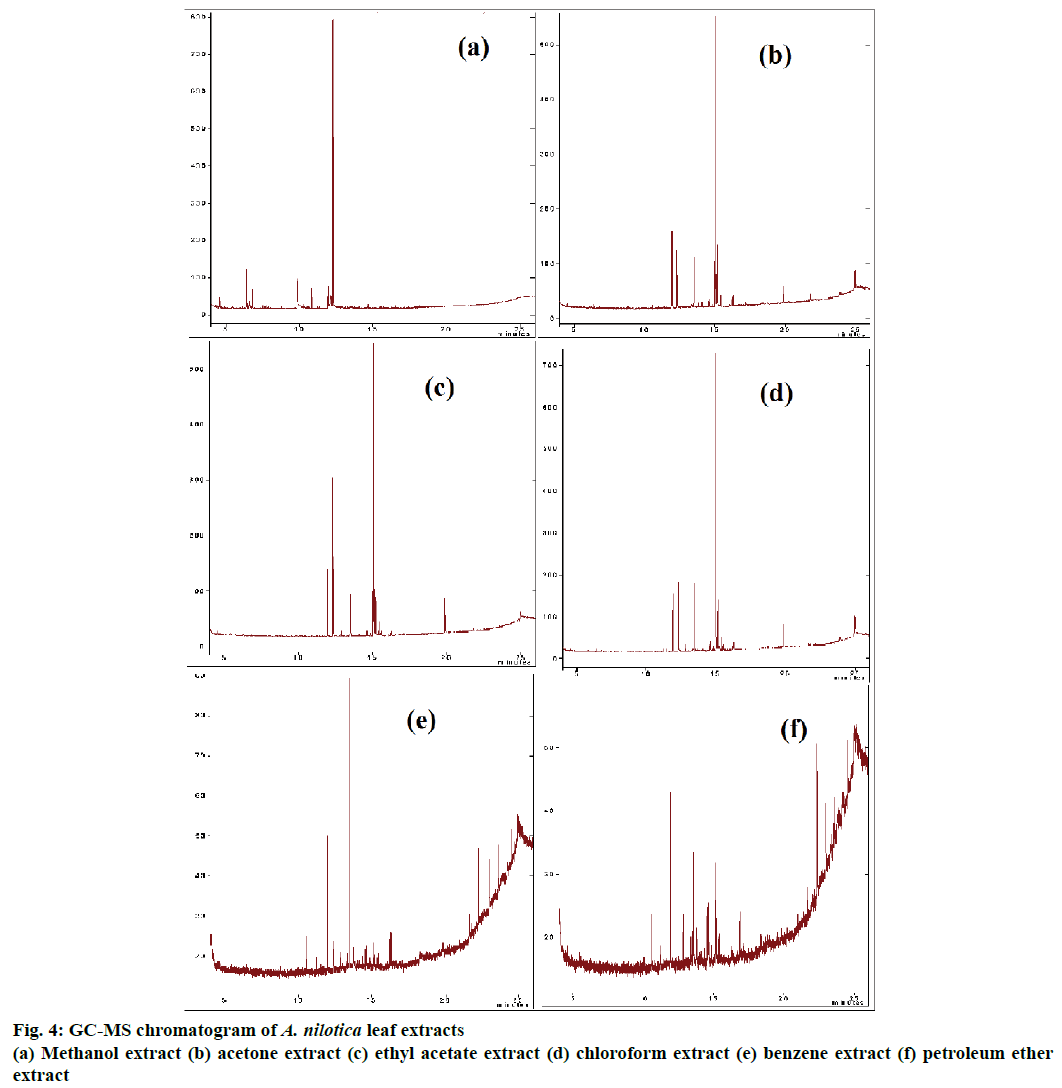
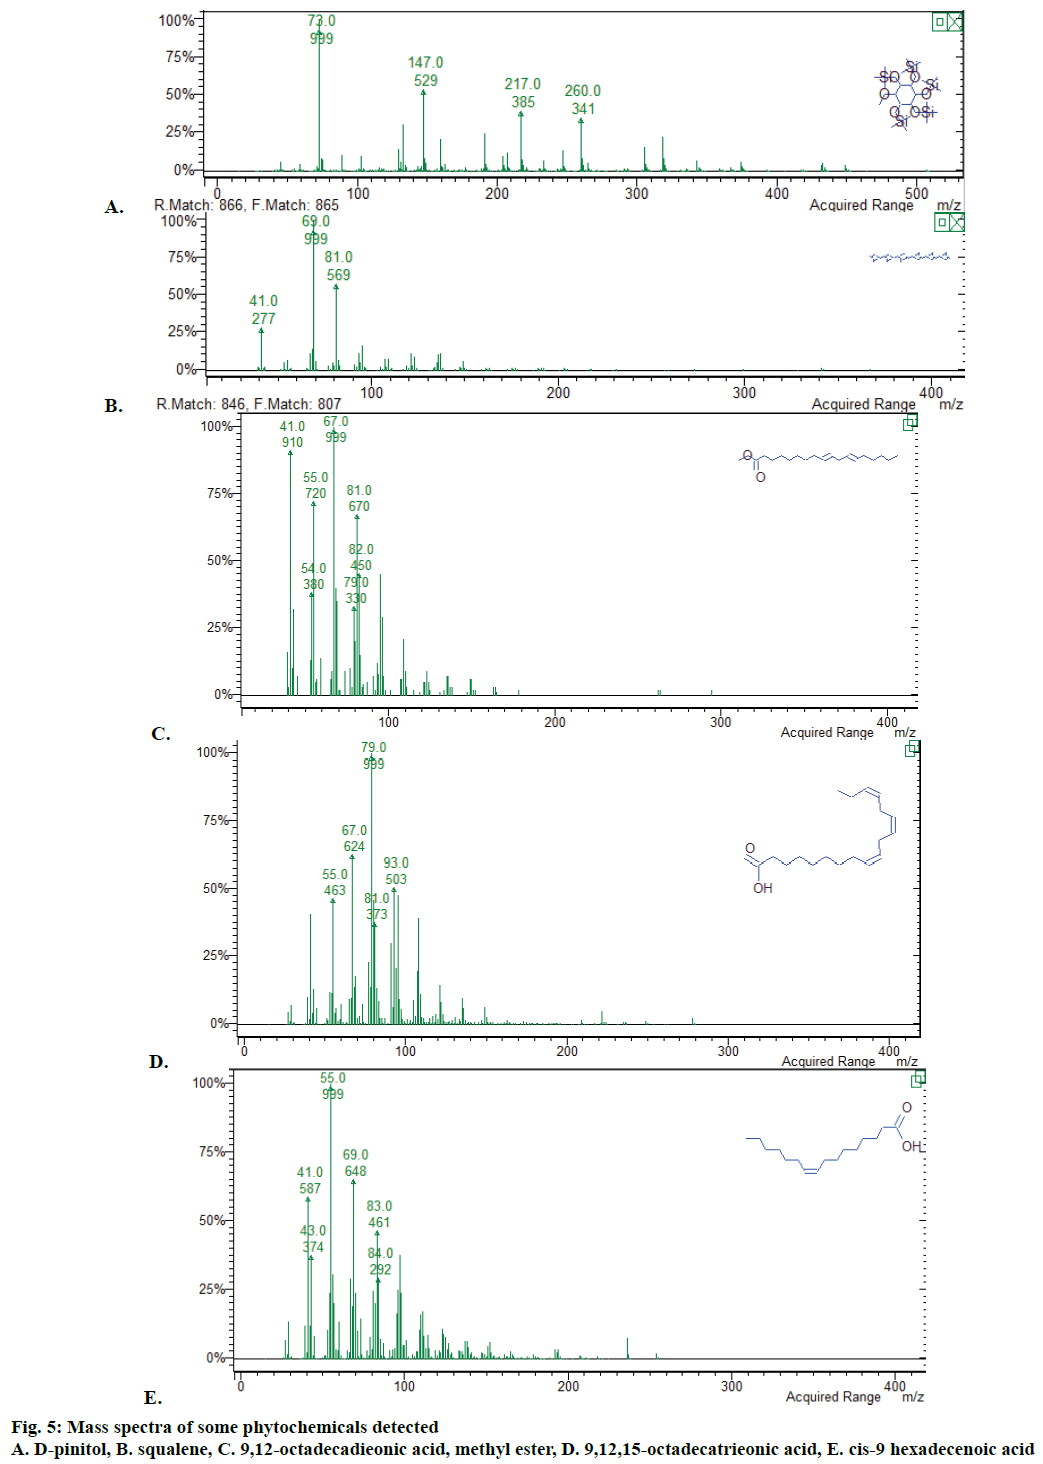
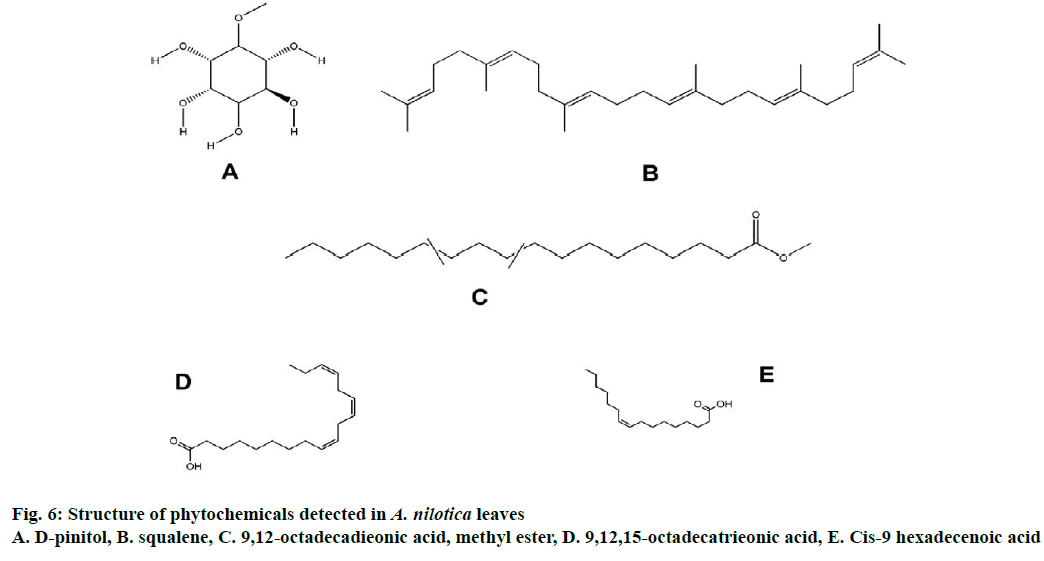
The GC-MS spectra of all six extracts confirmed the presence of various constituents like essential oils, fatty acids, esters, alcohols, phenols, carbohydrates, alkanes, steroids, and terpenes (Figure 4). Main phytochemicals present in extracts were shown in Tables 2-4. Spectra of some of the compounds detected were given in Figures 5 and 6, respectively. Hexadecanoic acid, 8,11,14-eicosatrienoic acid, 9,12-octadecadieonoic acid, methyl ester (E,E)-, 9,12,15-octadecatrieonoic acid (Z,Z,Z)-, 9-octadecen-12-ynoic acid, methyl ester, cis-9 hexadecenoic acid were the main fatty acids and their esters present in extracts. Carbohydrates moieties like myoinositol and D-pinitol were also detected. Terpenoids squalene and R-limonene were also observed. Phenol, 2,5-bis(1,1-dimethylethyl)- and 1,2- benzenetriol (catechol) were also observed in extracts.
| Methanol extract | Acetone extract | ||||
|---|---|---|---|---|---|
| RT | Compounds | % Area | RT | Compounds | % Area |
| 4.111 | N-2,4-Dnp-L-arginine | 0.035 | 4.074 | Pyridine-3-carboxamide | 0.037 |
| 4.566 | Benzaldehyde, 4-methyl- | 1.871 | 11.963 | Tridecane, 1-bromo- | 10.43 |
| 6.110 | Phenylacetic acid, 2-adamantyl ester | 0.343 | 12.297 | Dodecyl acrylate | 8.185 |
| 6.412 | 1,2-Benzenediol, o-(4-methoxybenzoyl)-o’-(4-methylbenzoyl)- | 7.275 | 12.855 | Octadecane, 6-methyl- | 0.927 |
| 6.453 | Benzene, 1-(3-trifluoromethylphenyliminomethyl)-4-(thietan-3-yloxy)- | 0.062 | 13.297 | R-Limonene | 0.183 |
| 6.537 | Pyridinium, diniromethylide- | 0.296 | 13.522 | Hexadecanoic acid, Z-11- | 7.619 |
| 6.595 | Carbonic acid, ethyl phenyl ester | 1.370 | 13.832 | 2-Pentadecanone, 6,10,14-trimethyl- | 0.635 |
| 6.826 | Benzene, 1,3-bis(1,1-dimethylethyl)- | 3.207 | 14.082 | Pthalic acid, 6-ethyl-3-octyl isobutyl ester | 0.436 |
| 7.494 | 4-Trifluoroacetoxytridecane | 0.491 | 14.091 | Pthalic acid, 8-chlorooctyl isobutyl ester | 0.296 |
| 7.613 | 2-Trifluroacetoxypentadecane | 0.462 | 14.555 | Cyclopropanenonanoic acid, methyl ester | 1.109 |
| 7.723 | 1-Octanol, 2-butyl- | 0.348 | 14.613 | 8,11,14-Eicosatrieonic acid, (Z,Z,Z)- | 1.378 |
| 9.817 | 1-Dodecanol | 16.26 | 14.666 | Hexadecanoic acid, methyl ester | 2.352 |
| 10.261 | Phenol, 2,5-bis(1,1-dimethylethyl)- | 0.642 | 15.020 | Dibutyl phthalate | 45.39 |
| 10.839 | Silane, (dodecyloxy)trimethyl- | 3.344 | 15.114 | 9,12-Octadecadieonic acid, methyl ester (E,E)- | 4.957 |
| 11.964 | Tridecane, 1-bromo- | 3.545 | 15.172 | 9,12,15-Octadecatrieonic acid (Z,Z,Z)- | 9.328 |
| 12.122 | Myo-Inositol,4-C-methyl- | 4.571 | 15.413 | 22-Tricosenoic acid | 1.604 |
| 12.296 | Dodecyl acrylate | 49.40 | 16.225 | Linoleic acid ethyl ester | 0.909 |
| 12.364 | Propanoic acid, decyl ester | 5.352 | 16.287 | Cis,cis,cis-7,10,13-Hexadecatrienal | 1.597 |
| 12.411 | Dodecanoic acid, 2,3-bis(acetyloxy)propyl ester | 0.038 | 19.847 | Diisooctyl phthalate | 2.601 |
| 16.515 | Methyl strearate | 0.590 | 21.255 | 9-Octadecen-12-ynoic acid, methyl ester | 0.021 |
Table 2: Compounds identified in methanol and acetone extracts of A. nilotica by GC-MS
| Ethyl acetate extract | Chloroform extract | ||||
|---|---|---|---|---|---|
| RT | Compound | % Area | RT | Compound | % Area |
| 4.052 | 4-Cyclopropylcarbonyloxytetra Decane |
0.016 | 11.962 | Tridecane,1-bromo- | 6.061 |
| 11.964 | Tridecane, 1-bromo- | 7.801 | 12.294 | Dodecyl acrylate | 18.22 |
| 12.296 | Dodecyl acrylate | 20.74 | 12.851 | Tetracontane, 3,5,24-trimethyl- | 0.823 |
| 12.851 | Decane, 1-(ethenyloxy)- | 0.787 | 13.520 | Cis-9-Hexadecenoic acid | 7.490 |
| 13.521 | Z-10-Methyl-11-tetradecen-1-ol propionate | 5.711 | 13.827 | 2-Pentadecanone, 6,10,14-trimethyl- | 0.330 |
| 14.612 | 9,12,15-Octadecatrieonic acid, methyl ester, (Z,Z,Z)- | 1.114 | 14.550 | 9,12-Octadecadieonic acid, methyl ester, (E,E)- | 0.649 |
| 14.661 | Pentadecanoic acid, 14-methyl-, methyl ester | 0.749 | 14.661 | Hexadecanoic acid, methyl ester | 1.199 |
| 15.018 | Dibutyl phthalate | 42.79 | 15.017 | Dibutyl phthalate | 35.93 |
| 15.113 | 9,12-Octadecadieonic acid, methyl ester, (E,E)- | 3.672 | 15.112 | 9,12-Octadecadienoic acid(Z,Z)- | 4.404 |
| 15.170 | 9,12,15-Octadecatrieonic acid, (Z,Z,Z)- | 6.351 | 15.168 | Cis,cis,cis-7,10,13-Hexadecatrienal | 8.354 |
| 15.412 | Octadecanal | 1.887 | 15.409 | Hexadecane, 1-(ethenyloxy)- | 2.774 |
| 15.544 | Propionic acid, 3-mercapto-, 2,2,4,4-tetramethylpentyl ester | 0.565 | 15.542 | Propanoic acid, 3-mercapto-, dodecyl ester | 0.653 |
| 16.277 | 6,9,12,15-Docosatetraeonic acid, methyl ester | 0.367 | 16.226 | 12,15-Octadecadienoic acid, 2,3methyl ester | 0.481 |
| 16.298 | 9,12,155-Octadecatrieonic acid, 2,3-dihydroxypropyl ester | 0.070 | 16.283 | 9,12,15-Octadecatrienoic acid, 2,3-dihydroxypropyl ester, (Z,Z,Z)- | 0.796 |
| 19.846 | Bis(2-ethylhexyl phthalate | 6.009 | 17.143 | Octadecanal, 2-bromo- | 0.538 |
| 21.786 | 5,9,13-Pentadecatrien-2-one, 6,10,14-trimethyl-, (E,E)- | 0.448 | 19.845 | Bis(2-ethylhexyl) phthalate | 0.435 |
| 24.975 | Allopregnane3.beta.,7.alpha.,11.alpha.-triol-20-one | 0.774 | 21.640 | 9-Octadecenamide, (Z)- | 0.235 |
| 25.481 | 2,4-Imidazoliinedione, 5-[3,4-bis[(trimethyksilyl)oxy]… | 0.033 | 21.787 | Squalene | 0.671 |
| 25.488 | Ethyl iso-allocholate | 0.057 | 23.920 | 2(1H)-Quinolinone, 4-phenyl- | 0.447 |
| 25.840 | Androst-5-en-17-one,3-[(trimethylsilyl)oxy]- | 0.047 | 24.977 | Allopregn-7,16-diene-3.beta.,7.alpha.,11.alpha.-triol | 2.309 |
Table 3: Compounds identified in ethyl acetate and chloroform extracts of A. nilotica by GC-MS
| Benzene extract | Petroleum ether extract | ||||
|---|---|---|---|---|---|
| RT | Compound | % Area | RT | Compound | % Area |
| 4.019 | Pyrrolidine, 1-(1-oxo-2,5-Octadecadienyl)- | 0.545 | 11.956 | Tridecane, 1-bromo- | 16.36 |
| 13.543 | D-Pinitol, pentakis (trimethylsilyl) ether | 32.84 | 12.289 | 2-Propenoic acid, tridecyl ester | 2.639 |
| 16.218 | 9,15-Octadecadieonic acid, methyl ester, (Z,Z)- | 4.064 | 12.846 | 1-Dodecanol, 3,7,11-trimethyl- | 5.035 |
| 16.279 | 9,12,15-Octadecatrieonic acid, methyl ester, (Z,Z,Z)- | 9.041 | 13.514 | Cis-9 Hexadecenoic acid | 10.64 |
| 22.329 | Hexacosane | 23.39 | 14.606 | 9,12,15-Octadecatrienal | 4.832 |
| 22.974 | Tritriacontane | 13.28 | 15.110 | 9,12-Octadecadieonic acid, methyl ester, (E,E)- | 4.938 |
| 23.594 | Eicosane, 2-methyl- | 16.37 | 15.164 | Cis,cis,cis-7,10,13-Hexadecatrienal | 8.705 |
| 23.905 | 8,11,14-Eicosatrienoic acid, methyl ester, (Z,Z,Z)- | 0.496 | 22.324 | Heptacosane | 17.71 |
| 22.349 | Octadecane,3-ethyl-5-(2-ethylbutyl)- | 2.440 | |||
| 22.966 | Sulfourous acid, pentadecylpentyl ester | 8.362 | |||
| 23.596 | Hexacosane | 14.03 | |||
| 23.879 | 1-Monolinoleoylglycerol trimethylsilyl ether | 1.262 | |||
Table 4: Compounds identified in benzene and petroleum ether extracts of A. nilotica by GC-MS
Secondary metabolites are a plants’ arsenal that act as a trouble shooter in its life cycle. These metabolites not only defend the plant but also benefit mankind by offering an array of medicinal activities. Phenols and flavonoids are classes of secondary metabolites, which confer strong antioxidant activity. In present study TPC values up to 166.33 mg/g GAE and TFC values up to 75.11 mg/g QE were observed for methanol and ethyl acetate extract, respectively. Previous studies on A. nilotica also emphasize that it is a rich source of phenols and flavonoids [34,35]. Various solvent extracts of A. nilotica conferred different antioxidant capacities; polar solvent extracts being most effective. Methanol and ethyl acetate were the most effective solvents in this study. Both of these solvents extract out phenols and flavonoids from plant sample [36].
Four different in vitro assays were used for antioxidant activity determination. These assays mainly differed in the type of free radical scavenged. DPPH method due to its reliability and easy colour change observation is the most applied in vitro method [37]. H2O2 intake produces OH· radicals which causes lipid peroxidation [38]. β-Carotene-linoleic acid assay system is also routinely used for checking antioxidant activities of plants and foods [37]. A. nilotica extracts exhibited good antioxidant potential in all assays. Methanol extract of A. nilotica exhibited maximum activity (94 %). Ethyl acetate extract showed 90 % activity comparable to that of standard. Kalaivani et al. reported higher activity of A. nilotica ethanol extract than standard at same concentration [24]. Sadiq et al. also reported 91 % antioxidant activity of ethanol extract [17].
PCA is an important statistical tool for predicting correlation between different parameters in a two dimentional space [39]. In present study PCA analysis reveals the relationship between TPC, TFC and antioxidant activities of six solvent extracts of A. nilotica. Methanol and chloroform extracts showed positive correlation with antioxidant assays while acetone and ethyl acetate extracts showed positive correlation with TPC and TFC values. PCA results corresponded with results observed for antioxidant activities of extracts.
Phytochemical screening is mandatory for standardization of any herbal product. GC-MS analysis is a time efficient tool for phytochemical detection. It confirmed the presence of various classes of compounds in A. nilotica leaf extracts. Presence of these compounds was also confirmed by comparing with literature. Pinitol has been detected in many plant species and showed ion fragment at m/z 73, 147, 217 and 260 [40]. Squalene showed ion fragment at m/z 41, 69 and 81 same as those observed in P. chinense [41]. Presence of cis-9 hexadecenoic acid (m/z 41, 55, 69), 9,12-octadecadieonic acid, methyl ester (m/z 41, 55, 67), 9,12,15-octadecatrieonic acid (m/z 41, 67, 79) was also confirmed by comparing with a validated method [42].
Fatty acids 9-12-octadecadieonic acid (linoleic acid), 9,12,15-octadecatrieonic acid (γ-linoleic acid), palmitic acid, stearic acid, 9-octadecen-12- ynoic acid methyl ester were observed in different extracts and act as strong antioxidants [43-45]. Catechol derivative was observed in methanol extract. Alkane heptacosane, 2-pentadecanone, 6,10,14-trimethyl act as antioxidants and were present in petroleum ether and chloroform extract, respectively [46,47]. Squalene; a tritrpenoid compound observed in chloroform extract possessed antioxidant, antimicrobial, chemopreventive and antitumour activities. A variety of compounds like 2(1-H)-quinolinone, N-2,4-dnp-L-arginine, R-limonene, tridecane, ethyl iso-allocholate were observed in extracts having neuroleptic, anticancerous and antimicrobial properties [48-52].
D-pinitol is a carbohydrate that has been previously isolated from A. nilotica and has various medicinal activities like antioxidant, antidiabetic, antiviral, antiinflammatory, anthelminthic [53] and was observed in benzene extract. An active steroid androst-5-en was observed in ethyl acetate extract having antiinflammatory activity that has previously been isolated from A. nilotica [54]. Thus it can be concluded that GC-MS is an effective tool for phytochemical prediction. GC-MS analyses of different solvent extracts of A. nilotica generates phytochemical profile maps of the plant, which can be used as stepping stone in compound isolation studies. Present study reveals the antioxidant potential of A. nilotica leaf extracts and the main phytochemicals responsible for the activity. Further more research is required for analysis of extracts by other analytical techniques, particular compound isolation and their cytotoxic assessment.
Acknowledgements
The research was financially supported by UGC under UGC-SAP program (F.3-20/2012 (SAP-II) and UGC BSR fellowship (F.7-371/2012 (BSR).
Conflict of interest
We declare that we have no conflict of interest.
References
- Sharma P, Jha AB, Dubey RS, Pessarakli M. Reactive oxygen species, oxidative damage, and antioxidative defense mechanism in plants under stressful conditions. J Bot 2012;2012:1-26.
- Tosato M, Zamboni V, Ferrini A, Cesari, M. The aging process and potential interventions to extend life expectancy. Clin Interv Aging 2007;2:401-12.
- Tauchen J, Doskocil I, Caffi C, Lulekal E, Marsik P, Havlik J, et al. In vitro antioxidant and antiproliferative activity of Ethiopian medicinal plant extracts. Ind Crops Prod 2015;74:671-9.
- Torre GLTD, Arollado EC, Atienza AA, Manalo RAM. Evaluation of antioxidant capacity and identification of bioactive compounds of crude methanol extracts of Caesalpinia pulcherrima (L.) Swartz. Indian J Pharm Sci 2017;79:113-23.
- Flora SJS. Structural, chemical and biological aspects of antioxidants for strategies against metal and metalloid exposure. Oxid Med Cell Longev 2009;2:191-206.
- Ayoub M, de Camargo AC, Shahidi, F. Antioxidants and bioactivities of free, esterified and insoluble-bound phenolics from berry seed meals. Food Chem 2016;197:221-32.
- Pietta PG. Flavonoids as antioxidants. J Nat Prod 2000;63:1035-42.
- Fiedor J, Burda K. Potential role of carotenoids as antioxidants in human health and disease. Nutrients 2014;6:466-88.
- Mooradian AD. Antioxidant properties of steroids. J Steroid Biochem Mol Biol 1993;45:509-11.
- Gungor N, Ozyurek M, Guclu K, Cekik SD, Apak R. Comparative evaluation of antioxidant capacities of thiol-based antioxidants measured by different in vitro methods. Talanta 2011;83:1650-8.
- Finley JW, Kong AN, Hintze KJ, Jeffery EH, Ji LL, Lei XG. Antioxidants in foods: state of the science important to the food industry. J Agric Food Chem 2011;59:6837-46.
- Masaki H. Role of antioxidants in the skin: antiaging effects. J Dermatol Sci 2010;58:85-90.
- Blomhoff R, Carlsen MH, Andersen LF, Jacobs DR. Health benefits of nuts: potential role of antioxidants. Br J Nutr 2006;96(S2):S52-60.
- Brewer MS. Natural antioxidants: sources, compounds, mechanisms of action, and potential applications. Compr Rev Food Sci Food Saf 2011;10:221-47.
- Silambarasan R, Ayyanar M. An ethnobotanical study of medicinal plants in Palamalai region of Eastern Ghats, India. J Ethnopharmacol 2015;172:162-78.
- Yadav A, Yadav M, Kumar S, Yadav JP. Bactericidal effect of A. nilotica: In vitro antibacterial and time kill kinetic studies. Int J Curr Res 2015;7:22289-94.
- Sadiq MB, Hanpithakpong W, Tarning J, Anal AK. Screening of phytochemicals and in vitro evaluation of antibacterial and antioxidant activities of leaves, pods and bark extracts of A. nilotica (L.) Del. Ind Crops Prod 2015;77:873-82.
- Mukundi MJ, Piero NM, Mwaniki NEN, Murugi NJ, Daniel AS, Peter GK, et al. Antidiabetic effects of aqueous leaf extracts of A. nilotica in alloxan induced diabetic mice. J Diabetes Metab 2015;6:568-73.
- Alli LA, Adesokan AA, Salawu OA, Akanji MA, Tijani AY. Antiplasmodial activity of aqueous root extract of A. nilotica. Afr J Biochem Res 2011;5:214-9.
- Eldeen IMS, Van Heerden FR, Van Staden J. In vitro biological activities of niloticane, a new bioactive cassane diterpene from the bark of A. nilotica subsp. kraussiana. J Ethnopharmacol 2010;128:555-60.
- Govindarajan P, Sarada DVL. Isolation and characterization of stigmasterol and β-sitosterol from A. nilotica (l.) Delile ssp Indica (benth.) Brenan. J Pharm Res 2011;4:3601-2.
- Sundarraj S, Thangam R, Sreevani V, Kaveri K, Gunasekaran P, Achiraman S, et al. γ-Sitosterol from A. nilotica L. induces G2/M cell cycle arrest and apoptosis through c-Myc suppression in MCF-7 and A549 cells. J Ethnopharmacol 2012;141:803-9.
- Singh R, Singh B, Singh S, Kumar N, Kumar S, Arora S. Anti-free radical activities of kaempferol isolated from A. nilotica (L.) Willd. Ex. Del. Toxicol In Vitro 2008;22:1965-70.
- Kalaivani T, Rajasekaran C, Mathew L. Free Radical Scavenging, cytotoxic, and haemolytic activities of an active antioxidant compound Ethyl Gallate from leaves of A. nilotica (L.) Wild. Ex. Delile Subsp. Indica (Benth.) Brenan. J Food Sci 2011;76:144-9.
- Salem MM, Davidorf FH, Abdel-Rahman MH. In vitro anti-uveal melanoma activity of phenolic compounds from the Egyptian medicinal plant A. nilotica. Fitoterapia 2011; 82:1279-84.
- Proestos C, Sereli D, Komaitis M. Determination of phenolic compounds in aromatic plants by RP-HPLC and GC-MS. Food Chem 2006;95:44-52.
- Ainsworth EA, Gillespie KM. Estimation of total phenolic content and other oxidation substrates in plant tissues using Folin-Ciocalteu reagent. Nat Protoc 2007;2:875-7.
- Chang CC, Yang MH, Wen HM, Chern JC. Estimation of total flavonoid content in propolis by two complementary colorimetric methods. J Food Drug Anal 2002;10(3):178-82.
- Yamaguchi T, Takamura H, Matoba T, Terao J. HPLC method for evaluation of the free radical-scavenging activity of foods by using 1,1,-diphenyl-2-picrylhydrazyl. Biosci Biotechnol Biochem 1998;62:1201-4.
- Ruch RJ, Cheng SJ, Klaunig JE. Prevention of cytotoxicity and inhibition of intercellular communication by antioxidant catechins isolated from Chinese green tea. Carcinogenesis 1998;10:1003-8.
- Dinis TC, Madeira VM, Almeida LM. Action of phenolic derivates (acetoaminophen, salycilate and 5-aminosalycilate) as inhibitors of membrane lipid peroxidation and as peroxyl radical scavengers. Arch Biochem Biophys 1994;315:161-9.
- Taga MS, Miller EE, Pratt DE. Chia seeds as a source of natural lipid antioxidant. J Am Oil Chem Soc 1984;61:928-31.
- González-Montelongo R, Lobo MG, González M. Antioxidant activity in banana peel extracts: testing extraction conditions and related bioactive compounds. Food Chem 2010;119:1030-9.
- Gowri SS, Pavitha S, Vasantha K. Free radical scavenging capacity and antioxidant activity of young leaves and barks of A. nilotica (l.) Del. Int J Pharm Pharm Sci 2011;3:160-4.
- Sultana B, Anwar F, Ashraf M. Effect of extraction solvent/technique on the antioxidant activity of selected medicinal plant extracts. Molecules 2009;14(6):2167-80.
- Tiwari P, Kumar B, Kaur M, Kaur G, Kaur H. Phytochemical screening and extraction: a review. Int Pharma Sci 2011;1:98-106.
- Moon JK, Shibamoto T. Antioxidant assays for plant and food components. J Agric Food Chem 2009;57:1655-66.
- Alam MN, Bristi NJ, Rafiquzzaman M. Review on in vivo and in vitro methods of evaluation of antioxidant activity. Saudi Pharma J 2013;21:143-52.
- Pereira VP, Knor FJ, Vellosa JCR, Beltrame FL. Determination of phenolic compounds and antioxidant activity of green, black and white teas of Camellia sinensis (L.) Kuntze, Theaceae. Rev Bras Plantas Med 2014;16(3):490-8.
- Garland S, Goheen S, Donald P, McDonald L, Campbell J. Application of derivatization gas chromatography/mass spectrometry for the identification and quantitation of pinitol in plant roots. Anal Lett 2009;42(13):2096-105.
- Ezhilan BP, Neelamegam R. GC-MS analysis of phytocomponents in the ethanol extract of Polygonum chinense L. Pharmacognosy Res 2012;4(1):11-4.
- Dodds ED, McCoy MR, Rea LD, Kennish JM. Gas chromatographic quantification of fatty acid methyl esters: flame ionization detection vs. electron impact mass spectrometry. Lipids 2005;40(4):419-28.
- Nagella P, Ahmad A, Kim SJ, Chung IM. Chemical composition, antioxidant activity and larvicidal effects of essential oil from leaves of Apium graveolens. Immunopharmacol Immunotoxicol 2012;34:205-9.
- Richard D, Kefi K, Barbe U, Bausero P, Visioli F. Polyunsaturated fatty acids as antioxidants. Pharmacol Res 2008;57(6):451-5.
- Elagbar ZA, Naik RR, Shakya AK, Bardaweel SK. Fatty Acids Analysis, antioxidant and biological activity of fixed oil of Annona muricata L. Seeds. J Chem 2016;2016:1-6.
- Marrufo T, Nazzaro F, Mancini E, Fratianni F, Coppola R, De Martino L, et al. Chemical composition and biological activity of the essential oil from leaves of Moringa oleifera Lam. cultivated in Mozambique. Molecules 2013;18:10989-1000.
- Lin XH, Wu YB, Lin S, Zeng JW, Zeng PY, Wu JZ. Effects of volatile components and ethanolic extract from Eclipta prostrata on proliferation and differentiation of primary osteoblasts. Molecules 2010;15:241-50.
- Malathi K, Anbarasu A, Ramaiah S. Ethyl iso-allocholate from a medicinal rice Karungkavuni inhibits dihydropteroate synthase in Escherichia coli: A molecular docking and dynamics study. Indian J Pharm Sci 2017;78(6):780-8.
- Girija S, Duraipandiyan V, Kuppusamy PS, Gajendran H, Rajagopal R. Chromatographic characterization and GC-MS evaluation of the bioactive constituents with antimicrobial potential from pigmented ink of Loligo duvauceli. Int Sch Res Notices 2014;2014:1-7.
- Kamstra RL, Freywald A, Floriano WB. N‐(2, 4)‐dinitrophenyl‐L‐arginine interacts with EphB4 and functions as an EphB4 Kinase modulator. Chem Biol Drug Des 2015;86:476-86.
- Sun J. D-Limonene: safety and clinical applications. Altern Med Rev 2007;12(3):259-64.
- Banno K, Fujioka T, Kikuchi T, Oshiro Y, Hiyama T, Nakagawa K. Studies on 2 (1H)-quinolinone derivatives as neuroleptic agents. I. Synthesis and biological activities of (4-Pheny1-1-piperaziny1)-propoxy-2(1H)-quinolinone derivatives. Chem Pharm Bull 1988;36(11):4377-88.
- Chaubal R, Pawar PV, Hebbalkar GD, Tungikar VB, Puranik VG, Deshpande VH et al. Larvicidal activity of A. nilotica extracts and isolation of D‐Pinitol–A Bioactive Carbohydrate. Chem Biodivers 2005;2:684-8.
- Chaubal R, Mujumdar AM, Puranik VG, Deshpande VH, Deshpande NR. Isolation and X-ray study of an antiinflammatory active androstene steroid from A. nilotica. Planta Med 2003;69(3):287-8.
