- *Corresponding Author:
- Shaji J
Pharmaceutics Department, Principal K. M. Kundanani College of Pharmacy, 23, Jote Joy Bldg, Rambhau Salgaokar Marg, Colaba, Mumbai-400 005, India
E-mail: jshaji@rediffmail.com
| Date of Received : | 28-Feb-2011 |
| Date of Revised : | 31-Aug-2012 |
| Date of Accepted : | 03-Sep-2012 |
| Indian J. Pharm. Sci., 2011, 73 (6): 663-665 |
Abstract
The aim of the present study was to prepare, evaluate and optimize, self micro emulsifying drug delivery system of celecoxib. A 3 factor, 3 level factorial design was used for the optimization procedure with different amounts of Labrafil 2609 WL, Labrasol, and Cremophor EL as the independent variables. The response variable was selected on particle size (nm) of the droplets after dilution in 0.1N HCl. Particle size of the self micro-emulsifying drug delivery system depends on the quantity of above three independent variables. Three different levels of each independent variable were selected for the optimization. Mathematical equation and response surface plots were used to relate the dependent and independent variables. The regression equation generated for the particle size after dilution was, Particle size (Y)= +27.83+76.07×A-23.62×B-43.83×C+52.72×A2+9.82×B2+27.20×C2-14.52×A×B-32.38×A×C+12.1×B×C, where, A=Labrafil 2609 WL, B= Labrasol, C= Cremophor EL, Y= particle size. The optimized model predicted a particle size of 28.33 nm with 0.16ml of labrafil 2609 WL, 0.17ml Labrasol and 0.22 ml of Cremophor EL.The observed response were in close agreement with the predicted values of the optimized formulation. This demonstrates the reliability of the optimization procedure in predicting particle size of self microemulsifying delivery system for celecoxib.
Keywords
Self microemulsifying drug delivery system, particle size, celecoxib, optimization, response surface methadology
Approximately 35-40% of new drug candidates have poor water solubility. The oral delivery of such drugs is frequently associated with low bioavailability, high inter-subject and intra-subject variability and lack of dose proportionality. Efforts are needed to enhance the oral bioavailability of class-2 and class-4 lipophillic drugs in order to increase the clinical effi cacy. Currently various formulation strategies are in practice such as use of cyclodextrin, nanoparticles, solid dispersion, micronization, liposomes, permeation enhancers, lipid solutions and microemulsions [1,2].
Microemulsion has got advantages like excellent thermodynamic stability, high drug solubilization capacity, improved oral bioavailability and protection against enzymatic hydrolysis. The only problem with microemulsion is poor palatability due to the lipid content leading to the poor patient compliance. Moreover due to their water content, microemulsion cannot be encapsulated in soft gelatin and hard gelatin capsules; hence there is a need for anhydrous selfmicro emulsifying drug delivery system [3].
Compared to microemulsion, Self-microemolsilying Drug delivery System (SMEDDS) offers advantages such as, improved physical stability profile upon long term storage, volume considerations and can be presented in concentrated form and can be filled directly into soft or hard gelatin capsules for convenient oral delivery. The most signifi cant one is that microemulsion dosage form uses a large amount of surfactants for the purpose of forming microemulsions. This has posed clinical liabilities as surfactants often have potential toxic effects when used at high levels. The use of cosolvent/cosurfactants is believed to act as a good solubilizer for both water and oil and reduce surface tension by stabilizing fi lm formation between the two phases at suffi ciently low concentration. This rules out the use of the large amount of surfactants in the formation of microemulsion.
Self-micro emulsifying system is isotropic mixture of oil, surfactant and hydrophilic co-surfactant which forms fi ne o/w emulsion, when introduced in excess of aqueous phase under conditions of gentle agitation [3]. Agitation will be provided by body movement and gastrointestinal movement in vivo. Bases for selfmicro emulsifying system have been formulated using medium chain tri-glyceride oils and non-ionic surfactant, which are acceptable for oral ingestion4.
The lipophillic (poorly water soluble) drugs such as celecoxib and other drugs of same property are nifedipine, griseofulvin, cyclosporine, digoxin, itraconazole, carbamazepine, piroxicam, fl uconazole, indomethacin, steroids, ibuprofen, diazepam, finasteroids, difunisal etc., are formulated in self micro-emulsifying drug delivery system (SMEDDS) to improve effi cacy and safety.
A literature search reveals an exhaustive number of publications characterizing the self emulsified drug delivery system [5-12]. Reported studies use different methods for In vitro evaluation such as self emulsifi cation time, cumulative percent release, low frequency dielectric spectroscopy, zeta potential measurement and surface tensiometry. Particle size of SMEDDS after dilution was selected as criteria for In vitro evaluation. Smaller the particle size of SMEDDS more is the release of drug with better bioavailability. Particle size of around 20 nm gives total transparent system upon dilution, which acts as a solution. So, particle size was selected as criteria for the optimization. Screening and optimizing self-emulsified drug delivery system could be further simplified by the use of statistical design that requires only a small number of experiments, thereby eliminating the need for time-consuming and detailed ternary phase diagrams. The statistical optimization design has been documented for the formulation of pharmaceutical solid dosage forms [13-15]. Wehrle et al.[16] have reported the use of a sequential statistical design for optimizing the droplet size of a miconazole emulsion. Here SMEDDS were tried to optimize on the basis of particle size after dilution in 0.1N HCl, which are profoundly infl uenced by several formulation variables.
Celecoxib is a nonsteroidal antiinflammatory drug which selectively inhibits the enzyme, cyclooxygenase- 2 (COX-2). Celecoxib occurs as an odorless, white to off-white crystalline powder. The aqueous solubility of celecoxib at a pH less than 9 is about 5 μg/ml at 5–40°. Doses given for celecoxib in different indications range from 50-400 mg OD/BD. It is diffi cult for a drug to get dissolved in a limited volume of the acidic content in the stomach; hence celecoxib shows dissolution limited bioavailability [17-19]. It is a class-2 drug with poor solubility and high permeability through out the GIT. The bioavailability of celecoxib was found to be 22-40% when given in a capsule form. So celecoxib was taken as a model drug for the improvement of bioavailability [20].
The objective of the present work was to apply response surface methodology for the optimization of celecoxib self-micro emulsifying drug delivery system. As a part of optimization process, the main effects, interaction effects and the quadratic effects of the formulation ingredients were investigated. Excipients and their interaction were evaluated for their effect on the particle size of celecoxib SMEDDS after dilution. Particle size is particularly important since release rates are greatly infl uenced by particle size. Particle size is affected by formulation ingredients.
Materials and Methods
Celecoxib was a generous gift from Alkem Pvt Ltd. (Mumbai, India) Labrafil 2609 WL, labrasol, transcutol were generous gift from Colorcon Asia Pvt Ltd. (Goa, India). Cremophor EL was generous gift from BASF (Mumbai, India). Transparent hard gelatin capsules were gifted from Associated Capsule Group (Dhahanu, India).
Experimental design
Optimization of the celecoxib SMEDDS were done using 3 level factorial design. From the preliminary study Labrafil WL 2609 was selected as lipophile, Labrasol as a surfactant and Cremophor EL as a cosurfactant. Quantities of Labrafi l 2609, Labrasol and Cremophor EL were selected as the three factors for optimization. Three levels for each factor were used to construct experimental design. Levels for Labrafi l WL 2609 (0.1, 0.2, 0.3), Labrasol (0.1, 0.2, 0.3) and Cremophor EL (0.15, 0.25, 0.35) were selected from preliminary study. Particle size was selected as a desire to response for optimization. 32 experiments were planned as per 3 [3] factorial designs.
Since there are only 3 levels for each factor, the appropriate model is the quadratic model. The non-linear quadratic model generated by the design was: Y= +27.83+76.07×A-23.62×B- 43.83×C+52.72×A2+9.82×B2+27.20×C2-14.52×A×B- 32.38×A×C+12.1×B×C. Response surface diagram was constructed using Design Expert 6 version. Formulation was optimized with the help of response surface diagram.
Preparation of the celecoxib self micro emulsifying formulation
Accurately weighed 50 mg of celecoxib was mixed with 50 μl of transcutol in a borosil glass test tube. Labrafi l 2609 WL, labrasol and cremophor EL were added with the help of a positive displacement pipette and mixed on a cyclomixer to get a uniform mixture. Prepared formulations were filled in a transparent gelatin capsule (Size “0”). Capsule was sealed with the help of gelatin band to avoid leakage. Each capsule represented 50 mg of Celecoxib with 50 μl of transcutol in addition to the specifi ed amount of labrafil 2609 WL, labrasol and cremophor EL as given in Table 1.
| Independent Variables | Levels | ||
|---|---|---|---|
| Low | Middle | High | |
| A- Amount of Labrafil 2609 WL in ml | 0.1 | 0.2 | 0.3 |
| B- Amount of Labrasol in ml | 0.1 | 0.2 | 0.3 |
| C- Amount of Cremophor EL in ml | 0.15 | 0.25 | 0.35 |
SD representsstandarddeviation and CV representscoefficient of variationforeachstandardsolution (n=6).
Table 1: Variables and levels for 3 levels, 3 factorial design.
Particle size of the self-microemulsifi ed formulation filled in the capsule was determined using Coulter N4 Plus at 20º. The capsule was placed in 200 ml of 0.1N HCl. It was allowed to disintegrate for 5 min. Particle size was measured using the following parameters. Profile: Unimodel <2% CV<1000 nm, angle selected: 90.0, run time: 425 s, equilibrations time: 2 min, repetition: repeat 1 time for each angle.
Results and Discussion
Microemulsion region was found out by constructing pseudoternary phase diagrams. Approximate quantities of lipophiles (30%) and surfactant system (above 50%) were decided. Further optimization of the formulation was done by Design Expert software. 32 experiments were planned as per 3[3] factorial designs. Particle size of SMEDDS was selected as a response for optimization. The experimental runs and the observed response for the 32 formulations are given in Table 2. Based on the experimental design, the factor combination resulted in different particle size. The range of response was 334.3 nm in standard run 3 (maximum) and 13.5 nm in standard run 22 (minimum). The mathematics in the form of a polynomial equation for the measured response was obtained with statistical package Design expert® version 6 software for the experiment design is listed in Table 3. The polynomial equation relating the response Y and variables A,B,C as: Y=+27.83+76.07×A-23.62×B-43.83×C+52.72×A2+9.8 2×B2+27.20×C2-14.52×A×B-32.38×A×C+ 12.1×B×C, where, Y= particle size, A= quantity in ml for Labrafi l 2609 WL, B= quantity in ml for Labrasol and C= quantity in ml for cremophor EL.
| Standard | Factor-1 | Factor-2 | Factor-3 | Response |
|---|---|---|---|---|
| Run | A | B | C | Particle size (nm) |
| 16 | 0.1 | 0.3 | 0.25 | 20.2 |
| 26 | 0.2 | 0.3 | 0.35 | 16.2 |
| 1 | 0.1 | 0.1 | 0.15 | 60 |
| 11 | 0.2 | 0.1 | 0.25 | 49.6 |
| 17 | 0.2 | 0.3 | 0.25 | 23.8 |
| 22 | 0.1 | 0.2 | 0.35 | 13.5 |
| 23 | 0.2 | 0.2 | 0.35 | 21.2 |
| 28 | 0.2 | 0.2 | 0.25 | 19.9 |
| 12 | 0.3 | 0.1 | 0.25 | 195.4 |
| 6 | 0.3 | 0.2 | 0.15 | 240 |
| 13 | 0.1 | 0.2 | 0.25 | 32 |
| 4 | 0.1 | 0.2 | 0.15 | 48.4 |
| 25 | 0.1 | 0.3 | 0.35 | 16.9 |
| 14 | 0.2 | 0.2 | 0.25 | 19.6 |
| 10 | 0.1 | 0.1 | 0.25 | 22.4 |
| 5 | 0.2 | 0.2 | 0.15 | 103.6 |
| 2 | 0.2 | 0.1 | 0.15 | 164.4 |
| 24 | 0.3 | 0.2 | 0.35 | 130 |
| 32 | 0.2 | 0.2 | 0.25 | 21 |
| 3 | 0.3 | 0.1 | 0.15 | 334.3 |
| 9 | 0.3 | 0.3 | 0.15 | 228.6 |
| 20 | 0.2 | 0.1 | 0.35 | 47 |
| 19 | 0.1 | 0.1 | 0.35 | 24.7 |
| 29 | 0.2 | 0.2 | 0.25 | 22.2 |
| 8 | 0.2 | 0.3 | 0.15 | 61.3 |
| 7 | 0.1 | 0.3 | 0.15 | 24.4 |
| 15 | 0.3 | 0.2 | 0.25 | 155.8 |
| 21 | 0.3 | 0.1 | 0.35 | 133.2 |
| 27 | 0.3 | 0.3 | 0.35 | 73.4 |
| 30 | 0.2 | 0.2 | 0.25 | 20.5 |
| 18 | 0.3 | 0.3 | 0.25 | 141 |
| 31 | 0.2 | 0.2 | 0.25 | 21.5 |
Table 2: Experimental Design and Response for 3 Level, 3 Factorial Design Particle Size Analysis.
| Variables | Quantity | Expected | Observed |
|---|---|---|---|
| (ml) | particle size* | Particle size* | |
| A-Labrafil 2609WL | 0.16 | ||
| B-Labrasol | 0.17 | 24.87 | 28.33 |
| C-Cremophor EL | 0.22 |
Table 3: Optimized Values Obtained by Applying Constraints on Variables and Response.
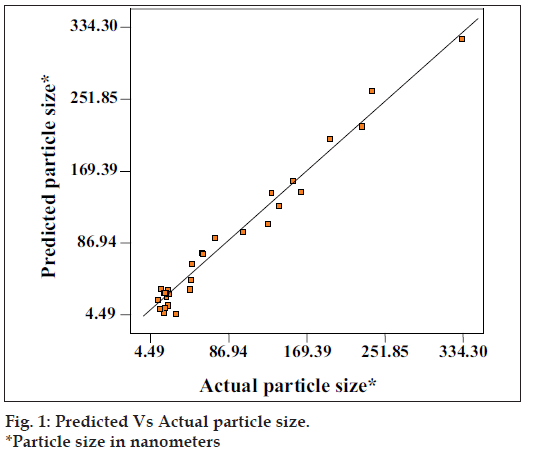
The above equation represents the quantitative effect of process variables (A, B, C) and their interaction on the response (Y). The values of the coeffi cient A, B and C are related to the effect of these variables on the response Y. Coeffi cient with more than one factor term and those with higher order terms represent interaction term. A positive sign represent a synergistic effect, while a negative sign indicate an antagonistic effect. The values of the coeffi cient A, B and C were substituted in the equation to obtain the theoretical values of Y. The theoretical (predicted) and the observed values were in resonably good agreement as seen from fi g. 1.
The signifi cance of the ratio of mean square variation due to regression and residual error was tested using analysis of variance (ANOVA). The ANOVA indicated a signifi cant (P<0.05) effect of factors on response.
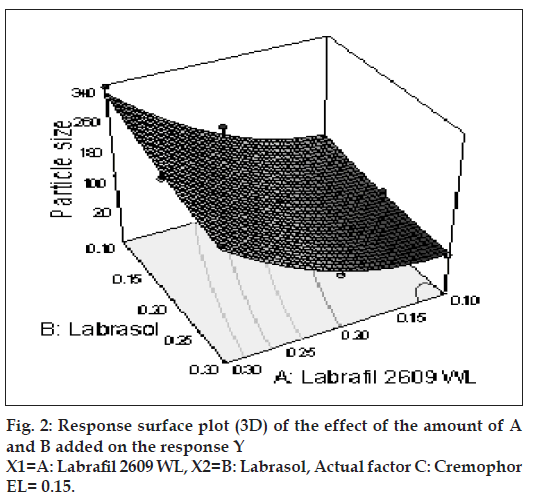
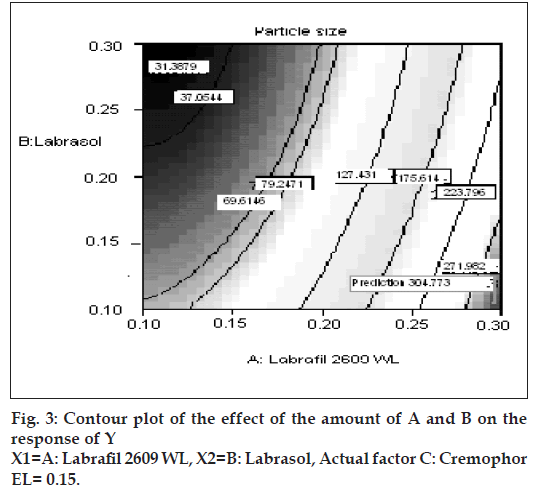
The relationship between the dependent and independent variables was further elucidated using contour and response surface plots. The effects of A (labrafil 2609 WL) and B (labrasol) and their interaction on Y (Particle size) at a fi xed level of C (cremophor EL) are given in figs. 2 and 3. At low level of B (Amount of labrasol added) Y increases from 74.72 nm to 314.03 nm when amount A increases from 0.1 ml to 0.3 ml. Similarly, at high level of B, Y increases from 31.6 nm to 219.53 nm when A increases from 0.1 to 0.3 ml as shown in fi g. 3.
The possible explanation for this is that at higher concentration of lipophile and with a low amount of added labrasol the proportion of surfactant that facilitate water penetration decreases, and the mixture becomes more lipophilic causing increase difficulty in emulsifi cation, hence increase in the particle size [21]. This was shown in the fi gs. 4 and 5. When effect of B, C and their interaction on Y at a fixed level of A was observed, it was found that, at low level of B (amount of labrasol), Y decreases from 74.4 nm to 26.99 nm, as amount of cremophor EL increases from 0.15 to 0.35 ml. At higher level of B, Y remains approximately constant (32 nm) at level of 0.15 and 0.35 ml of C but decrease to 4.93 nm at 0.25 ml. The possible explanation for this is that cremophor EL (surfactant) strongly localized at the surface of the emulsion droplet reduces interface free energy and provide a mechanical barrier to coalescence resulting in a thermodynamically spontaneous dispersion [22]. However, at high cremophor EL concentration because of its high viscosity, progress of effi cient emulsifi cation may be compromised due to viscous liquid crystalline gel forming at the surfactant-water interface.
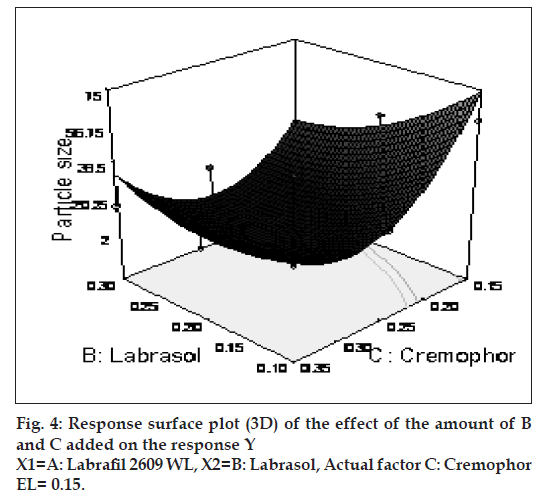
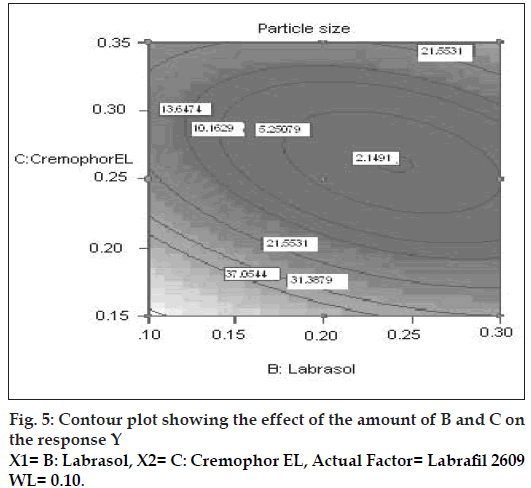
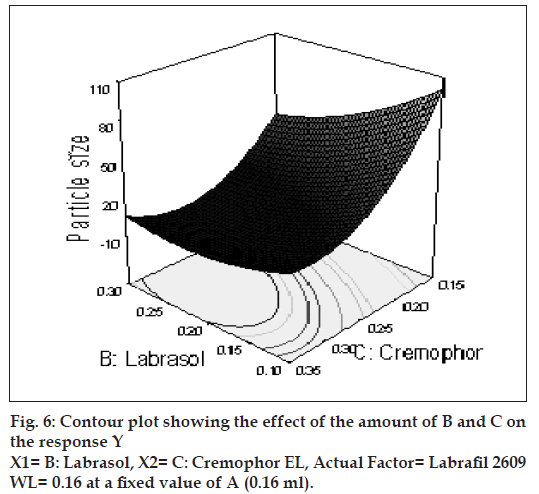
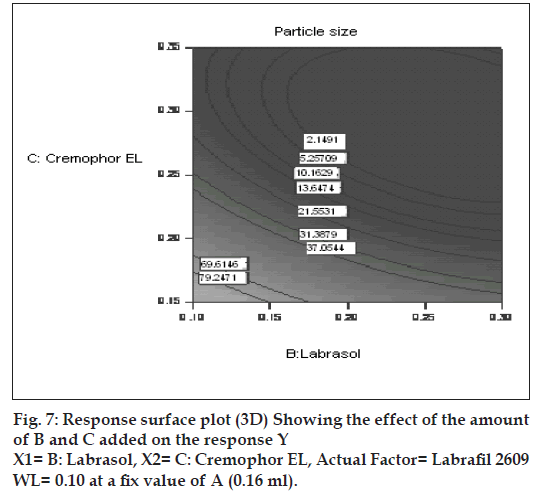
The effect of B and C and their interaction on Y at a fi xed level of A are given in fi gs. 4 and 5. At low level of C (0.15 ml cremophor EL), Y decrease from 74.21 nm to 31.68 nm as the amount of Labrasol increases from 0.1 to 0.3 ml. At middle level of C, Y changed from 23.40 nm to 4 nm to 5.20 nm, as B changed from 0.1 to 0.2 to 0.3 ml. At high level of C, Y changes from 26.18 nm to 19 nm to 31 nm, as B changed from 0.1 to 0.2 to 0.3 ml. Particle size of the droplet was found minimum (2.11 nm) at a ratio of Cremophor EL to labrasol 1.125, when labrafi l 2609 WL was at lower level (Fig. 6). Above results can be explained on the basis of required HLB value. Here quantities of labrasol and Cremophor EL are critical. Microemulsion gives minimum particle size at a critical ratio of surfactant system [23]. Quantities of surfactants at this level provide required HLB value to emulsify lipophile and give microemulsion of lowest particle size.
After generating the polynomial equation relating the dependent and independent variables, the process was optimized for the response Y. Optimization was performed to obtain the levels of A, B and C, which minimize Y. Quantity of A, B and C was selected, which was suitable to be fi lled in a “0” size hard gelatin capsule. Quantity of A should not be less then 0.160 ml otherwise drug may precipitate out from the formulation. Figs. 6 and 7 show response surface diagram (3D). Particle size of the optimized formulation below 30 nm was taken as a constraint for Y. To verify these values, a new formulation was prepared according to the predicted levels of A, B and C. Obtained Y was in close agreement with the predicted value. The predicted and observed values are shown in Table 3. This demonstrates reliability of the optimization procedure in predicting the particle size of SMEDDS.
Optimization of the self microemulsifying formulation of celecoxib was performed using 3 factor, 3 level design. The amount of added A (labrafi l 2609 WL), B (labrasol) and C (cremophor EL) showed signifi cant effect on the particle size and physical appearance of the resultant microemulsion on dilution in 0.1N HCl. The quantitative effect of these factors at different levels was predicted using polynomial equation. Response methodology was then used to predict the levels of the factor A, B and C required to obtain an optimum formulation with particle size bellow 30 nm. A new formulation was prepared according to these levels. Observed response was in close agreement with the predicted values of the optimized formulation, thereby demonstrating the feasibility of the optimization procedure in developing self micro emulsifying delivery of celecoxib.
Acknowledgements
The authors wish to acknowledge AICTE sponsored Grant for procuring the software required. The authors are grateful to Alkem Pvt. Ltd. for providing Celecoxib as a gift sample. The authors are also grateful to Colorcon Asia Ltd, BASF and ACG for the various gift samples.
References
- Perng CH, Kearney AS, Patel K, Palepu NR, Zuber G. Investigation of formulation approaches to improve the dissolution of SB-210661: A poorly water soluble 5-lipoxygenase inhibitor. Int J Pharm 1998;176:31-8.
- Nazzal S, Guven N, Reddy IK, Khan MA. Preparation and characterizationof Coenzyme Q10- Eudragit® solid dispersion. Drug Develop Ind Pharm 2002;28:49-57
- Patravale VB, Date AA, Kale AA. Oral self micro emulsifying systems: Potential in DDS, pharma technology. Express Pharma Pulse 2003;29:44-8.
- Charman SA, Charman WN, Rogge MC, Wilson TD, Dutko FJ, Pouton CW. Self emulsifying drug delivery systems: Formulation and Biopharmaceutics Evaluation of an Investigational lipophillic Compound. Pharm Res 1998;9:87-93.
- Groves MJ, de Galindez DA. Rheological characterization of self-emulsifying oil/surfactant systems. Acta Pharm Suecica 1976;13:353-60.
- Yalabik-Kas HS, Groves MJ. Zeta potential of droplets prepared from a self-emulsifying oil. Drug Develop Ind Pharm 1984;10:211-23.
- Craig DQ, Barker SA, Banning D, Booth SW. Investigation into the mechanisms of self-emulsification using particle size analysis and low frequency dielectric spectroscopy. Int J Pharm 1995;114:103-10.
- Kim CK, Ryuu SA, Park KM, Lim SJ, Hwang SJ. Preparation and physicochemical characterization of phase inverted water/oil microemulsion containing Cyclosporin A. Int J Pharm 1997; 147:131-4.
- Cortesi R, Esposito E, Maietti A, Menegatti E, Nastruzzi C. Formulation study for the antitumor drug camptothecin: Lilposomes, micellar solutions and a microemulsion. Int J Pharm 1997;159:95-103.
- Prinderre P, Piccerelle P, Cauture E, Kalantzis G, Joachim J. Formulation and evaluation of o/w emulsions using experimental design. Int J Pharm 1998;163:73-9.
- Gullapalli RP, Sheth BB. Influence of an optimized nonionic emulsifier blend on properties of oil in water emulsions. Eur J Pharm Biopharm 1999;48:233-8.
- Kommuru TR, Gurley B, Khan MA, Reddy IK. Self-emulsifying drug delivery systems (SEDDS) of coenzyme Q10: formulation development and bioavailability assessment. Int J Pharm 2001;212:233-46.
- Karachi AA, Khan MA. Box-Behnken design for the optimization of formulation variables of indomethacin co-precipitates with polymer mixtures. Int J Pharm 1996;131:9-17.
- Singh SK, Reddy IK, Khan MA. Optimization and characterization of controlled release pellets coated with an experimental latex: II, Cationic drug. Int J Pharm 1996;141:179-95.
- Sastry SV, Reddy IK, Khan MA. Atenolol gastrointestinal therapeutic system: Optimization of formulation variables using response surface methodology J Control Release 1997;45:121-30.
- Wehrle P, Korner D, Benita S. Sequential statistical optimization of a positively charged submicron emulsion of Miconazole. Pharm Develop Tech 1996;1:97-111.
- Thomson Micromedex. Advice for the patient drug information in lay language. 25th ed, vol. 22. USP DI, 2005. p. 402-4
- Sweetman SC. editor. Martindale: The complete Drug Reference. 34th ed. London: Pharmaceutical Press; 2005. p. 25-6.
- AHFS (American Hospital Formulary Service). Drug Information. 2001. p. 1976-77.
- Paulson SK, Vaughn MB, Jessen SM, Lawal Y, Gresk CJ, Yan B, et al. Pharmacokinetics of Celecoxib after oral administration in dogsand humans: Effect of food and site of absorption. J PharmacolExpTher 2001;297:638-45.
- Halbaut L, Berbe C, Del pozo A. An investigation into physical and chemical properties of semi-solids self-emulsifying systems for hard gelatin capsules. Int J Pharm 1996;130:203-12.
- Reiss H. Entropy-induced dispersion of bulk liquids. J Colloid Interface Sci 1975;53:61-70.
- Bachynsky MO, Shah NH, Patel CI, Malick AW. Factors affecting the efficiency of a self-emulsifying oral delivery system. Drug Develop Ind Pharm 1997;23:809-16.
