- *Corresponding Author:
- D. A. Shah
Indukaka ipcowala college of pharmacy, P. B. No. 53, Vitthal udyognagar-388 121, India
E-mail: dimalgroup@yahoo.com
| Date of Submission | 28 June 2008 |
| Date of Revision | 15 September 2008 |
| Date of Acceptance | 26 November 2008 |
| Indian J Pharm Sci, 2008, 70 (6): 754-760 |
Abstract
A simple, specific, accurate and stability indicating reversed phase high performance liquid chromatographic method was developed for the simultaneous determination of atorvastatin calcium and amlodipine besylate in tablet dosage forms. A phenomenex Gemini C-18, 5 mm column having 250´4.6 mm i.d. in isocratic mode, with mobile phase containing 0.02 M potassium dihydrogen phosphate:acetonitrile:methanol (30:10:60, v/v/v) adjusted to pH 4 using ortho phosphoric acid was used. The flow rate was 1.0 ml/min and effluents were monitored at 240 nm. The retention times of atorvastatin calcium and amlodipine besylate were 11.6 min and 4.5 min, respectively. The calibration curves were linear in the concentration range of 0.08-20 µg/ml for atorvastatin calcium and 0.1-20 µg/ml for amlodipine besylate. Atorvastatin calcium and amlodipine besylate stock solutions were subjected to acid and alkali hydrolysis, chemical oxidation and dry heat degradation. The degraded product peaks were well resolved from the pure drug peak with significant difference in their retention time values. The proposed method was validated and successfully applied to the estimation of atorvastatin calcium and amlodipine besylate in combined tablet dosage forms.
Keywords
Atorvastatin calcium, Amlodipine besylate, Degradation, Reversed phase liquid chromatography, Stability indicating, Validation
Atorvastatin calcium (ATV) is chemically 1H-pyrrole-1-heptanoic acid, [R–(R&*,R*)]–2-(4- flurophenyl)-β,δ-dihydroxy-5-(1-methylethyl)-3- phenyl-4-[(phenylamino)carbonyl], calcium salt (2:1). Atorvastatin calcium is an inhibitor of 3-hydroxy-3- methyl glutaryl coenzyme A (HMG-Co A) reductase. This enzyme catalyses the conversion of HMG-Co A to mevalonate, an early and rate limiting step in cholesterol biosynthesis [1-2]. Amlodipine besylate (AML) is 3-ethyl-5-methyl (4RS)-2-[(2-amino ethoxy) methyl]-4-(2-chlorophenyl)-6-methyl-1,4- dihydropyridine-3,5-dicarboxylate, benzenesulphonate. Amlodipine besylate is a calcium channel blocker. It inhibits the trans membrane influx of calcium ions into vascular smooth muscles and cardiac muscle [3]. The combination dosage form of atorvastatin calcium and amlodipine besylate are available in the market for the treatment of hypertension, chronic stable angina, vasospastic angina, in elevated serum triglyceride levels, primary dysbetalipoproteinemia.
Literature survey revealed that extractive spectrophotometery [4], liquid chromatographic (LC) [5-9], GC-MS [10], LC-MS [11], LC- electrospray tendem mass spectrometry [12-14] and HPTLC [15] methods have been reported for the estimation of atorvastatin calcium. Amlodipine besylate is official in British Pharmacopoeia [16]. Different LC methods have been reported for the estimation of AML [17-21]. For the estimation of amlodipine and atorvastatin combination, spectrophotometeric [22-24], HPTLC [25] and LC [26-29] methods have been reported. Present study involves development of a stability indicating liquid chromatographic method for the estimation of ATV and AML in combination dosage form.
Materials and Methods
The liquid chromatographic system of Shimadzu make containing LC-10AT (VP series) pump, variable wavelength programmable UV/Vis detector SPD- 10AVP and rheodyne injector (7725i) with 20 µl fixed loop was used. Chromatographic analysis was performed using Spinchrom software. A Phenomenex Gemini C18 column with 250×4.6 mm i.d. and 5 µm particle size was used. Analytically pure ATV was procured as gift sample from M/s Blue Cross laboaratory Ltd., (Mumbai, India). AML was procured as gift sample from M/s Torrent pharmaceuticals Ltd (Ahmedabad, India). The purity of ATV and AML were found to be 99.65% and 99.35%, respectively according to the manufacturer’s analysis certificates. Methanol, acetonitrile, water (E. Merck, Mumbai, India) was of LC grade, while potassium dihydrogen phosphate and o-phosphoric acid (S.D. fine chemicals, Mumbai, India) were of analytical grade used for the preparation of mobile phase. Tablet formulation A (AVAS-AM, Micro Laboratories Ltd., India) and B (STARCAD, Lupin Labs. Ltd., India) containing labeled amount of 10 mg of atorvastatin and 5 mg of amlodipine were purchased from local market.
Preparation of mobile phase and stock solution
Potassium dihydrogen phosphate was weighed (0.82 g) and dissolved in 300 ml of water. This solution was mixed with 600 ml of methanol and 100 ml of acetonitrile. The pH was adjusted to 4.0±0.1 using 0.1 M o-phosphoric acid. The solution was filtered, sonicated for 10 minutes for degassing and used as a mobile phase.
Stock solutions were prepared by weighing 25 mg each of AML and ATV and transferring to 2 separate 25 ml volumetric flasks. Volumes were made up to the mark with methanol. The above solutions were further diluted with mobile phase to obtain working standard solutions of 100 µg/ml of each.
Chromatographic conditions
A reversed phase C-18 column equilibrated with mobile phase comprising of 0.02 M potassium dihydrogen phosphate: acetonitrile:methanol (30:10:60, v/v/v; pH 4) was used. Mobile phase flow rate was maintained at 1 ml/min and eluent were monitored at 240 nm. A 20 µl of sample was injected using a fixed loop, and the total run time was 15 min. All the chromatographic separations were carried out at controlled room temperature (20-25°).
Calibration curves for AML and ATV
Appropriate aliquots of AML and ATV working standard solutions were taken in different 10 ml volumetric flasks and volume was made up to the mark with mobile phase to obtain final concentrations of 0.1, 0.5, 1, 5, 10, 20 µg/ml of AML, 0.08, 0.5, 1, 5, 10, 20 µg/ml of ATV, respectively. The solutions were injected using a 20 µl fixed loop system and chromatograms were recorded. Calibration curves were constructed by plotting peak area versus concentrations of the drug and regression equations were computed for ATV and AML.
Analysis of Marketed Formulations
Twenty tablets were weighed accurately and finely powdered. Tablet powder equivalent to 10 mg ATV (and 6.70 mg of AML) was taken in 50 ml volumetric flask. To the above flask, 20 ml of methanol was added and the flask was sonicated for 5 minutes. The solution was filtered in another 50 ml volumetric flask using Whatman filter paper (No.1) and volume was made up to the mark with the same solvent.
Appropriate volume of the aliquot was transferred to a 10 ml volumetric flask and the volume was made up to the mark with the mobile phase to obtain a solution containing 10 µg/ml of ATV and 6.7 µg/ ml of AML. The solution was sonicated for 10 min. It was injected as per the above chromatographic conditions and peak area was recorded. The quantifications were carried out by keeping these values to the straight line equation of calibration curve.
Validation
The method was validated for accuracy, precision, specificity, detection limit, quantitation limit and robustness. The accuracy of the method was determined by calculating recoveries of AML and ATV by method of standard additions. Known amount of AML (0, 0.5, 5, 20 µg/ml) and ATV (0, 0.5, 5, 20 µg/ml) were added to a pre quantified sample solutions and the amount of AML and ATV were estimated by measuring the peak area and by fitting these values to the straight-line equation of calibration curve.
The instrument precision was evaluated by injecting the solution containing AML (5 µg/ml) and ATV (10 µg/ml) six times repeatedly and peak area was measured. The results are reported in terms of relative standard deviation. The intra-day and inter-day precision study of AML and ATV was carried out by estimating the corresponding responses 3 times on the same day and on 3 different days (first, second and third day) for 3 different concentrations of AML (0.5, 5, 20 µg/ml) and ATV (0.5, 5, 20 µg/ml), and the results are reported in terms of relative standard deviation (RSD). The specificity was estimated by spiking commonly used excipient (starch, talc and magnesium stearate) into a pre weighed quantity of drug. The chromatogram was taken by appropriate dilutions and the quantities of drugs were determined.
The detection limit is defined as the lowest concentration of an analyte that can reliably be differentiated from background levels. Limit of quantification of an individual analytical procedure is the lowest amount of analyte that can be quantitatively determined with suitable precision and accuracy. LOD and LOQ were calculated using following equation as per ICH guidelines. LOD = 3.3 ×σ /S and LOQ = 10 ×σ /S, where σ is the standard deviation of y-intercepts of regression lines and S is the slope of the calibration curve.
Robustness of the method was studied by deliberately changing the experimental conditions like flow rate, percentage of organic phase and also by observing the stability of the sample solution at 25±2° for 24 h. The sample solution was assayed at every 6 h interval up to 24 h.
Forced degradation study
Stress degradation study using acid and alkali hydrolysis, chemical oxidation and dry heat degradation was carried out and interference of the degradation products were investigated. ATV and AML were weighed (25 mg each) and transferred to two separate 25 ml volumetric flasks and diluted up to the mark with mobile phase. These stock solutions were used for forced degradation studies.
Forced degradation in basic media was performed by taking 1 ml stock solutions of AML and ATV (1000 µg/ml) in two different 25 ml volumetric flasks and 5 ml of 0.1 N NaOH was added. Similarly, 1 ml aliquots of stock solutions of ATV and AML were taken in same 25 ml volumetric flask and 5 ml 0.1 N NaOH was added. All the flasks were heated in a water bath at 80o for 1 h. After heating solutions were neutralized and diluted up to the mark with mobile phase. Appropriate aliquots were taken from the above solutions and diluted with mobile phase to obtain final concentration of 6 µg/ml of ATV and AML separately and in the mixture. Similarly, forced degradation in acidic medium was performed using 0.1 N HCl.
To perform oxidative stress degradation, appropriate aliquots of stock solutions of ATV and AML (1000 µg/ml) were taken in two different 25 ml volumetric flasks and 5 ml of 3% hydrogen peroxide was added. Similarly, appropriate aliquots of stock solutions of ATV and AML were taken in same 25 ml volumetric flaks and 5 ml 3% hydrogen peroxide was added. All the mixtures were heated in a water bath at 80o for 1 h. After heating all the solutions were diluted with mobile phase to obtain final concentration of 6 µg/ml of ATV and AML separately and in mixture.
To study dry heat degradation, solid drugs were exposed in oven at 80o for 2 h. After 2 h of heating 25 mg each of ATV and AML were weighed and transferred to two separate volumetric flasks (25 ml) and diluted up to the mark with the mobile phase. Solutions were further diluted by taking appropriate aliquots in different 10 ml volumetric flasks to obtain final concentration of 10 µg/ml of ATV and AML. All the reaction solutions were injected in the liquid chromatographic system and chromatograms were recorded.
Results and Discussion
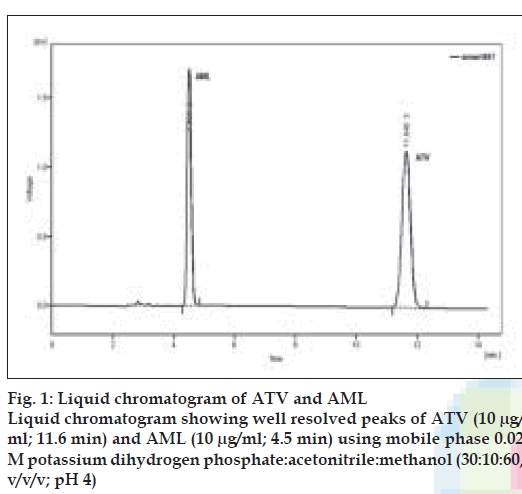
Optimization of mobile phase was performed based on resolution of the drugs and degradation products, asymmetric factor and theoretical plates obtained for AML and ATV. The mobile phase consisting of 0.02 M potassium dihydrogen phosphate: acetonitrile:methanol (30:10:60, v/v/v; pH 4) was selected which gave sharp, well-resolved peaks for AML and ATV (fig. 1). The retention times for AML and ATV were 4.5 and 11.6 min, respectively. The asymmetric factors for AML and ATV were 1.3 and 1.0, respectively. UV overlaid spectra of AML and ATV showed that both the drugs absorbed appreciably at 240 nm, so the same was selected as the detection wavelength during the studies (fig. 2). The calibration curve was found to be linear over the range of 0.1-20 µg/ml for AML and 0.08-20 µg/ml for ATV. The data of regression analysis of the calibration curves are shown in Table 1.
| Parameters | AML | ATV |
|---|---|---|
| Linearity range (µg/ml) | 0.1 - 20 | 0.08- 20 |
| Slope | 24.45 | 29.66 |
| Standard deviation of slope | 0.188 | 0.828 |
| Intercept | -0.253 | -1.16 |
| Standard deviation of intercept | 0.0301 | 0.797 |
| Correlation coefficient | 0.9999 | 0.9998 |
Table 1: Regression analysis of the calibration curve for the proposedmethod
The accuracy of the method was determined by calculating recoveries of AML and ATV by method of standard additions. The recoveries obtained were 98.73-99.83% for AML and 98.52-99.38% for ATV, respectively. The high values indicate that the method is accurate. Instrument precision was determined by performing injection repeatability test and the RSD values for AML and ATV were found to be 0.53% and 0.36%, respectively. The intra-day and inter-day precision studies were carried out. For the intra-day study RSD values were found to be 0.35- 1.07% for AML and 0.58-1.32% for ATV and for inter-day precision study RSD values were found to be 0.36- 1.86% for AML and 0.66-1.74% for ATV, respectively. The low RSD values indicate that the method is precise. The detection limits for AML and ATV were 0.04 µg/ml and 0.03 µg/ml, respectively, while quantitation limits were 0.1 µg/ml and 0.08 µg/ml, respectively. The above data shows that a nanogram quantity of both the drugs can be accurately and precisely determined. The validation parameters are summarized in Table 2 and the system suitability test parameters are shown in Table 3.
| Parameters | AML | ATV |
|---|---|---|
| Detection limit (µg/ml) | 0.04 | 0.03 |
| Quantitation limit (µg/ml) | 0.1 | 0.08 |
| Accuracy (%) | 98.73-99.83% | 98.52-99.38% |
| Precision (RSDa,%) | ||
| Intra-day precision (n=3) | 0.35-1.07% | 0.58-1.32% |
| Inter-day precision (n=3) | 0.36- 1.86% | 0.66- 1.74% |
| Instrument precision (RSDa) | 0.53% | 0.36% |
| Robustness98.37-100.25% | 98.37-100.25% | 97.45-99.58% |
aRSD is relative standard deviation and ‘n’ is number of determinations
Table 2: Summary of validation parameters
| System suitability parameters | ATV | AML |
|---|---|---|
| Retention time | 11.6 min | 4.5 min |
| Theoratical plates/ meter | 10130 | 6856 |
| Assymetric factor | 1.0 | 1.3 |
| Resolution | 21 | - |
Table 3: System suitability test parameters for the proposed method
Robustness of the method was studied by changing the flow rate of the mobile phase from 1 ml/min to 0.8 ml/min and 1.2 ml/min. Using 1.2 ml/min flow rate, retention time for AML and ATV were observed to be 4.0 and 10.2 min, respectively and with 0.8 ml/ min flow rate, retention times for AML and ATV were observed to be 4.9 and 12.8 min, respectively without affecting the resolution of the drugs. When mobile phase composition was changed to 0.02 M potassium dihydrogen phosphate:acetonitrile:methanol (25:15:60, v/v/v; pH 4) by increasing percentage of acetonitrile, the retention time for AML and ATV were observed to be 4.2 and 10.9 min, respectively. The solution stability study revealed that AML and ATV solutions were stable for 24 h without detectable degradation and the percentage recovery of both the drugs were found to be more than 97%.
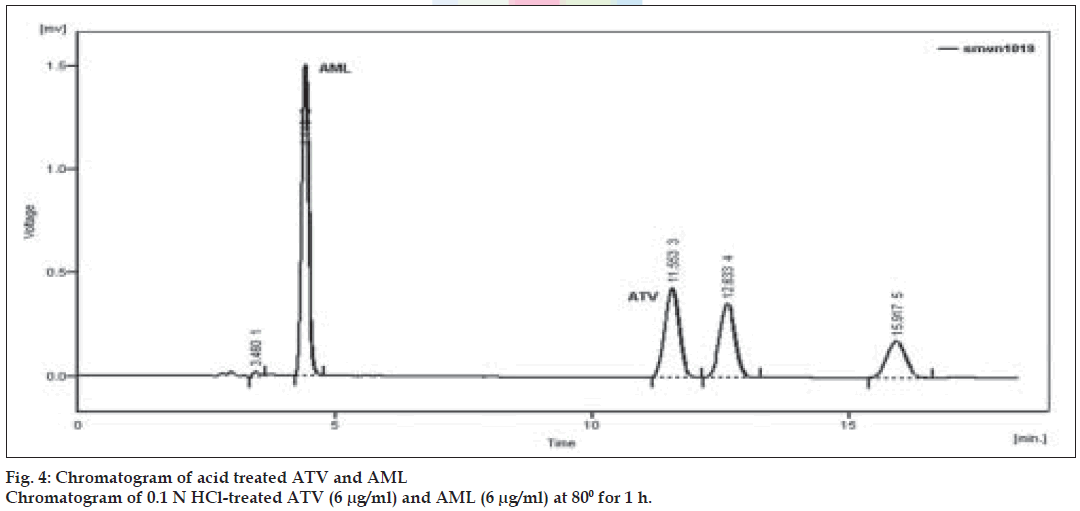
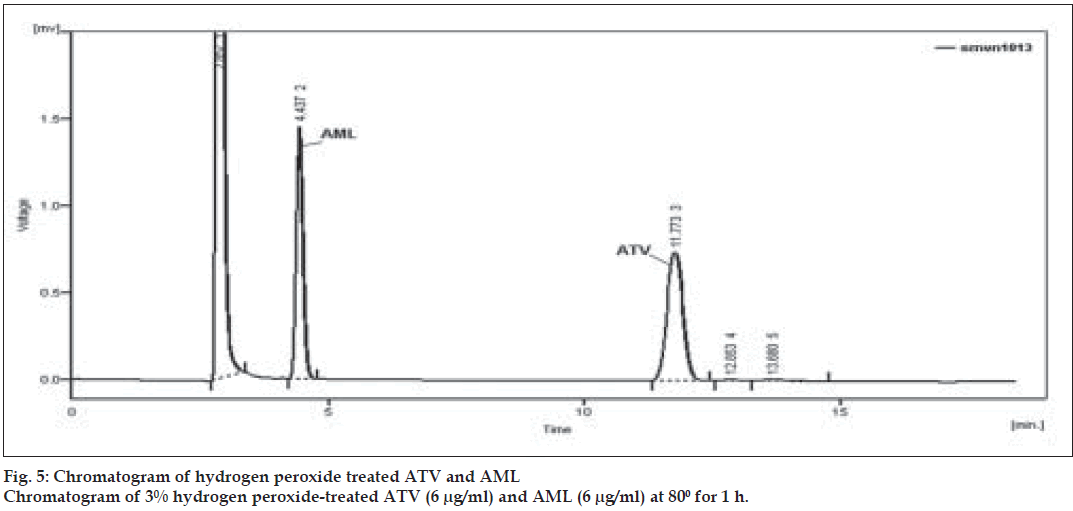
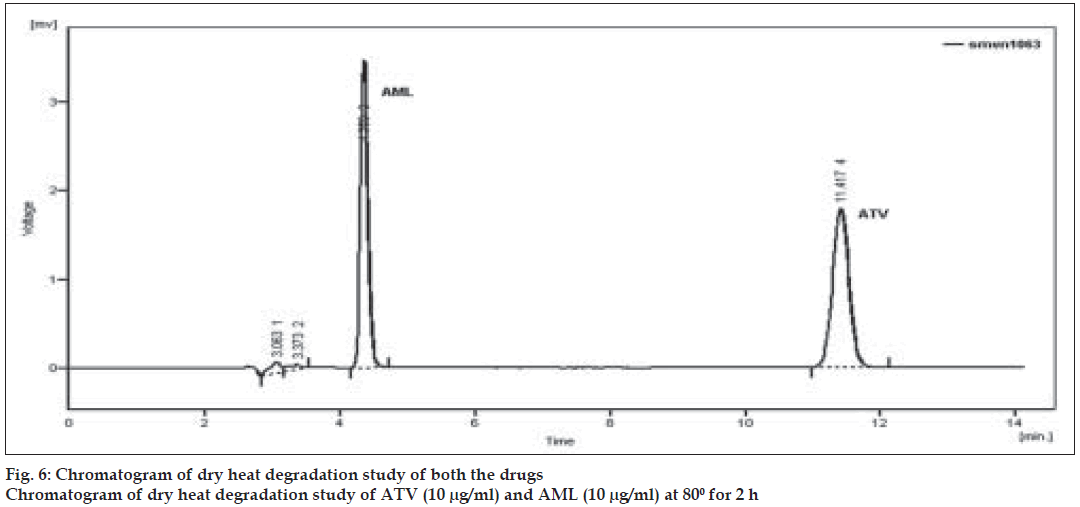
Forced degradation study was carried out by subjecting both the drugs to acid and alkali hydrolysis, chemical oxidation and dry heat degradation conditions. The chromatograms of base degraded sample showed degradation product peaks at retention time (RT) 2.95, 3.11 and 3.86 min for AML and ATV was found to be stable to base degradation (fig. 3). The peaks of the degradation products were well resolved from the drug peaks. Acid hydrolysis study showed that AML was stable in acidic condition but ATV gave degradation product peaks at RT 12.63 and 15.92 min (fig. 4). Oxidative stress degradation resulted in degradation product peaks at RT 12.85 and 13.68 min for ATV and AML was indicated to be stable (fig. 5). Dry heat degradation study resulted in to degradation product peaks at 3.06 and 3.37 min for AML and ATV was found to be stable (fig. 6).
The degradation study thereby indicated that AML was stable to acid and chemical oxidation study while it was susceptible to base hydrolysis and dry heat degradation. ATV was indicated to be susceptible to acid hydrolysis and chemical oxidation, with maximum degradation in acid (Table 4). Under above condition, specificity was demonstrated as no degradation products from different stress conditions affected determination of ATV and AML.
| Condition | Time (h) | Recovery (%) | Retention time of degradation products | ||
|---|---|---|---|---|---|
| ATV | AML | ATV | AML | ||
| Base 0.1 N NaOHb | 1 | 97.56 | 16.55 | - | 2.95, 3.11, 3.86 |
| Acid 0.1 N HClb | 1 | 38.04 | 96.36 | 12.63, 15.92 | - |
| 3% hydrogen peroxideb | 1 | 82.58 | 97.51 | 12.85, 13.68 | - |
| Dry heatb | 2 | 97.92 | 94.62 | - | 3.06, 3.37 |
bsamples were heated at 80° for specified period of time.
Table 4: Forced degradation study of atv And aml for the proposed method
The proposed method was applied to the determination of AML and ATV in their combined dosage form (Tablet A and B). The results for AML and ATV were comparable with the corresponding labeled amounts (Table 5). Compared to the reported methods [26-29], the proposed liquid chromatographic method is simple, accurate, specific and degradation products peaks are well resolved from the drug peaks.
| Formulations | Labelled Amount(mg) | %Recoveryc | ||
|---|---|---|---|---|
| ATV | AML | ATV | AML | |
| A | 10.34 | 6.93 | 98.66±0.68 | 98.21±0.98 |
| B | 10.34 | 6.93 | 98.80±1.05 | 99.90±0.82 |
cmean±standard deviation of three determinations; Tablet formulation A is AVASAM (Micro Laboratories Ltd., India) and B is Starcad (Lupin Labs. Ltd., India) containing labeled amount of 10 mg of atorvastatin and 5 mg of amlodipine.
Table 5: Assay results of tablet dosage form using proposed method
Acknowledgements
Authors are grateful to M/s Torrent Pharmaceutical Ltd., Ahmedabad, India for providing gift sample of AML and M/s Blue cross Labs. Ltd. Mumbai, India for providing gift sample of ATV.
References
- Budavari S, editor. The Merck Index. 12th ed. Whitehouse station (NJ):Merck and Co. Inc; 1996. p. 897.
- Gennaro AE, editor. Remington.s-The science and practice of pharmacy.20th ed. Vol. 2. Easton (PA): Mack Publishing Co; 2000. p. 1294.
- O.Nell MJ, editor. The Merck Index. 13th ed. Whitehouse Station, NJ:Merck and Co. Inc; 2001. p. 86.
- Erk N. Extractive spectrophotometric determination of atorvastatin inbulk and pharmaceutical formulations. Anal Lett 2003;36:2699-711.
- Shen HR, Liz D, Zhong MK. HPLC assay and pharmacokinetic studyof atorvastatin in beagle dog after oral administration of atorvastatinself-micro emulsifying drug delivery system. Pharmazie 2006;61:18-20.
- Verd JC, Peris C, Alergret M, Diaz C, Hernandez ZG, Sanchez RM.Different effect of simvastatin and atorvastatin on key enzyme involvedin VLDL synthesis and catabolism on high fat / cholesterol rabbit. BrJ Pharmacol 1999;127:1479-85.
- BleskeBE, Willis RA, Anthony M, Casselberry N, Datwani M, UhleyVE. The effect of pravastatin and atorvastatin on coenzyme Q10. AmHeart J 2001;142:262.
- Altuntas TG, Erk N. Liquid chromatographic determination ofatorvastatin in bulk drug, tablets and human plasma. J LiqChromatogrRelatTechnol 2004;27:83-93.
- Erturk S, Aktas ES, Ersoy L, Ficicioglu S. A HPLC method for thedetermination of atorvastatin and its impurities in bulk drugs andtablets. J Pharm Biomed Anal 2003;33:1017-23.
- McKenney JM, McCormick LS, Weiss S, Koren M, KafonekS, Blanck DM.A randomized trial of the effects of atorvastatinand niacin in patients with combined hyperlipidaemic or isolatedhypertriglyceridemia, collaborative atorvastatin study group. Am J Med1998;104:137-43.
- Nirogi RV, Kandikere VN, Shukla M, Mudigonda M, Maurya S,Boosi R, et al. Simultaneous quantification of atorvastatin and activemetabolites in human plasma by LC-MS using rosuvastatin as internalstandard. Biomed Chromatogr 2006;20:924-36.
- Miao XS, Metcalfe CD. Determination of cholesterol loweringstain dugs in aqueous samples using liquid chromatographyelectrosprayionization tandem mass spectrometry. J ChromatographyA 2003;998:133-41.
- Jemal M, Ouyang Z, Chen BC, Teitz D. Quantitation of the acidand lactone forms of atorvastatin and its biotransformation productsin human serum by high performance liquid chromatography withelectrospray tandem mass spectrometry. Rapid Commun Mass Spectrom1999;13:1003-15.
- Bullen WW, Miller RA, Hayes RN. Development and validation of ahigh performance liquid chromatography- tandem mass spectrometryassay for atorvastatin, ortho-hydroxy atorvastatin and para-hydroxyatorvastatin in human, dog and rat plasma. J Am Soc Mass Spectrom1999;10:55-66.
- Yadav SS, Mhaske DV, Kakad AB, Patil BD, Kadam SS, DhaneshwarSR. Simple and sensitive HPTLC method for determination ofcontent uniformity of atorvastatin calcium tablet. Indian J Pharm Sci2005;67:182-8.
- British Pharmacopoeia Vol. 1. London: The Stationery officePublications; 2007. p. 132-4.
- Avadhanulu AB, Srinivas JS, Anjaneyulu A. RP-HPLC estimation ofamlodipine besylate in drug and pharmaceutical formulations. IndianDrugs 1996;33:36-8.
- Klinkenberg R, Streel B, Ceccato A. Development and validation ofa liquid chromatographic method for the determination of amlodipineresidues on manufacturing equipment surfaces. J Pharm Biomed Anal2003;32:345-52.
- Tatar S, Atmaca S. Determination of amlodipine in human plasma byhigh-performance liquid chromatography with fluorescence detection. JChromatogr B Biomed SciAppl 2001;758:305-10.
- Josefsson M, Norlander B. Coupled-column chromatography on aChiral-AGP phase for determination of amlodipine enantiomers inhuman plasma: An HPLC assay with electrochemical detection. J PharmBiomed Anal 1996;15:267-77.
- Josefsson M, Zackrisson AL, Norlander B. Sensitive high-performanceliquid chromatographic analysis of amlodipine in human plasmawith amperometric detection and a single-step solid-phase samplepreparation. J Chromatogr B Biomed Appl 1995;672:310-3.
- Khan MR, Jain D. Simultaneous spectrophotometric determinationof atorvastatin and amlodipine besylate in tablet. Indian J Pharm Sci2006;68:546-8.
- Sahu R, Patel VB. Simultaneous spectrophotometric determination ofamlodipine besylate and atorvastatin calcium in binary mixture. IndianJ Pharm Sci 2007;69:110-1.
- Mishra P, Gupta A, Shah K. Simultaneous spectrophotometricestimation of atorvastatin calcium and amlodipine besylate from tablets.Indian J Pharm Sci 2007;69:831-3.
- Chaudhri BG, Patel NM, Shah PB. Simultaneous estimation ofatorvastatin calcium and amlodipine besylate by HPTLC. Indian Drugs2006;43:649-55.
- Rajeswari KR, Sankar GG, Rao AL, Sheshagirirao JV. RP-HPLCmethod for simultaneous determination of atorvastatin calcium andamlodipine in tablet. Indian J Pharm Sci 2006;68:275-7.
- Shah DA, Bhatt KK, Shankar MB, Mehta RS, Gandhi TR, BaldaniaSL. RP-HPLC determination of atorvastatin calcium and amlodipinebesylate combination in tablets. Indian J Pharm Sci 2006;68:796-9.
- Chaudhri BG, Patel NM, Shah PB. Stability indicating RP-HPLCmethod for simultaneous determination of atorvastatin and amlodipinefrom their combination drug products.Chem Pharm Bull 2007;55:241-6.
- Sivakumar T, Manavalan R, Muralidharan C, Valiappan K. Animproved HPLC method with the aid of a chemometric protocol:Simultaneous analysis of amlodipine and atorvastatin in pharmaceutical formulations. J Sep Sci 2007;30:3143-53.


