- *Corresponding Author:
- Wanhui Lin
Departments of Neurology and Geriatrics, Fujian Key Laboratory of Molecular Neurology, Fujian Medical University Union Hospital, Fuzhou, Fujian 350001, China
E-mail: wanhuilin@fjmu.edu.cn
| Date of Received | 25 December 2022 |
| Date of Revision | 15 July 2023 |
| Date of Acceptance | 22 December 2023 |
| Indian J Pharm Sci 2023;85(6):1847-1860 |
This is an open access article distributed under the terms of the Creative Commons Attribution-NonCommercial-ShareAlike 3.0 License, which allows others to remix, tweak, and build upon the work non-commercially, as long as the author is credited and the new creations are licensed under the identical terms
Abstract
5-hydroxy tryptamine 6, a serotonin receptor has been documented to be involved in epilepsy and is exclusively expressed in central nervous system (eg. cerebral cortex, hippocampus, striatum and olfactory tubercle) that mediate cognition. This study attempted to investigate whether 5-hydroxy tryptamine receptor 6 is involved in cognitive impairment of chronic epileptic rats in vivo magnetic resonance imaging study employing a high field (7T) magnet with T2-weighted imaging sequence and magnetic resonance spectroscopy. Rats were divided into control (n=8) and epileptic group (n=37). Status epilepticus was induced by intraperitoneal injection of lithium chloride-pilocarpine. Spontaneous recurrent seizures rats were divided into dimethyl sulfoxide (SE), SB-271046 (SE+SB), WAY-181187 (SE+WAY) group. Spatial learning and memory were evaluated by Morris-water maze test. Hippocampal volumetric analysis was based on T2-weighted coronal images manually calculated regions of interest. Dentate gyrus data were measured to evaluate metabolite ratios to total creatinine by single voxel point resolved spectroscopy-magnetic resonance spectroscopy. After 4 w of SE, spontaneous recurrent seizures were observed and rats showed poor performance in Morris-Maze. SB-271046 intervention attenuated stages and frequency of spontaneous recurrent seizures and improved performance of Morris-Maze. Lac/total creatine(R) and excitatory neurotransmitters (glutamate, combined resonance of glutamate and glutamine, glutamine, taurine) increased significantly in SE group compared to control group. Volumetric analysis showed hippocampal volume decreased significantly and lateral ventricles became larger in SE group. In SE+SB group, score of N-acetyl aspartate/total creatine+choline(R), volume of hippocampus increased significantly, gap between left and right side of N-acetyl aspartate/total creatine+choline, Lac/total creatine(R) glutamate/total creatine(R), combined resonance of glutamate and glutamine/total creatine(R), glutamine/total creatine(R), taurine/total creatine(R) decreased significantly compared to SE group. N-acetyl aspartate/total creatine+choline(R) was positively correlated with time-spent in target quadrant and N-acetyl aspartate/total creatine(L-R) was negatively correlated with time-spent in target quadrant and total swimming distance. In conclusion, lateralization of metabolic injury and over-expression of 5-hydroxy tryptamine receptor 6 are characteristics of pilocarpine-induced chronic epilepsy. SB-271046 can attenuate spontaneous recurrent seizures and improve spatial learning and memory by improving hippocampal metabolic injury.
Keywords
5-hydroxy tryptamine receptor 6, epilepsy, cognition, magnetic resonance spectroscopy, metabolic injury
Recently, growing attention has been turned to the cognitive deficits co-occurring with epileptic onset[1-3], which can be caused by hippocampal sclerosis, including neuron loss and glial proliferation, and involves the imbalance between the Excitatory Amino Acids (EAA), such as Glutamate (Glu), and Inhibitory Amino Acids (IAA), such as Gamma-Aminobutyric Acid (GABA)[4]. Studies of animal models have documented that both upregulated EAA and downregulated IAA may result in seizures. In the normal brain, extracellular Glu is maintained at a low level via the Glu-Glutamine (Gln) cycle. Once taken up by astrocytes, Glu is rapidly converted to Gln via Gln Synthetase (GS). In turn, Gln is in taken by neurons and converted to Glu by Phosphate Activated Glutaminase (PAG). On the other hand, Glu is converted into GABA via Glutamic Acid Decarboxylase (GAD). Therefore, this Glu-Gln cycle is crucial for maintaining the balance between EAA and IAA in the brain.
5-Hydroxy Tryptamine Receptor 6 (5-HTR6), a serotonin receptor has been documented to be involved in epilepsy[5-9]. It is exclusively expressed in the central nervous system (eg. cerebral cortex, hippocampus, striatum and olfactory tubercle) that mediate cognition in which its expression predominates in glutamatergic and GABAergic neurons and subsets of GABAergic interneurons[10]. Its ligands have been reported to modulate the balance between neuronal excitation (Glu) and inhibition (GABA), which may have widespread implications for neurotransmission and neuronal activity[10,11]. Other animal experiments also suggest that selective 5-HTR6 antagonists (i.e. SB- 399885, SB-271046, SB-258510 and Ro-258510) can improve the threshold of seizures[12-14]. Of them, 5-HTR6 antagonist SB-271046 has been demonstrated to attenuate pilocarpine-induced chronic epilepsy (spontaneous recurrent seizures, SRSs)[15].
According to the available literature, 5-HTR6 and its ligands are involved in dementias including AD[16]. 5-HTR6 can produce a bidirectional influence on memory or amnesia. The selective manipulation of 5-HTR6 can improve or impair memory, depending on the memory stages and sub-areas of the cerebrum[17]. For example, the activation of 5-HTR6 can modulate cyclic Adenosine 3’,5’-Monophosphate (cAMP) production, improve memory formation, and facilitate short-term memory and long-term memory in passive avoidance tasks, while 5-HTR6 agonist WAY-466 can impair social recognition memory[16]. In dementias-related diseases such as Alzheimer’s disease and schizophrenia, studies have found that 5-HTR6 expression is down-regulated in the prefrontal cortex and hippocampus while upregulated in the striatum, and that its antagonists can improve dementias induced cognitive dysfunction[16]. In our previous study, 5-HTR6 is over-expressed in a pilocarpine- induced chronic epileptic model, which is easily susceptible to cognitive impairment[15]. However, it remains to be unveiled whether 5-HTR6 is involved in the cognitive impairment in chronic epilepsy.
Although existent studies have revealed that 5-HTR6 and its ligands affect cognition by modulating the release of Glu/GABA/serotonin/ ache[10,16], this insight is gained through the invasion of microdialytic needles, which may pose potential health risks and has limited clinical application. Thanks to the development of imaging technology, new imaging equipment including 7T proton Magnetic Resonance Spectroscopy (1H-MRS) can provide a non-invasive and sensitive approach to examine the metabolic changes in the brain in vivo. This approach can reveal the energy turnover and viability of neurons and glia through the spectrum analysis of the metabolites[18]. For example, N-Acetyl Aspartate (NAA) has been closely associated with neuronal mitochondrial function, whereas Glu is the dominant excitatory neurotransmitter and mediates the generation of ATP within the neuronal-glial metabolic cycle[17], lactic acid (Lac)/total Creatine (tCre) indicates glycolytic energy production, increased inositol (Ins/tCre), (Gln/tCre), Glx (Glu and Gln mix)/ tCre are linked with astrocytic activation, NAA/ tCre+Choline (Cho) is considered to be a marker of hippocampal sclerosis[19,20]. Still, it is of great interest to investigate how 5-HTR6 may modulate metabolic parameters used in MRS detection.
Therefore, the current study investigated the role of 5-HTR6 in cognitive impairment of chronic epileptic rats by 7T proton magnetic resonance spectroscopy and analyzed the correlation between spatial memory and MRS parameters. We used HE and FJC staining to reveal the hippocampal sclerosis and detected the expression of 5-HTR6 in different cerebral areas by Western blot. We found that 5-HTR6 was over-expressed in the prefrontal cortex and the hippocampus and that its antagonist SB-271046 improved the epilepsy- related cognitive impairment by attenuating the metabolic injury and the neuronal loss. These findings provide a new insight into the role of 5-HTR6 in chronic epilepsy, which may serve as a promising target in the treatment of cognitive impairment accompanying epilepsy.
Materials and Methods
Pilocarpine-induced chronic epilepsy:
Forty-five male adult Sprague-Dawley rats (weighted 200-250 g, aged 10-13 w old) were obtained from Shrek Company (Shanghai, China) and housed in a room with a humidity of 50 %±5 % at 22-26° on a dark/light cycle of 12 h. All animals were allowed free access to food and water. Eight rats were assigned to the control group and the rest to the Status Epilepticus (SE) group (n=37). The latter received an intraperitoneal injection of lithium chloride (127 mg/kg, i.p.) (Sigma, USA) 16-18 h prior to and of atropine administration (1 mg/kg i.p.) (Sigma, USA) 30 min before the pilocarpine administration (30 mg/kg, i.p.) (Sigma, USA). The control group was treated with saline. The activity of induced seizures was evaluated according to the Racine’s score[21] and the following procedure was performed according to the attachment. The SE model was considered successful if stage-IV or stage-V seizures were observed in rats for more than one hour and diazepam (5 mg/kg; i.p.) was used to terminate SE. These SE rats were used for the subsequent experiments. The behavior of rats was constantly video-monitored for 15 h per day over a period of eight weeks. Spontaneous Recurrent Seizures (SRSs) were evaluated based on their corresponding frequency (per w) and severity stage over the chronic epilepsy period.
This study has been approved by Ethical Committee of Fujian Medical University Union Hospital, Fuzhou, China. All procedures or protocols were conducted as described by NIH guide for Care and Use of Laboratory Animals.
Drug intervention:
After the successful induction of SRSs, the SE rats were further divided into three sub-groups, respectively receiving a daily intervention of 10 % Dimethyl Sulfoxide (DMSO) (Sigma, USA) (the SE group), 1 mg/kg 5-HTR6 antagonist SB- 271046 (Tocris, USA) (the SE+SB group), and 1 mg/kg 5-HTR6 agonist WAY-181187 (Tocris, USA) (the SE+WAY group). All the substances were dissolved in DMSO and all interventions were maintained for 14 d.
Morris water maze tests:
2 w after the intervention (8 w after SE modeling), Morris water maze tests were performed to evaluate the spatial learning and memory of the rats in a circular water maze (120 cm in diameter and 50 cm in height). A hidden platform (9 cm in diameter) was located 0.5 cm below the surface of the water and obscured from visual detection by placing floating plastic particles on the water surface. The temperature of the water was 25.0°±0.5°. During the experiment, the rats started from a random location in the maze and were allowed to swim freely until they located the hidden platform. The entire experiment lasted for 7 d. For the first 5 d, the rats were left in the maze to locate the platform for a maximum duration of 60 s. This learning session was repeated 5 times each day with an interval of 1 h between the sessions. On the final day, the platform was removed, and the swimming paths of the rats were recorded over a period of 2 min to analyze the crossings over the original location of the removed platform, the total swimming distance, the total time spent in the target quadrant, and the time spent in the quadrant opposite to the target quadrant.
Magnetic resonance:
T2-weighted TurboRARE (rapid acquisition with relaxation enhancement multiple spin echo) images and MRS data were collected through a 7T small animal Magnetic Resonance Imaging (MRI) scanner (70/20USR Biospec) (Bruker Biospin GMbls, Germany) according to the procedure[22]. Prior to MRI scanning, the rats were initially anaesthetized with 3.0 % isoflurane in an oxygen and air mixture (1:4). During the MRI scanning, the animals were placed prone in a MR-compatible stereotactic holder with the head clinched, the teeth hooked by a tooth bar and a nose cone placed near the nose to sustain the anesthesia. The core body temperature was maintained at approximately 37° using a heating cradle and respiration was monitored. Imaging was performed on a 7T small animal MRI scanner (70/20USR Biospec) (Bruker Biospin GMbls, Germany). The body coil and surface coil were used as the exciting coil and receiving coil. After initial three-direction localizer acquisitions, T2-weighted TurboRARE (rapid acquisition with relaxation enhancement multiple spin echo) images were obtained for optimal hippocampal slice positioning with the following parameters; repetition time(TR)= 4200 ms, echo time(TE)=35 ms, number of averages=2; field of view (FOV)=40×40 mm, slices=30, slice thickness=1.0 mm and matrix=256×256. Then, we selected the hippocampal area, DG as the Region of Interest (ROI) for 1H-MRS measurement, which was set as 2×2×3 mm3. After the selection of ROI, the water suppression pulse was adjusted for Chemical-Shift-water Suppression (CHESS) prior to the Point-Resolved Spectroscopy (PRESS) acquisition. MRS data were collected with TR=2500 ms, TE=16 ms and scan duration=10 min 40 s. The spectral data were processed using the software package TOPSPIN (v3.1, Bruker Biospin, Germany). The areas under the peak for various metabomm3lites, including NAA, Ins, Asp, Taurine (Tau), GABA, Cho, Glu, tCre and Lac, were calculated automatically using a Quantum Estimation (QUEST) method with a subtraction approach for background modeling, using tCre as the criterion.
The originally acquired T2-weighted coronal images (30 sections/rat) were transferred to a computer where volumetric analysis was performed using image J software. This program allows the user to manually outline ROIs and afterwards calculate the volumes of a specific ROI[23]. From rostral to caudal, a total of 7 sections were included in calculation. The dorsal hippocampus starts approximately from -2.12 mm to -3.8 from bregma and the ventral hippocampal from -4.5 mm to -6.8 mm from bregma.
Fluoro-jade C staining:
After the MRS performance, half of the brains from each group were formalin-fixed and parrffin- embedded and cut at a thickness of 4-5 μm. Prior to staining, sections were air-dried for at least 30 min. Slices were first immersed in a basic alcohol solution consisting of 1 % sodium hydroxide in 80 % ethanol for 5 min. They were then rinsed in 70 % ethanol for 2 min, in distilled water for 2 min, and then incubated in 0.06 % potassium permanganate solution for 15 min. After the incubation, the slices were transferred for 10 min to a 0.0001 % solution of Fluoro-Jade C (Sigma, USA) dissolved in 0.1 % acetic acid vehicle. The working dilution was obtained by first making a 0.01 % stock solution of the dye in distilled water and then adding 1 ml of the stock solution to 99 ml of 0.1 % acetic acid vehicle and used within 2 h after preparation. The slices were then rinsed through three changes of distilled water for 1 min per change and excess water was drained onto a paper towel. Afterwards, the slices were air dried on a slice warmer at 60° for at least 5 min or over-night and then cleared in xylene for at least 1 min and cover-slipped with DPX (Sigma, USA).
Western blotting:
The other half of the brains from each group were subject to western blot analysis. Briefly, once deep anesthesia was achieved by using 10 % chloral- hydrate (300 mg/kg, i.p.), rats were transcardially perfused with 200 ml 0.01 M Phosphate-Buffered Saline (PBS). Hippocampal tissues were separated and stored in a -80° refrigerator for subsequent experiments. Proteins extracted from hippocampal tissues were separated by using Sodium Dodecyl Sulfate Polyacrylamide Gel Electrophoresis (SDS-PAGE) and transferred onto nitrocellulose membranes. The membranes were then blocked with 5 % skim milk at room temperature for 2 h and subsequently incubated with primary antibodies; anti-5-HTR6 antibody (ab103016, 1:1000; Abcam, USA) and anti-GAPDH antibody (1:1500, Beijing Emarbio Science and Technology, China). After the incubation, the membranes were washed with Tris Buffered Saline Tween (TBST) and were further incubated with peroxidase-conjugated secondary antibody (anti-Rabbit, HRP, donkey). Specific bands were detected using an Electro-Chemi- Luminescence (ECL) system and the intensity of signals was analyzed with the Image J software.
Statistical methods:
All statistical analyses were performed with SPSS 20.0 software (Illinois, USA). Data were presented as mean±standard deviation or median (range) calculated from at least three experiments. The number of animals used for behavioral analysis was 8, 6, 7, 7, respectively for the Control, SE, SE+SB, and SE+WAY groups; that used for MRS and WB analysis was 3 each for the Control, SE, SE+SB, and SE+WAY groups. The two-tailed student’s t-test or one-way Analysis of Variance (ANOVA) was used for inter-group comparisons. Alternatively, the non-parametric rank tests were conducted to identify differences in FJC scores among various intervention groups. Chi-square test was adopted to analyze categorical data. After the hypothesis testing, the Fisher’s partial Least Squares Difference (LSD) test was performed for multiple comparisons in case of homogeneous variance and the Kruskal-Wallis H (K) method was used in case of heterogeneous variance. Pearson analysis was employed to examine the correlation between spatial memory and MRS parameters. A p value<0.05 was considered as significant for all statistical tests.
Results and Discussion
Status epilepsy was successfully induced in 34 rats in the SE group 10-30 min after the pilocarpine injection. About 7-28 d after the SE induction, SRSs were observed and 24 out of the 34 rats survived. They were equally assigned to the SE, SE+SB, and SE+WAY group. After the MRS, 8 rats survived in the control group. 6 in the SE group, 7 in both the SE+SB and SE+WAY group. No significant difference in survival rate was found between the SE groups after the SB-271046 or WAY181187 intervention (Table 1). The SB-271046 intervention markedly decreased the stages of SRSs in the SE+SB group when compared with those of the SE group, while no significant difference was observed between the SE+WAY and SE group (Table 1). These results suggest that SB-271046 can reduce the attack frequency of and ameliorate the gravity of SRSs.
| Group | Pre-SE | SE | SE-4w | SE-8w |
|---|---|---|---|---|
| Con | 8 | 8 | 8 | 8 |
| SE | 37 | 34 (success rate 91.89 %) | 8 | 6 (survival rate 75 %) |
| SE+SB | 8 | 7 (survival rate 87.5 % | ||
| SE+WAY | 8 | 7 (survival rate 87.5 %) |
Table 1: Comparison of Success and Survival Rates After Pilocarpine-Induced SE
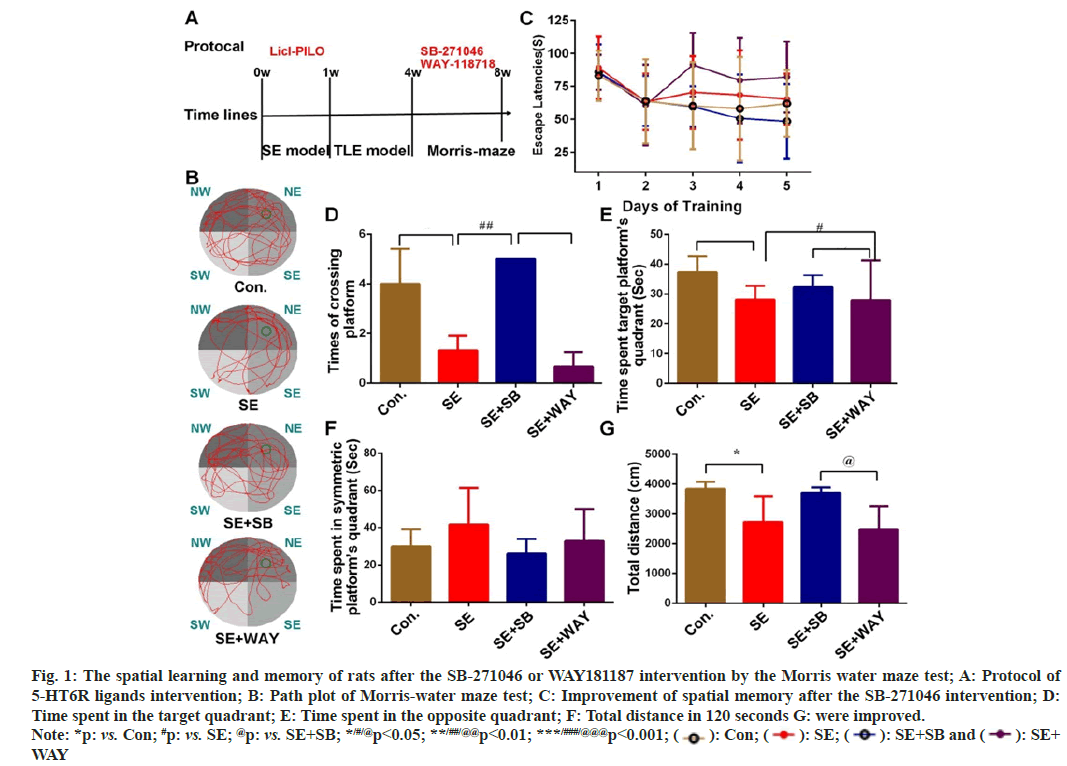
4 w after the successful SE induction, rats were treated with SB-271046 or WAY118718 for 2 weeks (fig. 1A). Then their spatial learning and memory were evaluated by Morris water maze test (fig. 1B). The test protocol (fig. 1A) and representative image of the swimming paths (fig. 1B) of each group were respectively presented.
As shown in fig. 1C, the escape latencies from Day 1 to Day 5 were different among the four groups (repeated measured ANOVA, F=2.913, p=0.047). Except for that of the SE+WAY group, the latency in the Control, SE, SE+SB group was greatly decreased with the progress of training, reaching a nadir at Day 4 (respectively, *p=0.025, *p=0.012, **p=0.002 as compared with Day 1). Although repeated measured ANOVA reported no significant difference at the same point of training among the four groups (F=2.375, p=0.102), one-way ANOVA indicated that the escape latency was different among the four groups at Day 5 (F=7.6080, p=0.002): compared with the Control group, the latency of the SE group prolonged without significance (p=0.059); compared with the SE group, the latency was significantly shortened in the SE+SB group (p=0.023), but not significantly changed in the SE+WAY group. These findings indicate that SB- 271046 can improve the short-term memory of the chronic epileptic rats.
At Day 7, the four groups showed marked differences in platform crossings (fig. 1D), time spent in the target quadrant (fig. 1E), and total distance (fig. 1G) (F12=16.510, **p=0.004; F12=6.893, **p=0.01; and F12=4.692, *p=0.031, respectively). However, the four groups demonstrated no obvious differences in time spent in symmetric platform's quadrant (fig. 1F) Compared with the control group, the SE rats displayed fewer platform crossings (fig. 1D), less time in the target quadrant (fig. 1E) and shorter swimming distance (fig. 1G) (p=0.001, 0.01 and 0.01 respectively); compared with the SE group, after the SB intervention. The rats in the SE+SB group reported more platform crossings (fig. 1D) (p=0.001), more time spent in the target quadrant (fig. 1E) and longer distance (fig. 1G), though with no significance, compared with the SE group. After the WAY intervention, the SE+WAY group reported fewer platform crossings (fig. 1D), without a statistical significance though, shorter time in the target quadrant (fig. 1E) (p<0.05), compared with the SE+SB group. The SE+WAY group showed fewer platform crossings (fig. 1D) (p=0.000), less time spent in the target quadrant (fig. 1E) (p=0.01), and shorter total distance (fig. 1G) (p=0.028). The data suggest that the spatial exploration ability of the chronic epileptic is greatly impaired and can be improved by SB-271046 and aggravated by WAY181187.
Fig. 1: The spatial learning and memory of rats after the SB-271046 or WAY181187 intervention by the Morris water maze test; A: Protocol of
5-HT6R ligands intervention; B: Path plot of Morris-water maze test; C: Improvement of spatial memory after the SB-271046 intervention; D:
Time spent in the target quadrant; E: Time spent in the opposite quadrant; F: Total distance in 120 seconds G: were improved.
Note: *p: vs. Con; #p: vs. SE; @p: vs. SE+SB; */#/@p<0.05; **/##/@@p<0.01; ***/###/@@@p<0.001;  : Con;
  : SE;
: SE;  : SE+SB and
  : SE+
WAY
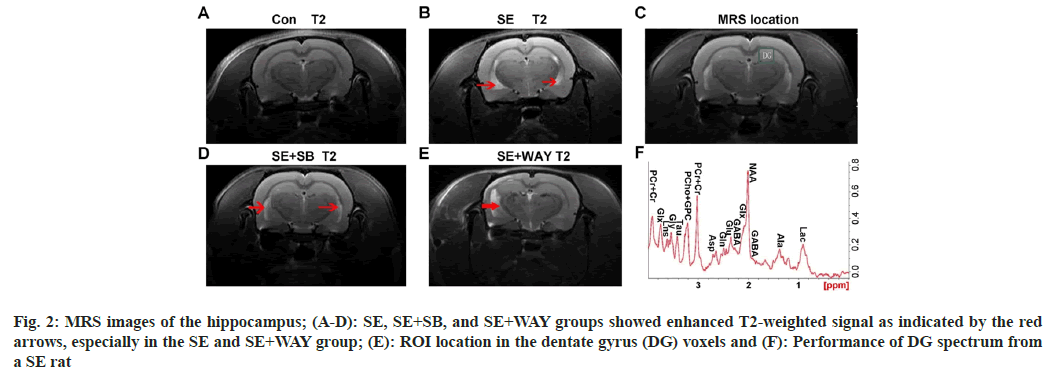
From the MRS images, T2-weighted signal was enhanced in the SE+SB, SE, and SE+WAY groups, especially in the latter two groups, as indicated by the arrows, while no enhanced signal was observed in the control group, as shown in fig.2A-fig. 2D. The positions of the Dentate Gyrus (DG) voxels indicated the region of interest and the performance of DG spectrum from a SE rat showed the changes of metabolites, as shown in fig. 2E and fig. 2F. The images indicate that after the SE modeling, obvious impairment can be observed in the hippocampus.
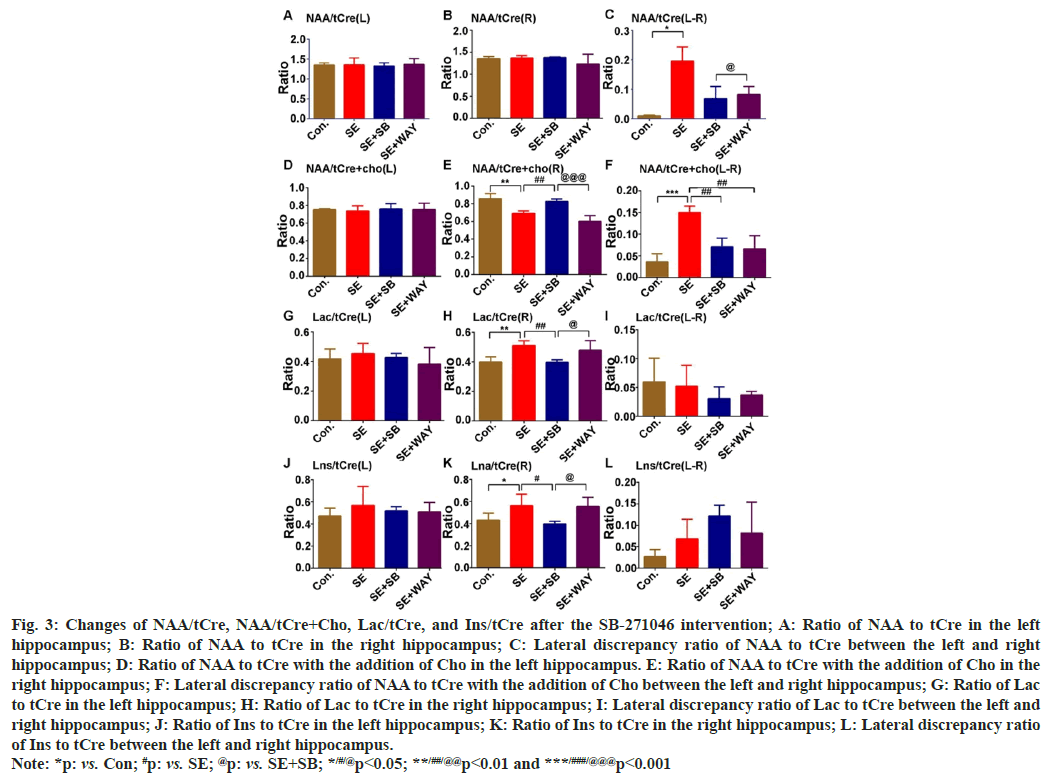
Across the four groups, no significant change of NAA/tCre was found in both the left hippocampus (NAAtCre(L)) (fig. 3A) and right hippocampus (NAAtCre(R)) (fig. 3B). However, a lateral discrepancy of NAA/tCre between the left hippocampus and right hippocampus (NAAt/ Cre(L-R)) was found (fig. 3C) (one-way ANOVA- test: F=4.598, p=0.032). The lateral discrepancy of NAA/tCre increased significantly in the SE group when compared with the control group (LSD- test: *p=0.014) and decreased in the SE+SB or SE+WAY group when compared with the SE group, though without significance (fig. 3A-fig. 3C). On the other hand, there were no significant changes for NAA/tCre+Cho in the left hippocampus (NAA/ tCre+Cho(L)) among all four groups (fig. 3D). However, the changes of NAA/tCre+Cho in the right hippocampus (NAA/tCre+Cho(R)) were markedly different across the four groups (fig. 3E) (one-way ANOVA-test: F=18.917, p=0.000). NAA/tCre+Cho significantly increased in the SE group when compared with the Control group (LSD-test, **p=0.002) and in the SE+SB group when compared with the SE group (##p=0.008), though without significance after the WAY181187 intervention (fig. 3E). Similarly, the lateral discrepancy of NAA/tCre+Cho between the left hippocampus (NAA/tCre+Cho(L)) and right hippocampus (NAA/tCre+Cho(R)) was significant among the four groups (fig. 3F) (one-way ANOVA- test: F=16.834, p=0.000). It markedly increased in the SE group when compared with the Control group (LSD-test: ***p=0.000) but noticeably decreased in SE+SB and SE+WAY group when compared with the SE group (fig. 3F) (##p=0.01 for both). There were no obvious differences for Lac/tCre in the left hippocampus (Lac/tCre(L)) among for groups (fig. 3G). Likewise, Lac/tCre in the right hippocampus (Lac/tCre(R)) noticeably increased when the SE group was compared with the Control (LSD-test: **p=0.005), but markedly decreased after the SB intervention when the SE+SB group was compared with the SE group (fig. 3H) (##p=0.007). However, no discrepancy of Lac/tCre between left hippocampus and right hippocampus (Lac/tCre(L-R)) was discovered (fig. 3I). Moreover, there were no marked differences for the Lns/tCre in the left hippocampus (Lns/tCre(L)) among for groups (fig. 3J). Lns in the right hippocampus (Lns/tCre(R)), representing glial activation and osmosis, was significantly different among the four groups (fig. 3K) (one-way ANOVA- test: F12=4.310, p=0.038). It greatly increased in the SE group when compared with the Control group (LSD-test: *p=0.41), but significantly declined in the SE+SB group when compared with the SE group (#p=0.02). However, no discrepancy of Lns/tCre between left hippocampus and right hippocampus (Lns/tCre(L-R)) was discovered (fig. 3L). Altogether, the ratio changes suggest that neuron loss, glial activation and lactose accumulation are present during the chronic epilepsy, especially in the right hippocampus, which can be greatly attenuated by the SB-271046 intervention.
Fig. 3: Changes of NAA/tCre, NAA/tCre+Cho, Lac/tCre, and Ins/tCre after the SB-271046 intervention; A: Ratio of NAA to tCre in the left
hippocampus; B: Ratio of NAA to tCre in the right hippocampus; C: Lateral discrepancy ratio of NAA to tCre between the left and right
hippocampus; D: Ratio of NAA to tCre with the addition of Cho in the left hippocampus. E: Ratio of NAA to tCre with the addition of Cho in the
right hippocampus; F: Lateral discrepancy ratio of NAA to tCre with the addition of Cho between the left and right hippocampus; G: Ratio of Lac
to tCre in the left hippocampus; H: Ratio of Lac to tCre in the right hippocampus; I: Lateral discrepancy ratio of Lac to tCre between the left and
right hippocampus; J: Ratio of Ins to tCre in the left hippocampus; K: Ratio of Ins to tCre in the right hippocampus; L: Lateral discrepancy ratio
of Ins to tCre between the left and right hippocampus.
Note: *p: vs. Con; #p: vs. SE; @p: vs. SE+SB; */#/@p<0.05; **/##/@@p<0.01 and ***/###/@@@p<0.001
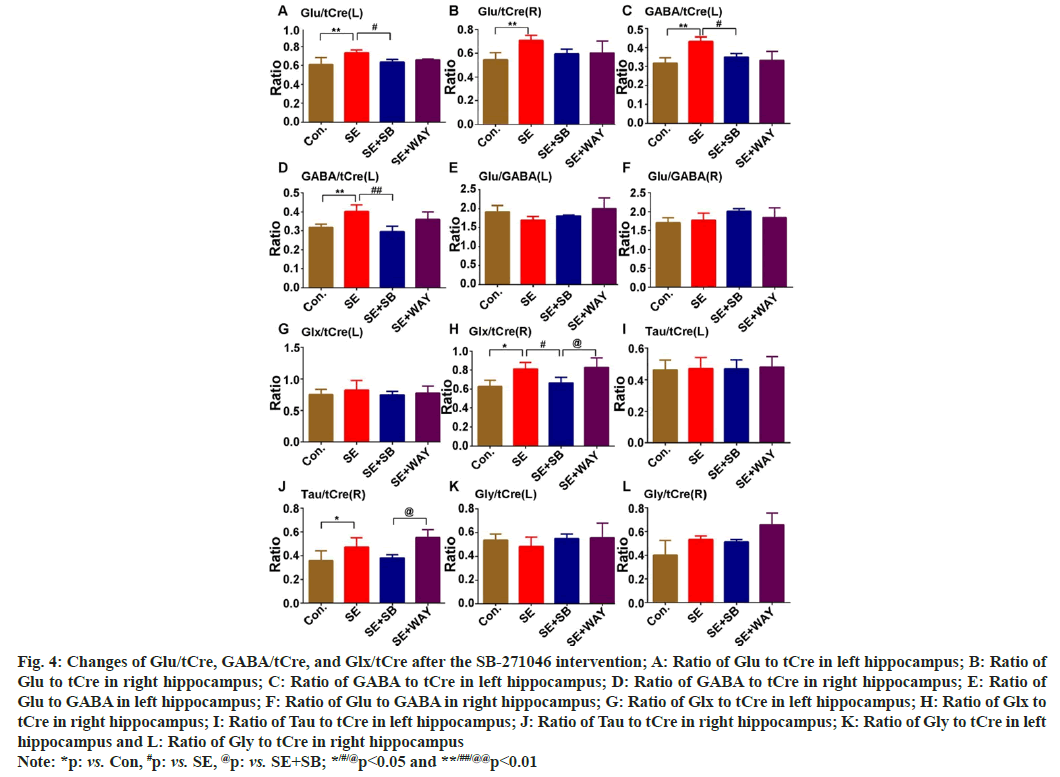
The Glu-Gln cycle maintains the balance between EAA and IAA in the brain. In this research, Glu, Gln, GABA, Glx, Tau, Gly in the DG region were detected via 7T MRS. Glu/tCre of the left epileptic hippocampus (Glu/tCre(L)) (fig. 4A) and right epileptic hippocampus (Glu/tCre(R)) (fig. 4B) greatly increased when the SE group was compared with the Control (LSD-test: **p=0.007, **p=0.008, respectively). After the SB-271046 intervention, it decreased in both hippocampi, significantly in the left hippocampus (fig. 4A and fig. 4B) (#p<0.05) when the SE+SB group was compared with the SE group. Similarly, GABA/tCre of the left epileptic hippocampus (GABA/tCre(L)) (fig. 4C) and right epileptic hippocampus (GABA/tCre(R)) (fig. 4D) also greatly increased when the SE group was compared with the Control (**p=0.001 and **p<0.01, respectively). After the SB-271046 intervention, it decreased in both the left and right hippocampus when the SE+SB group was compared with the SE group (fig. 4C and fig. 4D) (#p=0.03 and ##p<0.01, respectively). However, no significant changes in the ratio of Glu to GABA were observed in both the left hippocampus (Glu/GABA(L)) (fig. 4E) and right hippocampus (Glu/GABA(R)) (fig. 4F) across the four groups. Glx (a mixture of Glu and Gln)/tCre not in the left hippocampus (Glx/tCre(L)) (fig. 4G), but in the right hippocampus (Glx/tCre(R)) (fig. 4H), was significantly different among the four groups (one- way ANOVA-test: F=6.165, p=0.015). It markedly increased in the SE group when compared with the Control (fig. 4G and fig. 4H) (LSD-test, **p=0.01), but noticeably decreased when the SE+SB group was compared with the SE group (fig. 4G and fig. 4H) (#p=0.040). Similarly, Tau/tCre, not in the left hippocampus (Tau/tCre(L)) (fig. 4I), but in the right hippocampus (Tau/tCre(R)) (fig. 4J) was different among the four groups. It significantly increased when the SE group was compared with the control (fig. 4I and fig. 4J) (*p<0.05) and decreased without significance after the SB-271046 intervention. In addition, no significant change in Gly/tCre in both the left hippocampus (Gly/tCre(L)) (fig. 4K) and the right hippocampus (Gly/tCre(R)) (fig. 4L) was observed among the four groups. These results indicate that EAA is upregulated in the chronic epilepsy and that 5-HTR6 ligands do not affect the ratio of Glu to GABA.
Fig. 4: Changes of Glu/tCre, GABA/tCre, and Glx/tCre after the SB-271046 intervention; A: Ratio of Glu to tCre in left hippocampus; B: Ratio of Glu to tCre in right hippocampus; C: Ratio of GABA to tCre in left hippocampus; D: Ratio of GABA to tCre in right hippocampus; E: Ratio of Glu to GABA in left hippocampus; F: Ratio of Glu to GABA in right hippocampus; G: Ratio of Glx to tCre in left hippocampus; H: Ratio of Glx to tCre in right hippocampus; I: Ratio of Tau to tCre in left hippocampus; J: Ratio of Tau to tCre in right hippocampus; K: Ratio of Gly to tCre in left hippocampus and L: Ratio of Gly to tCre in right hippocampus Note: *p: vs. Con, #p: vs. SE, @p: vs. SE+SB; */#/@p<0.05 and **/##/@@p<0.01
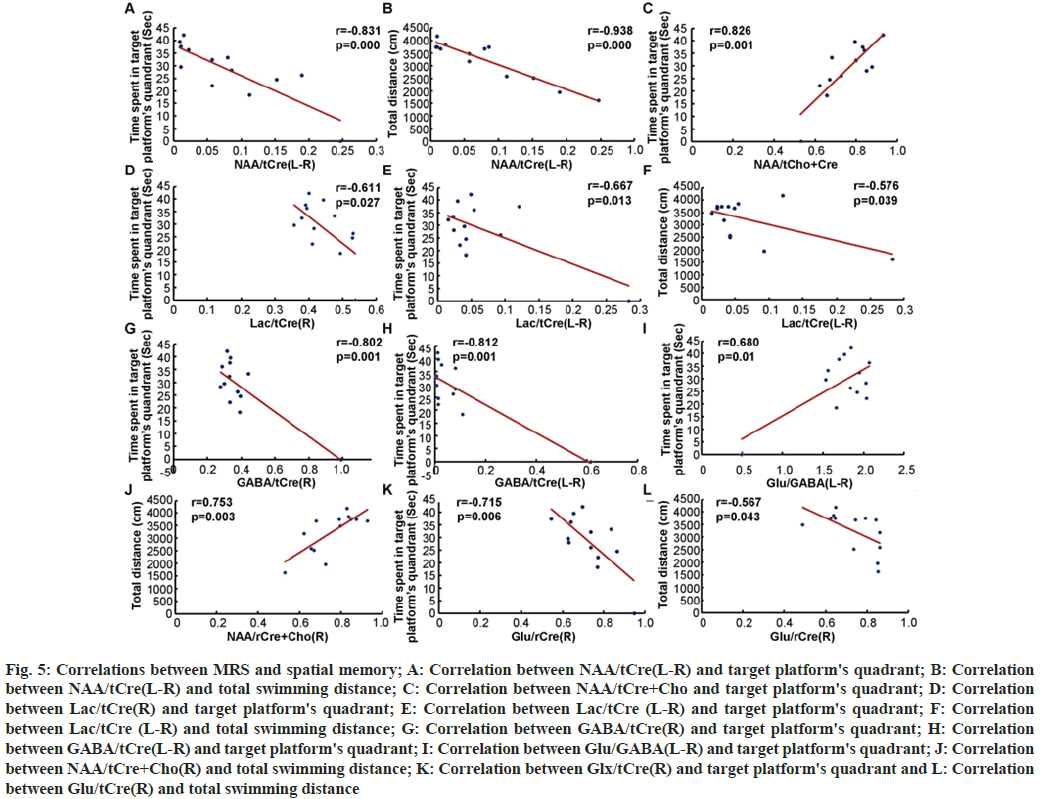
In order to investigate the correlation between MRS and spatial memory, all of the above parameters, including NAA/tCre(L-R) (fig. 5A and fig. 5B), NAA/tCre+Cho (fig. 5C), Lac/tCre(R) (fig. 5D), Lac/tCre (L-R) (fig. 5E and fig. 5F), GABA/ tCre(R) (fig. 5G), GABA/tCre(L-R) (fig. 5H), Glu/ GABA(L-R) (fig. 5I), NAA/tCre+Cho(R) (fig. 5J), Glx/tCre(R) (fig. 5K) and Glu/tCre(R) (fig. 5L) were analyzed by Pearson test. The scores of NAA/ tCre+Cho(R) (fig. 5C) and Glu/GABA(L-R) (fig. 5I) were positively correlated with the time spent in the target quadrant (r=0.826, p=0.001; r=0.680, p=0.01 respectively). The score of NAA/tCre+Cho(R) (fig. 5C) was also positively correlated with the total swimming distance (r=0.753, p=0.003). The scores of NAA/tCre(L-R) (fig. 5A), Lac/tCre(R) (fig. 5D), Lac/tCre(L-R) (fig. 5E), GABA/tCre(R) (fig. 5G), GABA/tCre(L-R) (fig. 5H), and Glx/tCre(R) (fig. 5K) were negatively correlated with the time spent in the target quadrant (r=0.831, p=0.000; r=0.611, p=0.027; r=0.667, p=0.013; r=0.802, p=0.001; r=0.812, p=0.001; r=0.715, p=0.003, respectively) and the scores of NAA/tCre(L-R) (fig. 5B), Lac/tCre(L-R) (fig. 5F), and Glu/tCre(R) (fig. 5L) were also negatively correlated with the total swimming distance (r=0.938, p=0.000; r=0.576, p=0.039; r=0.576, p=0.043, respectively). From the results, it is evident that to some extent, the ratios of NAA/ tCre and NAA/tCre+Cho can reflect the spatial exploration ability of the chronic epileptic rats.
Fig. 5: Correlations between MRS and spatial memory; A: Correlation between NAA/tCre(L-R) and target platform's quadrant; B: Correlation between NAA/tCre(L-R) and total swimming distance; C: Correlation between NAA/tCre+Cho and target platform's quadrant; D: Correlation between Lac/tCre(R) and target platform's quadrant; E: Correlation between Lac/tCre (L-R) and target platform's quadrant; F: Correlation between Lac/tCre (L-R) and total swimming distance; G: Correlation between GABA/tCre(R) and target platform's quadrant; H: Correlation between GABA/tCre(L-R) and target platform's quadrant; I: Correlation between Glu/GABA(L-R) and target platform's quadrant; J: Correlation between NAA/tCre+Cho(R) and total swimming distance; K: Correlation between Glx/tCre(R) and target platform's quadrant and L: Correlation between Glu/tCre(R) and total swimming distance
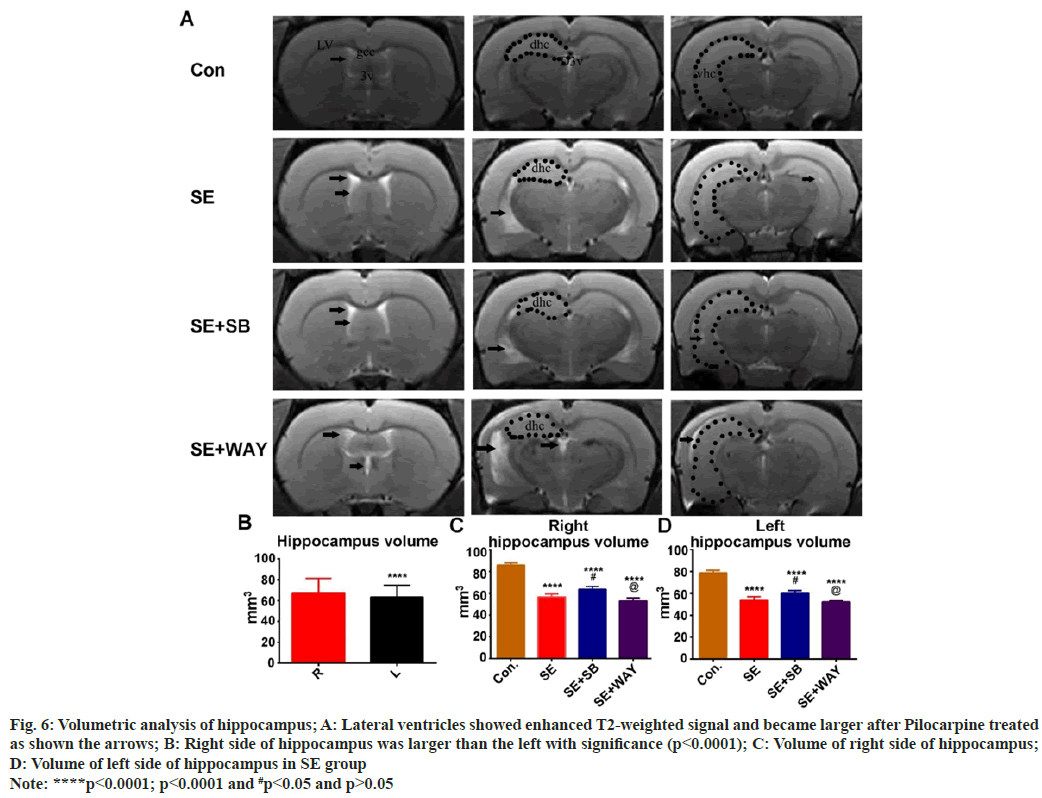
As shown in fig. 6A, the lateral ventricles after Pilocarpine treated became larger, while both the dorsal hippocampus and ventral hippocampus became smaller as shown the arrows. Interestingly, the right side of hippocampus was larger than the left with significance (fig. 6B) (p<0.0001). Furthermore, the volume of both the right side of hippocampus and left side of hippocampus (fig. 6C and fig. 6D) in SE group decreased significantly when compared with that in the control group (****p<0.0001, p<0.0001 respectively). While in the SE+SB group, it increased significantly when compared with that in the SE group and in the SE+WAY group (fig. 6C and fig. 6D) (#p<0.05), it showed reversed without significance (p>0.05).
Fig. 6: Volumetric analysis of hippocampus; A: Lateral ventricles showed enhanced T2-weighted signal and became larger after Pilocarpine treated
as shown the arrows; B: Right side of hippocampus was larger than the left with significance (p<0.0001); C: Volume of right side of hippocampus;
D: Volume of left side of hippocampus in SE group
Note: ****p<0.0001; p<0.0001 and #p<0.05 and p>0.05
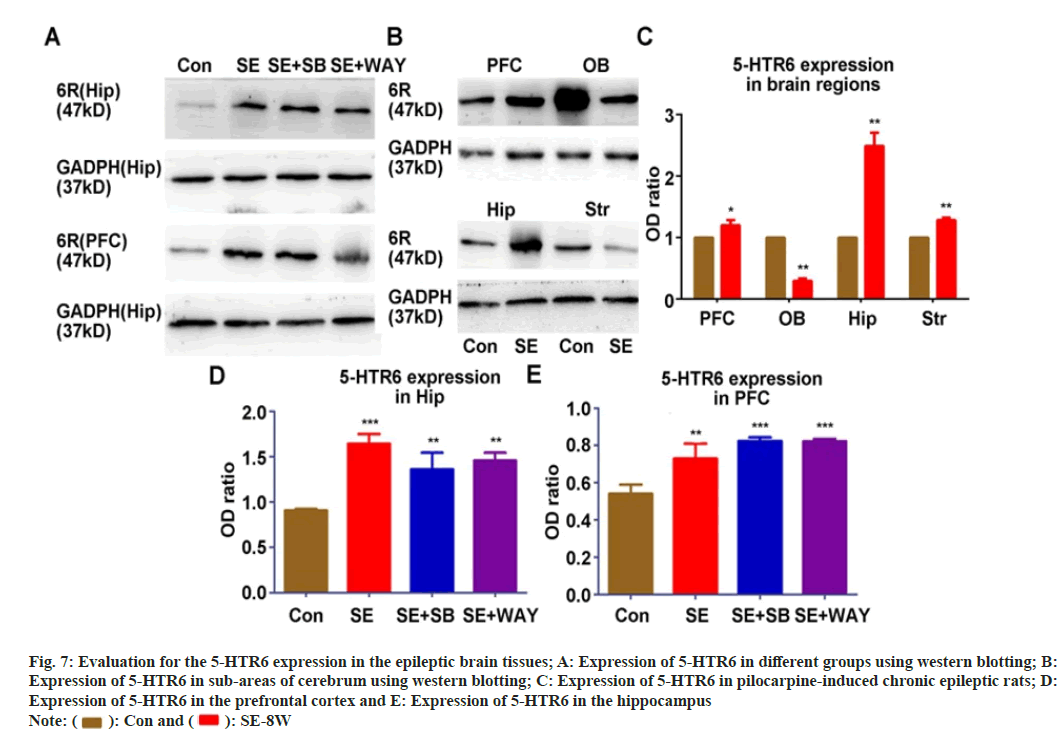
In order to investigate whether the expression of 5-HTR6 was related to the impairment of spatial memory in chronic epilepsy, we detected the expression of 5-HTR6 in Hip/PFC in different groups (fig. 7A) and in PFC/OB/Hip/Str (fig. 7B) with Western-blot assay. The expression of 5-HTR6 increased significantly in the pre-cortex, hippocampus and striatum of the SE group but decreased in the olfactory bulb when compared with that of the Control group (fig. 7C) (all p<0.05). When compared with the Control group, the protein level of 5-HTR6 in the hippocampus (fig. 7D) and Prefrontal Cortex (PFC) (fig. 7E) of the SE, SE+SB and SE+WAY groups were significantly up-regulated (all p<0.05). When compared with the SE group, the protein level of 5-HTR6 in the SE+SB and SE+WAY groups was not significantly changed after the WAY181187 intervention (fig. 7D and fig. 7E) (all p>0.05).
Fig. 7: Evaluation for the 5-HTR6 expression in the epileptic brain tissues; A: Expression of 5-HTR6 in different groups using western blotting; B:
Expression of 5-HTR6 in sub-areas of cerebrum using western blotting; C: Expression of 5-HTR6 in pilocarpine-induced chronic epileptic rats; D:
Expression of 5-HTR6 in the prefrontal cortex and E: Expression of 5-HTR6 in the hippocampus
Note:  : Con and
  : SE-8W
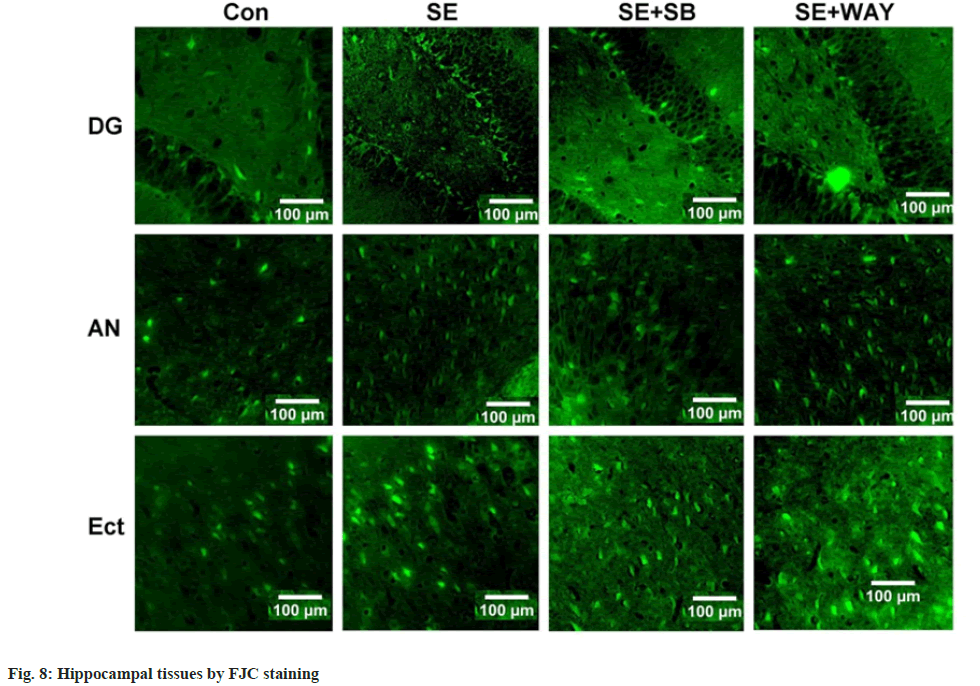
Hippocampal sections were stained by Fluoro-Jade C (a marker of degenerating neurons). As shown in fig. 8, FJC-positive neurons, which displayed a shape of triangle or spindle, were located in the DG, Amygdaloid Nucleus (AN) and Entorhinal Cortex (Ect) regions. Few FJC-positive neurons were detected in the control group. The phenomenon was more obvious in the SE group and attenuated after the SB-271046 intervention, while no significant change was observed after the WAY118718 intervention.
Our present study firstly indicated that 5-HTR6 antagonist SB-271046 can improve the spatial learning and memory of pilocarpine-induced chronic epileptic rats. Interestingly, the SE group showed significant lateralization changes in MRS parameters, such as decreased NAA/tCre and NAA/tCre+Cho, and increased Gln synthetase activation and Lac/tCre in the right hippocampus. Furthermore, the MRS parameters such as NAA/tCre and NAA/tCre+Cho were perfectly correlated with the scores of spatial memory such as time spent in the target quadrant and total swimming distance. 5-HTR6 antagonist SB- 271046 improved the MRS parameters, narrowed the lateralization, but modulated the ratio of EAA to IAA mildly. This may be due to the over-expression of 5-HTR6 in the epileptic hippocampus and the fact that SB-271046 decreases FJC positive neurons.
Chronic epilepsy, especially Temporal Lobe Epilepsy (TLE), is likely to be accompanied with cognitive impairment including deteriorated spatial learning and memory. The underlying mechanism remains understudied and effective treatments still need exploring. Recent research shows that 5-HTR6 is involved in epilepsy and that 5-HTR6 ligands have been explored as a solution to Alzheimer's disease[10,24]. Therefore, we speculated that 5-HTR6 may be involved in the memory deficit accompanying the progression of epilepsy. The present study investigated the over-expression of 5-HTR6 protein in the epileptic prefrontal-cortex and hippocampus and found that both 5-HTR6 agonist and antagonism did not significantly change the level of 5-HTR6 protein in these two cerebral areas. Of interest, we found that 5-HTR6 antagonist SB-271046 not only attenuated SRSs but also improved spatial learning and memory of the chronic epileptic rats and that 5-HTR6 agonist WAY-181187 did not significantly change SRSs but significantly aggravated spatial memory instead of spatial learning function. According to Meneses et al.[16], the selective manipulation of 5-HTR6 improves or impairs memory, varying according to memory stages and sub-areas of cerebrum. Spatial memory may rely much more on the function of the hippocampus than on that of the prefrontal cortex. From our present results, 5-HTR6 agonist WAY-181187 upregulated the level of 5-HTR6 in the hippocampus but down- regulated it in the prefrontal cortex, though without a significance, when compared with the SE group. It confirms that 5-HTR6 is involved in the spatial learning and memory impairment that accompany chronic epilepsy.
Metabolic injury, including glycolytic energy production disorder, neuronal mitochondrial injury, glial activation, is considered to be involved in the progression of epilepsy[25-27]. Using 7T proton magnetic resonance spectroscopy (1H MRS), NAA has been regarded as a marker of neuronal oxidative metabolism and attributed to mitochondrial dysfunction and/or neuron loss[4]. NAA/tCre has been shown to be reduced in the region of the seizure focus[28-30]. Similarly, NAA/tCre+Cho has been considered as a ratio of neuron loss and glia activation, and a marker of hippocampal sclerosis. Glial activation includes osmotic changes and Gln synthetase activation (Ins/tCre, Gln/tCre respectively). Beyond our expectation, the current study showed that the NAA/tCre and NAA/tCre+Cho were reduced in the DG region of the right hippocampus of the pilocarpine-induced chronic epileptic rats and that Ins/tCre and Gln/tCre were increased. This obvious lateralization was consistent with the results of MRS imaging and FJC staining. It illustrates that pilocarpine-induced chronic epilepsy is liable to hemi-hippocampal lesion. This finding needs further verification through a pathological comparison of both hippocampi and MRS analysis of different hippocampal regions such as CA1 and CA3. Furthermore, available literature documents that NAA/tCre and NAA//tCre+Cho are related to cognition in TLE patients[31,32], but the underlying mechanism remains unknown. Of note, in the current study, regardless of the hippocampi, NAA/tCre was not correlated with spatial memory while its lateral discrepancy was negatively correlated with the spatial memory, which may indicate an impaired connection between the hippocampi. NAA/tCre+Cho of the right hippocampus was significantly correlated with spatial memory, suggesting that hippocampal sclerosis may impair spatial memory. 5-HTR6 antagonism SB-271046 increased NAA/tCre+Cho, decreased Ins/tCre and Gln/tCre, and narrowed the gap between the left and right hippocampus, although 5-HTR6 agonist WAY-181187 performed inferiorly to SB-271046. Therefore, we speculate that 5-HTR6 antagonist SB-271046 can improve the spatial learning and memory of pilocarpine-induced chronic epileptic rats through attenuating neuronal mitochondrial injury, suppressing glial activation and reducing the lateral discrepancy of NAA/tCre in the hippocampus.
Furthermore, 7T MRS (1H MRS) can detect Glu metabolism. The Glx measured by MRS is a combination of Glu and Gln (Glu’s precursor), which are compartmentalized in neurons and glia, respectively. Gln is also the precursor of GABA. The exchange of these metabolites via the Glu-Gln cycle maintains the balance between EAA and IAA. Glu is believed to play an important role in the initiation and spread of seizures. In our study, interracial Glu, GABA, Glx levels in pilocarpine-induced chronic epileptic rats were higher, but no significance in Glu/GABA was observed when in comparison with the control group. In previous micro-dialysis studies, extracellular Glu levels were higher in the ipsilateral mesial TLE of epilepsy patients[33], while interracial Glu levels measured by MRS decreased in TLE[30]. These data illustrate that extracellular and intracellular Glu levels may play different roles in epileptogenesis. It is important to note that 1H MRS measures both intracellular and extracellular Glu as part of Glx. Existent research shows that 5-HTR6 ligands can modulate neurotransmitters[10], but the conclusion is paradoxical. In our study, 5-HTR6 antagonism SB-271046 significantly decreased Glu and Glx levels, while agonist WAY781187 decreased Glu, GABA and Glx, without a significance though, when in comparison with the SE group. These data suggest that Glu metabolism disorder in chronic epilepsy and 5-HTR6 ligands may modulate Glu metabolism to attenuate SRSs.
Glycolytic energy production disorder has been confirmed in epileptic animal model[34-36]. It can be measured by 7T MRS, namely Lac. Glycolytic inhibition has been shown to suppress spontaneous neuronal firing and epileptiform bursts. In our study, increased level of Lac/tCre was observed in the epileptic hippocampus, which is consistent with previous findings. 5-HTR6 antagonism SB- 271046 decreased the level of Lac/tCre. These data indicate that 5-HTR6 ligands can suppress glycolytic metabolism to some degree.
In conclusion, the metabolic injury, including glycolytic energy production disorder, neuronal mitochondrial injury, and glial activation, is obviously lateralized in pilocarpine-induced chronic epilepsy. 5-HTR6 antagonist SB-271046 can not only attenuate SRSs but also improve spatial learning and memory. 5-HTR6 agonist WAY-181187 cannot change SRSs but can significantly aggravate spatial memory. The mechanisms may involve the over- expression of 5-HTR6 in the epileptic hippocampus and modulation of metabolic injury.
Funding:
National Natural Science Foundation of China (No. 81901311), Fujian Province Natural Science Foundation Project (No.2017JO1198) and Fujian Province Gerontology Clinical Specialty Construction Project Foundation (No.2015-SLN).
Author contributions:
Mingxing Lin and Mingzhu Huang designed the study (Mingxing Lin and Mingzhu Huang contributed equally to this article and are considered co-first authors). Mingxing Lin, Mingzhu Huang, Rong Lin, Zuanfang Li analyzed the data. Mingxing Lin, Mingzhu Huang, Wanhui Lin prepared the manuscript with comments from all authors. All authors contributed to the article and approved the submitted version.
Conflict of interest:
Authors declare no competing financial or commercial interests in this manuscript.
Conflict of interests:
The authors declared no conflict of interests.
References
- Bora E, Meletti S. Social cognition in temporal lobe epilepsy: A systematic review and meta-analysis. Epilepsy Behav 2016;60:50-7.
[Crossref] [Google Scholar] [PubMed]
- Finsterer J. Valproic acid for myoclonic epilepsy in POLG1 carriers can be fatal. Folia Neuropathol 2021;59(1):17-8.
[Crossref] [Google Scholar] [PubMed]
- Hermann BP, Sager MA, Koscik RL, Young K, Nakamura K. Vascular, inflammatory, and metabolic factors associated with cognition in aging persons with chronic epilepsy. Epilepsia 2017;58(11):e152-6.
[Crossref] [Google Scholar] [PubMed]
- Bartnik-Olson BL, Ding D, Howe J, Shah A, Losey T. Glutamate metabolism in temporal lobe epilepsy as revealed by dynamic proton MRS following the infusion of [U13-C] glucose. Epilepsy Res 2017;136:46-53.
[Crossref] [Google Scholar] [PubMed]
- da Fonseca NC, Joaquim HP, Talib LL, de Vincentiis S, Gattaz WF, Valente KD. Hippocampal serotonin depletion is related to the presence of generalized tonic-clonic seizures, but not to psychiatric disorders in patients with temporal lobe epilepsy. Epilepsy Res 2015;111:18-25.
[Crossref] [Google Scholar] [PubMed]
- Gidal BE. Serotonin and epilepsy: The story continues. Epilepsy Curr 2013;13(6):289-90.
[Crossref] [Google Scholar] [PubMed]
- Lin WH, Huang HP, Lin MX, Chen SG, Lv XC, Che CH, et al. Seizure-induced 5-HT release and chronic impairment of serotonergic function in rats. Neurosci Lett 2013;534:1-6.
[Crossref] [Google Scholar] [PubMed]
- Maia GH, Brazete CS, Soares JI, Luz LL, Lukoyanov NV. Serotonin depletion increases seizure susceptibility and worsens neuropathological outcomes in kainate model of epilepsy. Brain Res Bull 2017;134:109-20.
[Crossref] [Google Scholar] [PubMed]
- Victor Petersen A, Perrier JF. Serotonin prevents temporal lobe epilepsy by inhibiting bursting neurons from the subiculum. Med Sci (Paris) 2017;33(8-9):727-9.
[Crossref] [Google Scholar] [PubMed]
- de Jong IEM, Mork A. Antagonism of the 5-HT6 receptor-preclinical rationale for the treatment of Alzheimer's disease. Neuropharmacology 2017;125:50-63.
[Crossref] [Google Scholar] [PubMed]
- Yu H, Chen T, Zhou L, Tang J. Effect of selective 5-HT6R agonist on expression of 5-HT receptor and neurotransmitter in vascular dementia rats. Med Sci Monit 2017;23:818-25.
[Crossref] [Google Scholar] [PubMed]
- Panczyk K, Golda S, Waszkielewicz A, Zelaszczyk D, Gunia-Krzyzak A, Marona H. Serotonergic system and its role in epilepsy and neuropathic pain treatment: A review based on receptor ligands. Curr Pharm Des 2015;21(13):1723-40.
[Crossref] [Google Scholar] [PubMed]
- Routledge C, Bromidge SM, Moss SF, Price GW, Hirst W, Newman H, et al. Characterization of SB-271046: A potent, selective and orally active 5-HT(6) receptor antagonist. Br J Pharmacol 2000;130(7):1606-12.
[Crossref] [Google Scholar] [PubMed]
- Wang L, Lv Y, Deng W, Peng X, Xiao Z, Xi Z, et al. 5-HT6 receptor recruitment of mTOR modulates seizure activity in epilepsy. Mol Neurobiol 2015;51(3):1292-9.
[Crossref] [Google Scholar] [PubMed]
- Lin W, Huang W, Chen S, Lin M, Huang Q, Huang H. The role of 5-HTR6 in mossy fiber sprouting: Activating Fyn and p-ERK1/2 in pilocarpine-induced chronic epileptic rats. Cell Physiol Biochem 2017;42(1):231-41.
[Crossref] [Google Scholar] [PubMed]
- Meneses A. Frameworking memory and serotonergic markers. Rev Neurosci 2017;28(5):455-97.
[Crossref] [Google Scholar] [PubMed]
- Eskenazi D, Brodsky M, Neumaier JF. Deconstructing 5-HT6 receptor effects on striatal circuit function. Neuroscience 2015;299:97-106.
[Crossref] [Google Scholar] [PubMed]
- Duarte JM, Lei H, Mlynarik V, Gruetter R. The neurochemical profile quantified by in vivo 1H NMR spectroscopy. Neuroimage 202;61(2):342-62.
[Crossref] [Google Scholar] [PubMed]
- Brazdil M, Marecek R, Fojtikova D, Kuba R, Krupa P, Rektor I, et al. Correlation study of optimized voxel-based morphometry and 1H MRS in patients with mesial temporal lobe epilepsy and hippocampal sclerosis. Hum Brain Mapp 2009;30(4):1226-35.
[Crossref] [Google Scholar] [PubMed]
- Hanoglu L, Ozkara C, Keskinkilic C, Altin U, Uzan M, Tuzgen S, et al. Correlation between 1H MRS and memory before and after surgery in mesial temporal lobe epilepsy with hippocampal sclerosis. Epilepsia 2004;45(6):632-40.
[Crossref] [Google Scholar] [PubMed]
- Racine RJ. Modification of seizure activity by electrical stimulation: II. Motor seizure. Electroencephalogr Clin Neurophysiol 1972;32(3):281-94.
[Crossref] [Google Scholar] [PubMed]
- Liang S, Huang J, Liu W, Jin H, Li L, Zhang X, et al. Magnetic resonance spectroscopy analysis of neurochemical changes in the atrophic hippocampus of APP/PS1 transgenic mice. Behav Brain Res 2017;335:26-31.
[Crossref] [Google Scholar] [PubMed]
- Wolf OT, Dyakin V, Patel A, Vadasz C, de Leon MJ, McEwen BS, et al. Volumetric structural Magnetic Resonance Imaging (MRI) of the rat hippocampus following Kainic Acid (KA) treatment. Brain Res 2002;934(2):87-96.
[Crossref] [Google Scholar] [PubMed]
- Hu L, Wang B, Zhang Y. Serotonin 5-HT6 receptors affect cognition in a mouse model of Alzheimer's disease by regulating cilia function. Alzheimers Res Ther 2017;9(1):76.
[Crossref] [Google Scholar] [PubMed]
- Pearce PS, Wu Y, Rapuano A, Kelly KM, de Lanerolle N, Pan JW. Metabolic injury in a variable rat model of post-status epilepticus. Epilepsia 2016;57(12):1978-86.
[Crossref] [Google Scholar] [PubMed]
- Seuwen A, Schroeter A, Grandjean J, Rudin M. Metabolic changes assessed by MRS accurately reflect brain function during drug-induced epilepsy in mice in contrast to fMRI-based hemodynamic readouts. Neuroimage 2015;120:55-63.
[Crossref] [Google Scholar] [PubMed]
- Walker MC. Hippocampal sclerosis: Causes and prevention. Semin Neurol 2015;35(3):193-200.
[Crossref] [Google Scholar] [PubMed]
- Gomes WA, Lado FA, de Lanerolle NC, Takahashi K, Pan C, Hetherington HP. Spectroscopic imaging of the pilocarpine model of human epilepsy suggests that early NAA reduction predicts epilepsy. Magn Reson Med 2007;58(2):230-5.
[Crossref] [Google Scholar] [PubMed]
- Mueller SG, Suhy J, Laxer KD, Flenniken DL, Axelrad J, Capizzano AA, et al. Reduced extrahippocampal NAA in mesial temporal lobe epilepsy. Epilepsia 2002;43(10):1210-6.
[Crossref] [Google Scholar] [PubMed]
- Riederer F, Bittsansky M, Schmidt C, Mlynarik V, Baumgartner C, Moser E, et al. 1H magnetic resonance spectroscopy at 3T in cryptogenic and mesial temporal lobe epilepsy. NMR Biomed 2006;19(5):544-53.
[Crossref] [Google Scholar] [PubMed]
- Braakman HM, van der Kruijs SJ, Vaessen MJ, Jansen JF, Debeij‐van Hall MH, Vles JS. Microstructural and functional MRI studies of cognitive impairment in epilepsy. Epilepsia 2012;53(10):1690-9.
[Crossref] [Google Scholar] [PubMed]
- Cevik N, Koksal A, Dogan VB, Dirican AC, Bayramoglu S, Ozturk M, et al. Evaluation of cognitive functions of juvenile myoclonic epileptic patients by magnetic resonance spectroscopy and neuropsychiatric cognitive tests concurrently. Neurol Sci 2016;37(4):623-7.
[Crossref] [Google Scholar] [PubMed]
- Kanamori K. Disinhibition reduces extracellular glutamine and elevates extracellular glutamate in rat hippocampus in vivo. Epilepsy Res 2015;114:32-46.
[Crossref] [Google Scholar] [PubMed]
- Forero-Quintero LS, Deitmer JW, Becker HM. Reduction of epileptiform activity in ketogenic mice: The role of monocarboxylate transporters. Sci Rep 2017;7(1):4900.
[Crossref] [Google Scholar] [PubMed]
- Rowley S, Liang LP, Fulton R, Shimizu T, Day B, Patel M. Mitochondrial respiration deficits driven by reactive oxygen species in experimental temporal lobe epilepsy. Neurobiol Dis 2015;75:151-8.
[Crossref] [Google Scholar] [PubMed]
- Shao LR, Stafstrom CE. Glycolytic inhibition by 2-deoxy-d-glucose abolishes both neuronal and network bursts in an in vitro seizure model. J Neurophysiol 2017;118(1):103-13.
[Crossref] [Google Scholar] [PubMed]
