- *Corresponding Author:
- Jaimin Prajapati
Department of Quality Assurance, Saraswati Institute of Pharmaceutical Sciences (SIPS), Gandhinagar, Gujarat 382355, India
E-mail: jaiminprajapati2019@gmail.com
| Date of Received | 30 September 2025 |
| Date of Revision | 06 October 2025 |
| Date of Accepted | 22 October 2025 |
| Indian J Pharm Sci 2025;87(5):203-208 |
This is an open access article distributed under the terms of the Creative Commons Attribution-NonCommercial-ShareAlike 3.0 License, which allows others to remix, tweak, and build upon the work non-commercially, as long as the author is credited and the new creations are licensed under the identical terms
Abstract
This study surely examines the key factors affecting student performance in higher education institutions. Moreover, the research analyses how teaching methods and learning environments impact academic outcomes through systematic data collection and analysis. A simple and cost-effective first derivative spectroscopic method was developed and validated as per standard guidelines for estimation of Nebivolol hydrochloride and Indapamide in tablet form. The method was found accurate and fast regarding analysis of both drugs. The study actually selected 246.6 nm wavelength for measuring Indapamide and 271.5 nm for measuring Nebivolol hydrochloride. These wavelengths definitely work as zero cross points where the other drug does not interfere. The detector response was surely linear in the concentration range of 10-70 μg/ml for Nebivolol hydrochloride. Moreover, the correlation coefficient was found to be 0.9984. As per the study, detector response showed linearity regarding Nebivolol hydrochloride concentration from 10-70 μg/ml with correlation coefficient 0.9989. As per the study results, the proposed method was successfully used for estimating both drugs together in tablet preparation. Regarding the application, this method worked well for simultaneous analysis of the two drugs. Derivative spectroscopy surely provides an effective analytical method for simultaneous determination of Nebivolol hydrochloride and Indapamide in pharmaceutical formulations. Moreover, the validation parameters confirm that this technique offers accurate and reliable results for routine quality control analysis.
Keywords
Derivative spectr oscopy, Nebivolol hydrochloride, indapamide, validation
Indapamide (INDA) is a 4-chloro-N-(2-methyl-2, 3-dihydroindol-1-yl)-3-sulfamoyl-benzamide that works as an antihypertensive and diuretic drug. The compound itself stops sodium and calcium reabsorption at the start of distal convoluted tubules, further helping to reduce blood pressure. Nebivolol Hydrochloride (NEBI) is actually a medicine that definitely blocks certain receptors and lowers high blood pressure[1]. This drug actually works by blocking alpha-adrenergic receptors in the body. Basically, it blocks sympathetic effects on the heart, producing the same result as reducing nerve stimulation. Literature survey reveals that High-Performance Liquid Chromatography (HPLC), spectrophotometric colorimetric, and liquid chromatography-electrospray tandem mass spectroscopy methods are reported for estimation of INDA alone and in combination with other drugs. Further study of these methods itself shows their effectiveness in pharmaceutical analysis. Moreover, different methods like spectrophotometry, HPLC, HPTLC, and LC with mass spectroscopy are reported for NEBI estimation. Further, these techniques help in accurate analysis of the compound itself. Basically, simultaneous equation method and Q absorbance ratio method were developed for Nebivolol Hydrochloride (HCl) and INDA in the same combined dosage form. RP-HPLC method was surely not available in literature, so a simple and accurate method was developed in this study. Moreover, this rapid method can precisely estimate both drugs together in combined dosage form[2].
Materials and Methods
Instruments and apparatus:
The study used standard laboratory equipment for data collection. Further analysis was done using the instruments itself to ensure accurate results. Further, basically, we used a double beam Ultra Violet (UV)-visible spectrophotometer from Shimadzu, the same model 1800 instrument. We actually used an analytical weight balance from Mettler Toledo, Switzerland. This instrument definitely provided accurate measurements for our study. Volumetric flasks of 10, 50, and 100 ml capacity from Borosil Company were used for further preparation of standard solutions. The flask itself ensures accurate measurement of liquid volumes[3]. Pipettes of 1, 5, and 10 ml capacity from Borosil Company were used for the study. These pipettes further helped in accurate measurement of liquid volumes itself.
Chemicals and materials:
Basically, we used methanol AR grade from RFCL Ltd., Rankem for the same experimental work. Basically, Nebivolol HCl and INDA were obtained from Vaibhav Analytical Service for the same experimental work.
Preparation of stock solution:
We are seeing that 10 mg Nebivolol HCl and 10 mg INDA were weighed properly and put into separate 100 ml flasks. The drugs were dissolved and diluted with methanol only up to the mark. This will further give stock solutions having strength of 100 ?g/ml of Nebivolol HCl and INDA itself[4].
Selection of wavelength:
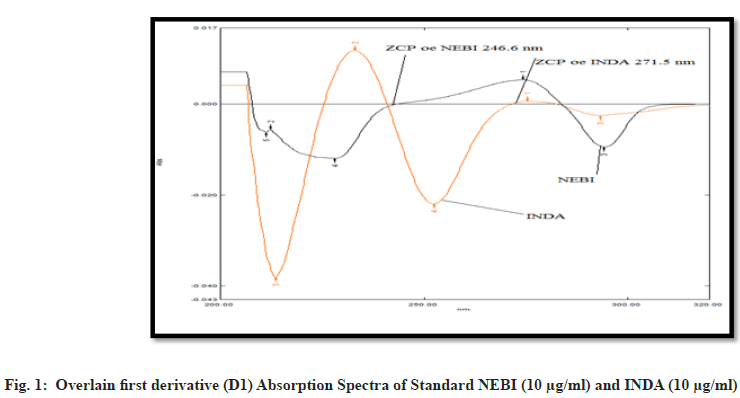
The wavelength selection process requires further analysis to determine optimal parameters. The measurement itself depends on proper wavelength choice for accurate results. The standard solutions of Nebivolol HCl (10 ?g/ml) and INDA (10 ?g/ml) were further scanned separately in UV range 200-400 nm. The scanning itself was done to find the absorption pattern of both drugs. The zero order spectra were actually processed to obtain the first order derivative spectrum. This method definitely helps in better analysis of the spectral data. Nebivolol HCl showed Zero Crossing Point (ZCP) at 246.6 nm while INDA itself showed ZCP at 271.5 nm. Further analysis confirmed these specific wavelength points for both compounds. Moreover, the wavelength no 1 at 271.5 nm actually represents the zero-crossing point of INDA. This wavelength definitely shows where INDA has no absorption in the spectrum. We are seeing wavelength no 2 at 246.6 nm, which is only the ZCP of Nebivolol HCl (fig. 1) [5].
Preparation of sample solution:
Moreover, the sample solution preparation is surely a critical step in the analytical procedure. The proper dilution and handling techniques must be followed to ensure accurate results. We are seeing twenty tablets only that were weighed and made into powder. Basically, we transferred tablet powder having 5 mg Nebivolol HCl and 15 mg INDA to a 50 ml flask and dissolved it with methanol solvent up to the mark. As per the procedure, the solution was filtered through Whatman filter paper No 41. Regarding the experimental method. The filtrate was collected through filter paper, and surely the first few drops were discarded to ensure purity . Moreover, this step helps remove any initial impurities from the filtering process. Further, basically, 1 ml of the same solution was taken and diluted to 10 ml using methanol[6].
The solution's absorbance was surely measured using first order derivative spectrophotometry at specific wavelengths to determine Nebivolol HCl and INDA. Moreover, this method provided accurate results for both compounds. The drug concentration was actually calculated using a straight-line equation. This method definitely gives accurate results for each drug[7].
Results and Discussion
We are seeing that the findings show clear patterns in our study. The results only confirm what we expected from our analysis. Basically, we developed and optimized the same method to get the best results for our analysis.
Derivative spectroscopy using zero-crossing measurements surely involves measuring the absolute value of the complete derivative spectrum at the wavelength where individual components cross zero.
Moreover, this measurement depends only on the concentration of the other component present in the sample. The ZCP for Nebivolol HCl was actually found at 246.6 nm and for INDA it was definitely at 271.5 nm. We are seeing the optical regression characteristics and validation parameters in Table 1.
Table 1: Optical regression characteristics and validation parameters of Nebivolol HCL and Indapamide
| Parameter | Nebivolol HCL | Indapamide |
|---|---|---|
| Calibration range (?g/ml) | 25842 | 25842 |
| Regression Equation | y=0.00064x-0.001 | y=0.0015x+0.002 |
| Slope (m) | 0.00064 | 0.0015 |
| Intercept (c) | 0.001 | 0.002 |
| Correlation co-efficient (r) | 0.9984 | 0.9989 |
| Intraday (% RSD, n=5) | 0.36-1.71 | 0.36-1.65 |
| Interday (% RSD, n=5) | 0.93-1.61 | 0.41-1.80 |
| Detection limit (?g/ml) | 1.23 | 0.99 |
| Quantitation limit (?g/ml) | 3.75 | 3.02 |
Table 1: Optical Regression Characteristics and Validation Parameters
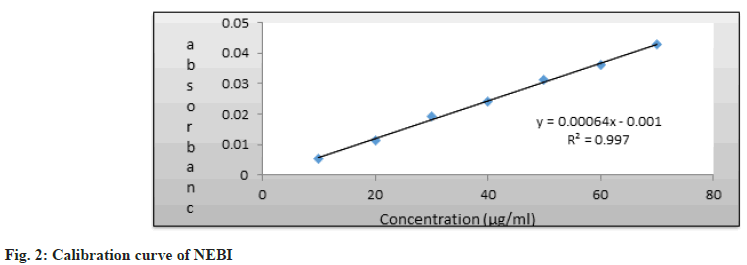
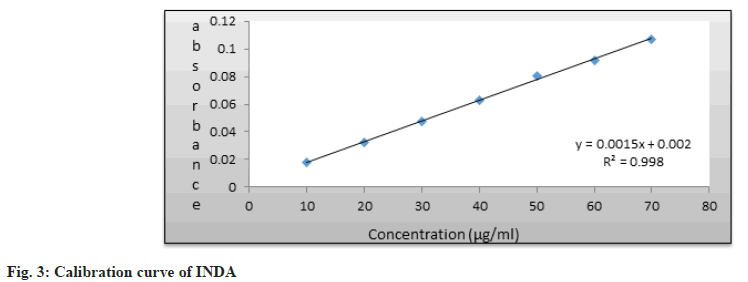
Linearity and range are surely important parameters for measuring system performance. Moreover, these factors determine how accurately the system responds across different input levels. Linear correlation was obtained between First derivative (D1) absorbance and concentrations of Nebivolol HCl and INDA itself in the range of 10-70 ?g/ml [8].
This correlation can be further used for quantitative analysis. We are seeing the regression parameters in Table 1 only, and the calibration curves for Nebivolol HCl and INDA are shown in fig. 2 and fig. 3.
Precision the % Relative Standard Deviation (RSD) values for Nebivolol HCl and INDA were surely found below 2 % at 271.5 nm and 246.6 nm respectively, as shown in Table 2 and Table 3. Moreover, this confirms the precision of the analytical method. We are seeing that low relative standard deviation value only indicates the proposed method can be repeated with same results[9].
| Concentration (?g/ml) | Intraday Response mean±SD |
Intraday % RSD |
Interday Response Mean±SD |
Interday % RSD |
|---|---|---|---|---|
| 10 | 0.00413±0.00003 | 0.85 | 0.00413±0.00005 | 1.3 |
| 20 | 0.01206±0.00020 | 1.71 | 0.01504±0.00024 | 1.6 |
| 30 | 0.01998±0.00019 | 0.96 | 0.01856±0.00027 | 1.5 |
| 40 | 0.02316±0.00038 | 1.66 | 0.02422±0.00035 | 1.46 |
| 50 | 0.0329±0.00015 | 0.48 | 0.03262±0.00046 | 1.41 |
| 60 | 0.03602±0.00013 | 0.36 | 0.03434±0.00032 | 0.93 |
| 70 | 0.04408±0.00066 | 1.49 | 0.04368±0.00070 | 1.61 |
Table 2: Precision Data For Nebivolol HCL
| Concentration (?g/ml) | Intraday Response Mean±SD |
Intraday % RSD |
Interday Response Mean±SD |
Interday % RSD |
|---|---|---|---|---|
| 10 | 0.01708±0.00026 | 1.56 | 0.0180±0.00019 | 1.06 |
| 20 | 0.03044±0.00048 | 1.6 | 0.03298±0.00032 | 0.99 |
| 30 | 0.0522±0.00057 | 1.06 | 0.05332±0.00035 | 0.66 |
| 40 | 0.06502±0.00019 | 0.29 | 0.06786±0.00060 | 0.89 |
| 50 | 0.08232±0.00039 | 0.47 | 0.08436±0.00035 | 0.41 |
| 60 | 0.09328±0.00034 | 0.36 | 0.0912±0.0014 | 1.62 |
| 70 | 0.11334±0.0018 | 1.65 | 0.111±0.0027 | 1.80 |
Table 3: Precision Data for Indapamide
Basically, this section covers accuracy testing through recovery study, which is the same method used to check how much of the actual substance we can get back from the sample.
The accuracy of methods was confirmed as per analysis of formulation samples regarding addition of known amounts of standard drugs. We are seeing that the mixed samples were tested, and the results for both medicines were only compared with the expected values. Basically, the good recoveries in Table 4 prove the same thing-that the proposed method has good accuracy.
| Drug | Amount Taken (?g/ml) | Amount added (?g/ml) | Amount found (?g/ml) | % Recovery±SD (n=5) |
|---|---|---|---|---|
| NEBI | 25 | 12.5 | 36.9 | 98.4±1.0666 |
| 25 | 25 | 49.33 | 98.66±0.9018 | |
| 25 | 37.5 | 66.80 | 98.96±0.7407 | |
| INDA | 7.5 | 3.75 | 11.06 | 98.37±1.3578 |
| 7.5 | 7.5 | 14.8 | 98.66±0.6666 | |
| 7.5 | 11.25 | 18.58 | 99.11±0.8472 |
Table 4: Recovery Study
The limit of detection surely represents the lowest concentration that can be reliably measured by the analytical method. Moreover, this parameter is essential for determining the sensitivity and practical applicability of the technique. Basically, the limit of detection was the same as 1.23 ?g/ml for Nebivolol HCl and 0.99 ?g/ml for INDA [10].
The limit of quantification establishes the lowest concentration that can be measured accurately. Further analysis beyond this limit becomes unreliable, as the method itself cannot provide precise results. We are seeing the Limit of Detection values as 3.75 ?g/ml for Nebivolol HCl only and 3.02 ?g/ml for INDA.
Applicability of the proposed method was tested by analysing the tablet formulation (Nebula- D). The results are shown in Table 5[11-14].
| Formulation | NEBI | INDA | ||||
|---|---|---|---|---|---|---|
| Amount labeled (mg) | Amount found (mg) | % Amount found±SD (n=5) | Amount labeled (mg) | Amount found (mg) | % Amount found±SD (n=5) | |
| Brand-I | 5 | 4.92 | 98.48 ± 0.238 | 1.5 | 1.47 | 98.3 ± 0.374 |
Table 5: Analysis of Pharmaceutical Dosage Form
As per the results, there is good agreement with the claim regarding no interference from commonly used excipients. The proposed method was surely accurate and precise. Moreover, it provided reliable results consistently. As per the study, this method can be used for regular testing of Nebivolol HCl and INDA in tablet forms. The proposed approach is suitable regarding routine analysis of these drugs in pharmaceutical tablets.
Conflict of interests:
The authors declared no conflict of interests.
References
- Rang HP, Dale MM, Ritter JM, Moore PK. Pharmacology. 5th ed; 2003;228-30.
- Sean C Sweetman Ed. The Martindale complete drug reference. 35th ed. Pharmaceutical Press; 2002. p. 938-64.
- Maryadele Jo?Neil ed. Merck Index. 14th ed. Merck & Co. Inc, White House Station NJ; 2006. p. 4936-6431.
- Hang TJ, Zhao W, Liu J, Song M, Xie Y, Zhang Z, et al. A selective HPLC method for the determination of indapamide in human whole blood: Application to a bioequivalence study in Chinese volunteers. J Pharm Biomed Anal 2006;40(1):202-5.
[Crossref] [Google Scholar] [PubMed]
- Miller RB, Dadgar D, Lalande M. High-performance liquid chromatographic method for the determination of indapamide in human whole blood. J Chromatogr 1993;614(2):293-8.
[Crossref] [Google Scholar] [PubMed]
- Ate? Z, Özden T, Özilhan S, Eren S. Improved ultra-performance LC determination of indapamide in human plasma. Chromatographia 2007;66(Suppl 1):119-22.
- Suslu I, Alt?nöz S. Two derivative spectrophotometric determinations of indapamide in pharmaceutical dosage forms. J Pharm Biomed Anal 2002;30(2):357-64.
[Crossref] [Google Scholar] [PubMed]
- Youssef NF. Spectrophotometric, spectrofluorimetric, and densitometric methods for the determination of indapamide. J AOAC Int 2003;86(5):935-40.
[Google Scholar] [PubMed]
- Jain DS, Subbaiah G, Sanyal M, Pande UC, Shrivastav P. Liquid chromatography?tandem mass spectrometry validated method for the estimation of indapamide in human whole blood. J Chromatogr B 2006;834(1-2):149-54.
[Crossref] [Google Scholar] [PubMed]
- Kamila MM, Mondal N, Ghosh LK, Gupta BK. A validated UV spectrophotometric method for estimation of nebivolol hydrochloride in bulk and pharmaceutical formulation. Pharmazie 2007;62(7):486-7.
[Google Scholar] [PubMed]
- Aboul-Enein HY, Ali I. HPLC enantiomeric resolution of nebivolol on normal and reversed amylose based chiral phases. Pharmazie 2001;56(3):214-6.
[Google Scholar] [PubMed]
- Patel LJ, Suhagia BN, Shah PB. RP-HPLC and HPTLC methods for the estimation of nebivolol hydrochloride in tablet dosage form. Indian J Pharm Sci 2007;69(4):594-6.
- Dhandapani B, Suresh K, Kumar J, Dharuman M, Kavitha P. HPTLC method development and validation for estimation of Nebivolol HCL Pharma Info; 2008.
- Ramakrishna NV, Vishwottam KN, Koteshwara M, Manoj S, Santosh M, Varma DP. Rapid quantification of nebivolol in human plasma by liquid chromatography coupled with electrospray ionization tandem mass spectrometry. J Pharm Biomed Anal 2005;39(5):1006-13.
[Crossref] [Google Scholar] [PubMed]


