- *Corresponding Author:
- A. S. Mohammad
Department of Pharmaceutical Analysis and Quality Assurance,
Nizam Institute of Pharmacy,
Telangana 500004,
Hyderabad
E-mail: abdulsaleemmohammad89@gmail.com
| Date of Received | 05 May 2020 |
| Date of Revision | 04 June 2021 |
| Date of Acceptance | 13 September 2021 |
| Indian J Pharm Sci 2021;83(5):974-981 |
This is an open access article distributed under the terms of the Creative Commons Attribution-NonCommercial-ShareAlike 3.0 License, which allows others to remix, tweak, and build upon the work non-commercially, as long as the author is credited and the new creations are licensed under the identical terms
Abstract
Zanamivir is an antiviral agent useful in the treatment and prevention of type A and B kind of influenza viruses in pediatric and adult patients. A specific and accurate analytical method by liquid chromatography with tandem mass spectrometry was developed and validated for the estimation of zanamivir in biological matrices of humans. Ledipasvir was utilized as an internal standard. Chromatographic elution of zanamivir and ledipasvir were attained on C18 Thermo base deactivated silica Hypersil column (50 mm×4.6 mm, 5 μm) with mobile phase of same polarity, made up of 0.1 % formic acid and acetonitrile (35:65, v/v) processed at 0.7 ml/min flow rate. The method was linear over the range of 2.15-64.5 ng/ml with more than 0.999 r2 values, consisting of 2.15 ng/ml as lower limit of quantification. Analytes were subjected for pretreatment by solid-phase extraction procedure with average extraction recovery findings within 95.7±1.23 %. Method accuracy findings were present in between 96.49 % to 103.88 % and the assessed percentage relative standard deviation findings for within and between run precision were ≤6.81 %. Analytes were subjected for variable storage conditions for the assessment of stability and were stable at respective conditions. The developed liquid chromatography with tandem mass spectrometry technique for the quantitation of zanamivir in biological matrix was suitable for routine analysis of patient’s blood samples for the pharmacokinetic studies and drug monitoring.
Keywords
Zanamivir, influenza, neuraminidase inhibitor, validation, liquid chromatography with tandem mass spectrometry
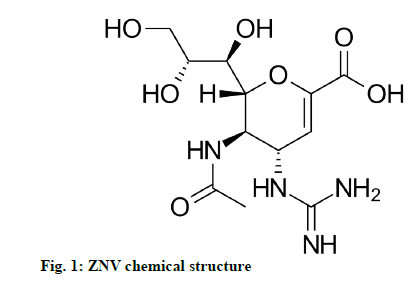
Zanamivir (ZNV) is used to treat and prevent the infections caused by influenza A and influenza B type of viruses in pediatric and adult patients, as an antiviral agent. It is the first drug of the neuraminidase inhibiting compounds [1]. The drug shows its action by binding to neuraminidase protein active site, executing the influenza virus incompetent to discharge its host-cell and infection to other persons. It also inhibits the replication of influenza virus both in vitro and in vivo [2-4]. It is one of the only two drug components to treat swine flu affected by Hemagglutinin type 1 and Neuraminidase type 1 (H1N1) virus in 2009. This drug also inhibits the Neuraminidase 2 (NEU2) and Neuraminidase 3 (NEU3) sialidases in humans, which leads to the adverse effects of ZNV. At present the drug is in the market as Relenza (trade name) by Glaxosmithkline as a dry powder for oral inhalation. After 10 mg single dose of drug powder, the maximum plasma concentration (Cmax) and area under the curve from time zero to infinity (AUC∞) values are 43 ng/ml and 167 ng.h/ml. ZNV chemically designated as (2R,3R,4S)-4-guanidino-3-(prop-1- en-2-ylamino)-2-((1R,2R)-1,2,3-trihydroxypropyl)- 3,4-dihydro-2H-pyran-6-carboxylic acid (fig. 1) with molecular weight and formula of 332.31 g/mol and C12H20N4O7 respectively [5-7].
Literature review about ZNV showed that there are few analytical methods reported on Ultraviolet (UV) spectrophotometer [8], High Performance Thin Layer Chromatography (HPLC) [9], reverse phase liquid chromatography [8-11] and liquid chromatography with tandem mass spectrophotometer [12-14] for its quantification. The present aim of the research work is to establish a specific and accurate Liquid Chromatography with Tandem Mass Spectrometry (LC-MS/MS) technique for the quantitation of ZNV in biological matrices. An extraction procedure was optimized utilizing the Solid-Phase Extraction(SPE) technique for attaining a better percentage recovery of ZNV. The validation of the method was executed as per the guidelines of bioanalytical method validation of European Medicines Agency (EMA) [15] and Food and Drug Administration (FDA) [16]. The developed method can be useful in routine Quality Control (QC), bioavailability, bioequivalence and forensic studies.
Materials and Methods
Chemicals and reagents:
ZVR and ledipasvir internal standard (IS) were procured from Manus Aktteva Biopharma LLP, Ahmedabad, India. Methanol and acetonitrile (HPLC grade) solvents were bought from A.B enterprises, Mumbai, India. Formic acid and ammonium formate (analytical grade) were bought from Sreeni labs, Hyderabad, India. Water for the analytical technique was processed from the Integral-3 MilliQ purifier equipment, Millipore, USA. Blank human plasma (drug free) was bought from Laxmi Sai Clinicals, Hyderabad, India and was monitored in a freezer till the method of analysis.
Instrument:
The LC-MS/MS system was Applied Biosystems/ MDS SCIEX API-6500 furnished with electro-spray ionization source. Data acquisition and instrument control were processed by Analyst software 1.5.2 version. The HPLC system was Shimadzu LC-30AD liquid chromatography comprised of four pumps, an autosampler (SIL-30AC) and CTO-20AC prominence column oven compartment. Samples were extracted with Chromabond-C18 stationary columns of Germany.
Digital micropipettes of different microlitre (μl) capacity were calibrated and utilized during the SPE technique.
Liquid chromatography and Mass Spectrometry (MS) parameters:
ZNV and ledipasvir (IS) were resolved in a chromatographic system comprising Thermo-BDS Hypersil-C18 (50 mm×4.6 mm, 5 μm) column retained at 25°. Mobile phase of same polarity, made up of 0.1 % formic acid and acetonitrile (35:65, v/v) processed at 0.7 ml/min flow rate with an analyte infusion volume of 5.0 μl. The elution time for the separation of drug and IS was found to be 6.5 min. The MS detection system was processed at positive ionization mode utilizing Electrospray Ionization (ESI) source. The remaining MS conditions were: nebulizer pressure 25 psi, gas flow 10.0 ml/min, gas temperature 300° and capillary voltage 4000 V. Nitrogen (N2) gas was utilized as collision/drying gas. Quantitation of drug and IS were processed by utilizing Multiple Reaction Monitoring (MRM) mode. The examined precursor to product ion molecular weight transitions for ZNV was 333.14→61.04 and for the IS was at 889.4→130.0.
Protocol for standard stock solutions:
Stock solution of ZNV was processed by solubilizing 10.0 mg of ZNV in 10 ml of methanol to produce 1.0 mg/ml primary stock. The resulting stock was monitored at −20° till further method of analysis. Working stock consisting of 50 μg/ml drug solution was processed by serial dilution method with methanol as diluent. Primary and working stock solution of IS were processed in same manner with diluent and it was further diluted to get 50 ng/ml solution.
Protocol for sample extraction:
In the sample extraction process firstly the stationary column of SPE Chrombond-C18 was activated with 2 ml of diluent and next with 1 ml of 1.0 % Diethyl amine (DEA) solution. Secondly the stationary column was loaded with 200 μl of analyte plasma followed by 100 μl of 1 % DEA and 100 μl of ledipasvir 50 ng/ml solutions. Further, sample solution moves slowly along the stationary phase and after moving, wash the stationary phase with 1.0 % DEA. In the next step analyte was separated into a flask utilizing 3.0 ml of acetone solvent and the resulting solution was dried at 45° in an evaporator under the N2 stream. Next, 200 μl of methanol was transferred to a flask containing residue and it was transferred to an autosampler for the analysis.
Validation:
Validation of the developed LC-MS/MS technique was performed as per the EMA [15] and FDA [16] guidelines related to bioanalytical method.
Sensitivity and calibration curve:
Solution consisting of ZNV 10 μg/ml was processed from the ZNV working stock solution by serial dilution method using diluent. From the resulting solution 8 nonzero calibration standards were processed over a range of 2.15-64.5 ng/ml with diluent. All the calibration standards were subjected for extraction and examined in triplicates to assess the linearity of the analytical method. The lowest concentration as Lower Limit of Quantification (LLOQ) (2.15 ng/ml) solution was assessed for the quantification to prove the sensitivity of the analytical method.
Carry over and specificity:
To assess the carry over, after infusing the highest concentration of analyte blank was infused and examined. The response in the blank should be less than 20 % of LLOQ of analyte and 5 % of the IS response. 6 blank samples of human plasma were collected from 6 different individuals to examine the intervention by variable endogenous compounds to be present in the sample at retaining time of ZNV and IS. For this infusion of standard solutions of ZNV and IS were essential to identity the nosiness between each sample.
Precision and accuracy:
Four different QC standards including LLOQ concentration were processed individually from the calibration solutions. These concentrations were 64.5 ng/ml High Quality Control (HQC), 43.0 ng/ml Middle Quality Control (MQC), 6.02 ng/ml Low Quality Control (LQC) and 2.15 ng/ml (LLOQ). The run precision and accuracy within and between a developed process was estimated by the examination of 6 duplicate solutions of each concentration in 3 infusions on 3 alterative days. The percentage recoveries were calculated and the findings should be in the range of ±15.0 % of original value of QC standards and within ±20.0 % for LLOQQC. The between and within run percentage Relative Standard Deviation (% RSD) calculated findings should be ≤15.0 % for QC standards except for Lower Limit of Quantification Quality Control (LLOQQC) which should be ≤20.0 %.
Matrix effect:
Matrix effect was assessed by collecting 6 blank samples of human plasma from six different lots. The Matrix Factor (MF) and IS normalized MF were determined for each lot of plasma sample. MF was determined at LQC and HQC concentration levels and the % RSD value of the IS normalized MF should be ≤15.0 % for 6 different lots of plasma samples. MF and IS normalized MF was calculated form the following formulae:
Analyte MF=Peak response in presence of matrix ions/ Average peak response in aqueous samples
IS normalized MF=MF of analyte/MF of IS
Recovery:
The recovery of the analytical method was determined by comparing the findings of QC extracted samples with blank extracted samples spiked with respective QC standards after the extraction process. The degree of percentage recovery should be constant and reproducible.
Stability:
The ZNV stability was evaluated after exposing the QC standards to variable storage environments. The applied parameters comprises 3 freeze and thaw sequences (kept at −20° for 12 h), long-term stability at storage temperature of −20° for 30 d, short-term stability at the temperature of room for 8 h and the prepared extract sample stability after 24 h at 4°.
Dilution integrity:
ZNV dilution integrity was processed by 5 times diluting the 6 human plasma aliquots consisting of 86 ng/ml of drug. The resulting samples were subjected for extraction and examined. The found concentration levels were equated with the undiluted samples of human plasma consisting of 17.2 ng/ml to check whether the dilution effect was within precision and accuracy range or not. The precision and accuracy should be considering the previously stated acceptance limit.
Results and Discussion
Optimization of chromatographic conditions was discussed below. The chromatographic conditions of analytical technique were adjusted to produce the separated symmetrical peak responses within the reasonable time and better method sensitivity. 0.1 % formic acid in water and a Aetonitrile (ACN) (35:65, v/v) was selected as a better and efficient movable phase for the successful elution of drug and IS. Asymmetric ZNV peak response was produced with methanolic movable phase. Decrease in ACN percentage to <65 % results in without symmetrical IS peak response due to overlay with peak response of mobile phase. On decreasing the aqueous phase of movable phase having 0.1 % formic acid (HCOOH) decreased peak tailing of ZNV to 1.8. Utilizing 0.1 % HCOOH in the ratio of 35 % produced a good symmetrical type of peak response with <1.2 tailing factor. XDB-Eclipse C8 (4.6 mm×150 mm, 5 μm) (Agilent, USA) stationary column, Nucleodur 100-5 C18 (4.6 mm×150 mm, 5 μm) (Germany) column and BDS/Hypersil-C18 (50 mm×4.6 mm, 5 μm) (Thermo Fisher scientific) stationary columns were subjected for the optimization over the analytical method development. The 1st and 2nd stationary column types separated ZNV drug after 8 min. The 3rd type of column was the utmost one which produced the symmetrical type of peak responses for ZNV and IS, were eluted in the total run time of 6.5 min.
The analytical technique reliability and sensitivity was improved by optimizing the MS conditions. This process of optimization was started with examination utilizing mode “MS-2 scan” to assess the ZNV and IS precursor ions. The next stage was the estimation of the right fragmentation voltage. Two different kinds of product ions were defined utilizing the mode “product ion” for drug and IS. Further, most stable ion was selected as quantifier and other ion was selected as qualifier. In the study the peak response ratio of qualifier ion vs. quantifier ion should be constant. Collision ion energies of drug and IS and other ionic optical conditions were examined and optimized to get the high possibility MS detection. Sensitive and specific study of calibrator ions of drug and IS were established by performing final examination at MRM mode.
Optimization of sample pretreatment was described below. SPE process was selected to get the highest accuracy and recovery when compared with liquidliquid extraction and protein precipitation methods to decrease the contamination [17]. During the optimization of sample pretreatment type of extraction column, solution for the washing and solvent for the elution (Table 1) parameters were considered. Utilization of 1 % DEA was essential in the course of pretreatment stage. Different trials were performed with these parameters and analyzed for the high accuracy values and the details of the trials were represented in the Table 1.
| Parameter | Recovery percentage±Standard deviation (SD) |
|---|---|
| Elution solvent | |
| Chloroform | 46.57±3.17 |
| Ethylacetate | 83.09±2.76 |
| Methanol | 96.28±2.14 |
| Acetone | 97.23±1.89 |
| Extraction column | |
| Chrombond-C8 | 94.04±1.03 |
| Chrombond-CN | 96.22±2.45 |
| Chrombond-C18 | 96.86±2.31 |
| Washing solution | |
| Ammonium hydroxide | 79.52±3.06 |
| 1 % Triethylamine | 91.17±3.21 |
| 1 % Diethylamine | 96.91±2.67 |
Table 1: Optimization of Spe Procedure For ZNV (n=6)
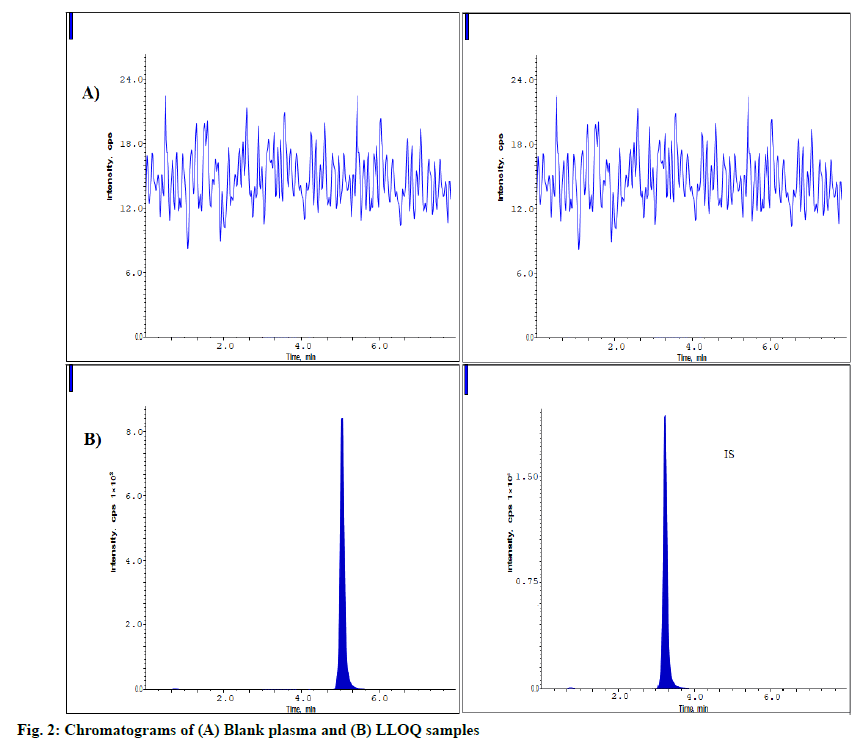
Validation parameters were discussed below. The fig. 2 represents the blank plasma sample and LLOQQC chromatograms. These chromatograms prove that blank plasma has no interfering components when equating with LLOQ sample. The analyte and IS samples were eluted at 5.1 and 3.2 min having the resolution of >5. The carryover was processed as per the method and evaluated it as <3.0 % of LLOQQC for ZNV and <0.92 % for IS.
The linearity graph was plotted by considering the peak response ratio of analyte and IS against the actual concentration of analyte over the concentration of 2.15-64.5 ng/ml and the results were shown in Table 2. The linearity equation was found to be y=0.00413x+0.00562 and in this equation ‘y’ value represents peak response ratio of ZNV to IS and ‘x’ value represents the ZNV concentration level. The regression coefficient (r2) was ≥0.999.
| Actual concentration (ng/ml) | 2.15 | 4.3 | 8.6 | 16 | 25.8 | 37 | 50.5 | 64.5 | Slope | Intercept |
|---|---|---|---|---|---|---|---|---|---|---|
| 1 | 2.04 | 3.93 | 8.52 | 15.82 | 25.88 | 36.91 | 52.1 | 63.05 | 0.0041 | 0.00541 |
| 2 | 2.08 | 4.16 | 8.69 | 15.99 | 25.94 | 36.67 | 53.12 | 63.29 | 0.0048 | 0.00562 |
| 3 | 2.14 | 4.23 | 8.75 | 15.75 | 25.48 | 36.42 | 51.68 | 62.56 | 0.0035 | 0.00584 |
| Mean | 2.08 | 4.11 | 8.65 | 15.86 | 25.76 | 36.67 | 52.29 | 62.97 | 0.00413 | 0.00562 |
| ±SD | 0.052 | 0.15 | 0.12 | 0.12 | 0.25 | 0.24 | 0.73 | 0.37 | 0.00065 | 0.00022 |
| % CV | 2.48 | 3.73 | 1.36 | 0.76 | 0.96 | 0.66 | 1.41 | 0.59 | ||
| % Accuracy | 96.93 | 95.5 | 100.63 | 99.09 | 99.87 | 99.1 | 103.55 | 97.62 |
Note: CV: Coefficient of variance; SD: standard deviation
Table 2: Linearity Data For ZNV
The precision and accuracy findings of ZNV determinations were produced in Table 3. Run accuracy within and between were estimated and the findings were present in between 96.0-104.0 %. The % RSD findings for within the run precision values were <6.90 %. The run precision between and % RSD findings were <2.40 % and for the LLOQQC it was found to be 7.47 %. The findings of the analytical method precision and accuracies show that the method has high degree of precision and accuracy.
| Nominal concentrations in ng/ml | Within-run | Between-run | ||||
|---|---|---|---|---|---|---|
| Meana±SD | Precision (% RSD) | Accuracy (average percentage) | Meana±SD | Precision (% RSD) | Accuracy (average percentage) | |
| 2.15 | 2.23±0.21 | 6.81 | 103.88 | 2.12±0.22 | 7.47 | 98.63 |
| 6.02 | 6.06±0.28 | 2.78 | 100.7 | 6.01±0.23 | 2.33 | 99.99 |
| 43 | 43.53±3.10 | 1.02 | 101.25 | 43.086±5.92 | 1.97 | 100.2 |
| 64.5 | 62.32±2.35 | 2.63 | 96.63 | 62.24±14.52 | 1.88 | 96.49 |
Note: SD: Standard deviation; a: Six replicates; RSD: Relative standard deviation
Table 3: The Accuracy and Precision Data For ZNV
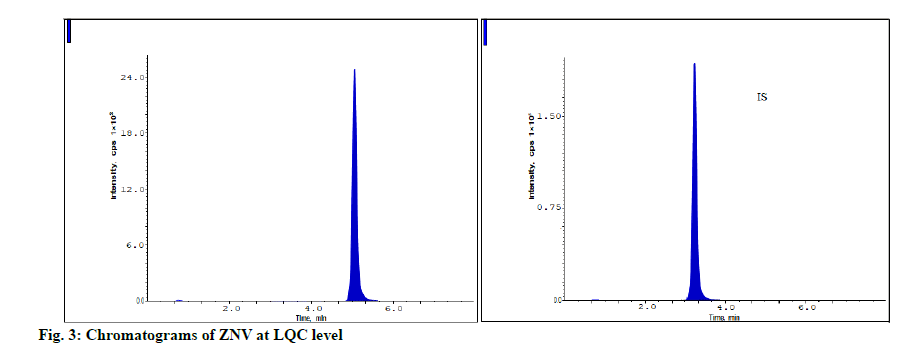
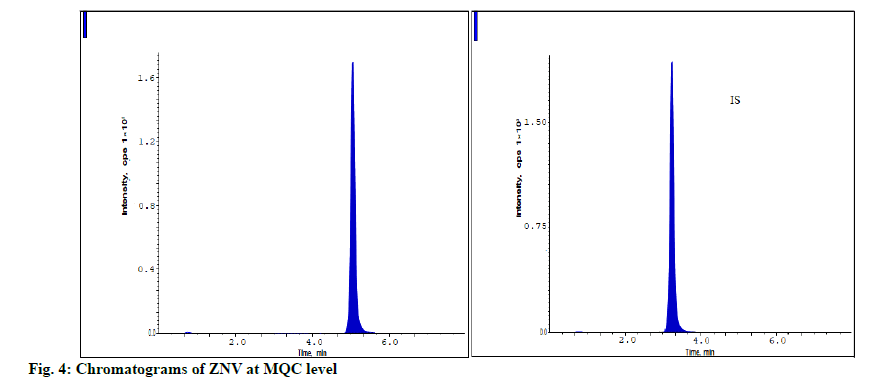
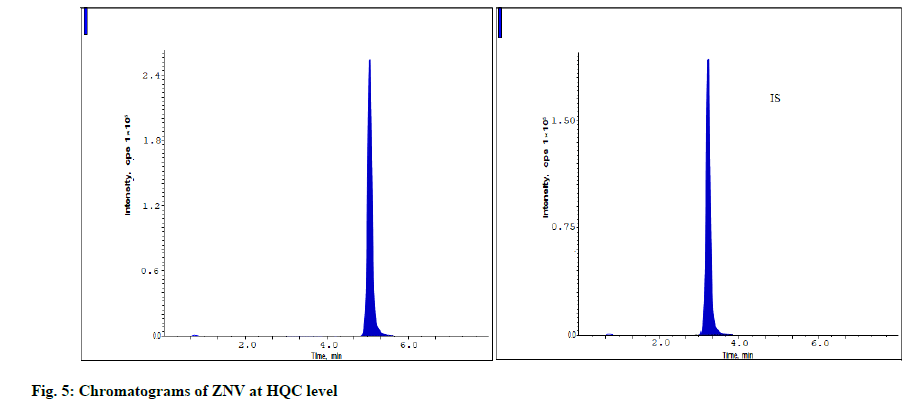
The developed method was assessed for stability at LQC, MQC and HQC levels and the findings were shown in the Table 4. The measured accuracy findings for ZNV estimations were present in between 91.96-97.26 % of the original concentration levels and were present in the acceptable limit. It proves that the ZNV has high degree of stability over variable conditions of storage (fig. 3-fig. 5).
| Storage condition | LQC | MQC | HQC | |||
|---|---|---|---|---|---|---|
| Accuracy (% Mean) | Precision (% RSD) | Accuracy (% Mean) | Precision (% RSD) | Accuracy (% Mean) | Precision (% RSD) | |
| Room temperature 8 h | 95.4 | 4.01 | 94.63 | 3.21 | 95.05 | 1.22 |
| 30 d at −20° | 96.31 | 3.26 | 91.96 | 4.57 | 94.36 | 2.64 |
| 3 freeze-thaw cycles | 92.78 | 2.85 | 96.55 | 3.65 | 96.1 | 2.48 |
| Extract, 24 h at 4° | 92.62 | 4.89 | 97.26 | 2.08 | 93.69 | 1.82 |
RSD: Relative standard deviation
Table 4: The Stability Results For ZNV in Human Plasma
The parameter matrix effect was important for an LCMS/ MS analysis to find whether the matrix components of plasma were producing ionic enhancement and suppression effect at the MS detection. The MF was evaluated at HQC and LQC standards and the values were 0.98±0.02 and 0.99±0.04 respectively. The IS normalized MF % RSD findings of 6 variable lots were ≤5.02 % at LQC and HQC levels. It proves that there was no interference with the matrix components of plasma with the drug and IS response.
ZNV was subjected for the average recovery studies at 6.02 ng/ml, 43 ng/ml and 64.5 ng/ml and the findings were 93.4 %, 92.8 % and 94.7 % respectively and were shown in the Table 5. The overall % RSD was found to be 0.85 % and the average recovery of IS was found to be 95.6±0.92. Dilution integrity of the method was assessed by processing 5 folds dilution of 6 samples consisting ZNV of 86 ng/ml and the percentage accuracy was found to be 98.01±2.82 %.
| Concentration level | X | Y | % Recovery | % Mean recovery | % RSD |
|---|---|---|---|---|---|
| LQC (6.02 ng/ml) | 24841 | 23201.5 | 93.4 | 93.63 | 0.85 |
| MQC (43.0 ng/ml) | 177441 | 164665 | 92.8 | ||
| HQC (64.5 ng/ml) | 266163 | 252056 | 94.7 | ||
| IS | 200256 | 191445 | 95.6 |
Note: Y=Average recoveries of extracted samples; X=Average recoveries of unextracted samples
Table 5: ZNV Extraction Recovery Results
An accurate analytical method was developed and validated for the estimation of ZNV in biological matrices of humans by LC-MS/MS utilizing ledipasvir as IS. Chromatographic elution of ZNV and ledipasvir were attained on C18 Thermo-BDS Hypersil column (50 mm×4.6 mm, 5 μm) with mobile phase of same polarity, made up of 0.1 % formic acid and acetonitrile (35:65, v/v) processed at 0.7 ml/min flow rate. Analytes were subjected for pretreatment by SPE method with average extraction recovery findings of 95.7±1.23 %. Method accuracy findings were present in between 96.49 % to 103.88 % and the assessed % RSD findings for within and between run precision were ≤6.81 %.
The validation data of the developed method represents that the proposed method was applicable for the pharmacokinetic and bioequivalence studies.
Conflicts of interest:
The authors declared no conflict of interest.
References
- Hata K, Koseki K, Yamaguchi K, Moriya S, Suzuki Y, Yingsakmongkon S, et al. Limited inhibitory effects of oseltamivir and zanamivir on human sialidases. Antimicrob Agents Chemother 2008;52(10):3484-91.
- Sugaya N, Tamura D, Yamazaki M, Ichikawa M, Kawakami C, Kawaoka Y, et al. Comparison of the clinical effectiveness of oseltamivir and zanamivir against influenza virus infection in children. Clin Infect Dis 2008;47(3):339-45.
- Thorlund K, Awad T, Boivin G, Thabane L. Systematic review of influenza resistance to the neuraminidase inhibitors. BMC Infect Dis 2011;11(1):1-3.
- Soundararajan V, Tharakaraman K, Raman R, Raguram S, Shriver Z, Sasisekharan V, et al. Extrapolating from sequence-the 2009 H1N1 'swine' influenza virus. Nat Biotechnol 2009;27(6):510-3.
- Freund B, Gravenstein S, Elliott M, Miller I. Zanamivir. Drug Saf 1999;21(4):267-81.
- Haque SM, Elzagheid M. Antiviral drugs for influenza viruses. Int J Pharm Pharm Sci 2019;11:1-10.
- Peng AW, Milleri S, Stein DS. Direct measurement of the anti-influenza agent zanamivir in the respiratory tract following inhalation. Antimicrob Agents Chemother 2000;44(7):1974-6.
- Reddy CB, Reddy SGV. UV visible spectrophotometric estimation of Zanamvir. J Chem Pharm Res 2017;9:189-92.
- Bhirud CH, Nandal DH. Stability indicating RP-HPLC and HPTLC methods for the determination of zanamivir in bulk and dosage form. Int J Pharm Pharm Sci 2016;8(7):249-56.
- Rajendran R, Devikasubramaniyan, Sura RS, Sunil V, Kumar MB, Gopinath P, et al. RP-HPLC PDA method for estimation of zanamivir in API and pharmaceutical formulation. Indo Am J Pharm 2018;5(4):2110-6.
- Reddy YR, Harika KS, Sowjanya KS, Swathi E, Soujanya B, Reddy SS. Estimation of zanamivir drug present in tablets using RP-HPLC method. Int J PharmTech Res 2011;3:180-6.
- Baughman TM, Wright WL, Hutton KA. Determination of zanamivir in rat and monkey plasma by positive ion hydrophilic interaction chromatography (HILIC)/tandem mass spectrometry. J Chromatogr B 2007;852(1-2):505-11.
- Berendsen BJ, Wegh RS, Essers ML, Stolker AA, Weigel S. Quantitative trace analysis of a broad range of antiviral drugs in poultry muscle using column-switch liquid chromatography coupled to tandem mass spectrometry. Anal Bioanal Chem 2012;402(4):1611-23.
- Lindegardh N, Hanpithakpong W, Kamanikom B, Farrar J, Hien TT, Singhasivanon P, et al. Quantification of the anti-influenza drug zanamivir in plasma using high-throughput HILIC–MS/MS. Bioanalysis 2011;3(2):157-65.
- Committee for Medicinal Products for Human Use. Guideline on bioanalytical method validation. European Medicines Agency (EMA); 2012.
- FDA U. Bioanalytical method validation guidance for industry. US Department of Health and Human Services, Food and Drug Administration, Center for Drug Evaluation and Research (CDER), Center for Veterinary Medicine (CVM), Biopharmaceutics; 2018. p. 1-44.
- Simpson NJK. Solid-Phase Extraction: Principles, techniques and applications. Florida: CRC Press; 2000.
