- *Corresponding Author:
- A. P. Pawar
Department of Pharmaceutics, Poona College of Pharmacy, Bharati Vidyapeeth (Deemed to be University), Erandwane, Pune, Maharashtra 411038, India
E-mail: atmaram.pawar@bharatividyapeeth.edu
| Date of Received | 02 August 2022 |
| Date of Revision | 03 July 2023 |
| Date of Acceptance | 18 January 2024 |
| Indian J Pharm Sci 2024;86(1):87-99 |
This is an open access article distributed under the terms of the Creative Commons Attribution-NonCommercial-ShareAlike 3.0 License, which allows others to remix, tweak, and build upon the work non-commercially, as long as the author is credited and the new creations are licensed under the identical terms
Abstract
The present study investigated the formulation development of functional oils such as linseed oil, almond oil, and walnut oil and their comparative evaluation for permeation enhancement. Pre-formulation studies like solubility study and emulsification study were performed for selecting microemulsion components. The microemulsion region was obtained by generating pseudo ternary phase diagrams. The final formulations were selected by the OFAT model and characterized for appearance, globule size, polydispersity index, zeta potential, drug content, dilution potential, centrifugation stability, and pH. Furthermore, In vitro dissolution and Ex vivo permeation studies were performed. All final formulations were found colourless, clear and transparent without phase separation or precipitation. All formulations showed mean globule size below 20 nm, polydispersity index less than 0.1, and exhibited zeta potential of -30 mV. All formulations showed drug content greater than 97 % and pH in the range of 5-6. The In vitro drug release study showed 89.12 %, 91.06 % and 101.21 % drug release by linseed oil, almond oil and walnut oil-loaded microemulsions respectively whereas pure drug solution exhibited 103.48 % drug release at the end of 6 h. The drug release from all three formulations was best fitted into the Higuchi model whereas plain drug fitted into the Hixson Crowell model. An Ex vivo permeation study revealed that all formulations showed higher steady state flux than the drug solution with ~1.25 fold enhancement. The study concluded that the use of functional oils significantly improved permeation and drug release which can further improve bioavailability upon in vivo assessment in the suitable animal models.
Keywords
Microemulsion, polyunsaturated fatty acids, rizatriptan benzoate, functional microemulsion, flaxseed oil, almond oil, walnut oil, In vitro-Ex vivo correlation
The burden of non-communicable and injuryrelated neurological diseases is increasing in India. Non-communicable neurological diseases (stroke, migraine, epilepsy, cerebral palsy, Alzheimer's disease, dementia, brain cancer, Parkinson's disease, multiple sclerosis, motor neuron diseases, and other neurological disorders, etc.) increased their contribution to total Disability-Adjusted Life Years (DALYs) in India from 4 % in 1990 to 8.2 % in 2019 and will continue to increase further. However, communicable neurological disorders (encephalitis, meningitis, and tetanus) dropped their contribution from 4.1 %-1.1 % in 2019. Injury-related neurological diseases accounted for 0.6 % of total DALYs in 2019, compared to 0.2 % in 1990. The fraction of total DALYs attributable to all neurological illnesses (comprising communicable, non-communicable and injuryrelated disorders) increased slightly from 8.3 % in 1990 to 9.9 % in 2019 in India[1]. Everyday risk factors such as stress, lack of physical activity, poor nutrition, obesity, high plasma cholesterol levels, smoking, drinking, or may have a role in the relatively high prevalence of neurodegenerative disorders. The development, severity and duration of neurodegenerative illnesses are influenced by variable lifestyle factors as well as certain inherent factors including aging, neuro-inflammation, brain damage and oxidative stress[2]. Diets heavy in sugar, saturated fats, or calories, on the other hand are thought to be harmful to brain function because they increase oxidative stress and decrease synaptic plasticity and cognitive functioning[3].
Central Nervous System (CNS) disorders are the major cause of death in the world[4]. The most common CNS disorders comprising of are Alzheimer’s disease, Parkinson’s disease, schizophrenia, epilepsy, migraine, depression, multiple sclerosis, etc. Many drugs have been approved by Food and Drug Administration (FDA) are currently available for the treatment of these CNS ailments and neurological disorders[5-8]. Treatments using these FDA approved drugs relieve symptomatically being unable to cease the disease progression, especially in neurodegenerative disorders[9]. These drawbacks of current therapy generate the need and necessity for newer and more effective therapeutic approaches.
One of the major hurdles in transporting drugs to the CNS is the Blood-Brain Barrier (BBB). It prevents the entry of drugs required for the treatment of CNS disorders[10]. Many researchers investigated various strategies for enhancing the delivery of drugs to the brain by overcoming BBB. These approaches include temporally tight junction opening[11], endogenous receptor-mediated endocytosis[12], carrier-mediated endocytosis[13], inhibition of efflux pumps[14], adsorptive-mediated transcytosis [15], convection-enhanced diffusion[16] and the use of prodrugs[17].
Various nano-formulations such as Nanostructured Lipid Carriers (NLC)[18-20], self-microemulsifying drug delivery system[21], self-nanoemulsifying drug delivery systems[22], nanoemulsion[23-26], microemulsion[27], can incorporate different oils as a bioactive molecule or as an excipient. Nevertheless, microemulsion could be preferred based on several advantages such as thermodynamically stable, require minimum energy, ease of preparation, ability to incorporate both hydrophilic and lipophilic drugs, ability to incorporate oils and protect it from external factors like temperature, pH, dilution, etc.,[28], enhancement in solubility and rate of absorption[29,30]. The thermodynamic stability of micro emulsion could be attributed to negative free energy attained by decreasing surface tension at interface and build due to positive effects of both surfactants and co-surfactants.
Several studies revealed that Poly Unsaturated Fatty Acid (PUFA) oils containing ω-3 fatty acids improve neurotransmission[31,32], synaptic plasticity[33], membrane fluidity, reduce oxidative stress[34-36], increases nerve growth[37], increases cerebral flow, decreases inflammatory mediators and their synthesis[38,39]. PUFA rich oils used in various diseases such as Alzheimer disease[40], Parkinson’s disease[41], schizophrenia[42], cancer[43], ischemia[44], epilepsy[45], multiple sclerosis[46,47]. Various mechanisms are proposed for brain PUFA uptake like endocytosis of PUFA containing lipoprotein particles followed by hydrolysis to liberate PUFA[48], passive diffusion of albuminbound unesterified PUFA via flip-flop mechanism or transporters, lipoprotein lipase mediated PUFA uptake[49], albumin-bound lysophosphatidylcholine uptake[50]. Dietary oils, which are known since ancient times, like Linseed Oil (LO), Almond Oil (AO), and Walnut Oil (WO) have a significant effect on brain performance and health. Also, endogenous receptors help in transporting these oils to the brain[51]. Furthermore, researchers have also explored the effect of these oils in vivo on improving memory, brain health, and cognitive behavior. A recent study on micro emulsion containing flaxseed oil showed enhancement in bioavailability and brain distribution and improve docosahexaenoic acid levels[52-54]. Higher intake of WO was associated with improved processing speed, cognitive flexibility and the memory[55-58]. AO supplementation improves antioxidant defenses and decreases oxidative damage in humans. Also, elevate the acetyl choline level in the brain and ultimately improve memory[59-61]. In brief, these previously mentioned oils have great potential in assisting brain targeting by the development of platform technology for delivering drugs to the brain.
The objective of this study was the development of PUFA containing oil (like LO, AO, and WO) loaded oral microemulsions, In vitro characterization, and Ex vivo permeability evaluation. Rizatriptan benzoate (RB) was used as a prototype drug. Initially, pre-formulation studies like solubility, emulsification study and construction of pseudo ternary phase diagram were performed. The formulations were developed using the OFAT model. The developed formulations were compared based on the In vitro drug release and Ex vivo permeability. However, further part of studies like pharmacokinetic study and pharmacodynamics assessment is going on and are under the scope of another manuscript.
Materials and Methods
RB was obtained as a gift sample from Zim Laboratories Limited, Nagpur. Capmul MCM (CO), Captex 300, Captex 355, and Captex 8000 were obtained as a gratis sample from Abitec Corporation, India. AO and LO were obtained as gift samples from K. K. Enterprise, Surat and Prano Flax (India) Pvt. Ltd., Jaipur, respectively. WO was purchased from Lakadi Ghana, Pune, India. Kolliphor EL (KEL) was obtained as a generous gift sample from BASF Limited, India. Transcutol P (TP) (Diethylene glycol monoethyl ether) and Labrasol ALF were gifted by Gattefosse (Mumbai, India). Tween 80, Tween 20, Ethanol, and Polyethylene Glycol (PEG) 400 were purchased from SD Fine Chemicals Ltd, India. All other chemicals used were of analytical grade.
Solubility study:
Saturation solubility of RB was determined by adding an excess amount of RB into a specific volume of oils (LO, WO, AO, Capmul MCM, Captex 300, Captex 355, Captex 8000), surfactants (Tween 80, Tween 20, Kolliphor EL and Labrasol) and co-surfactants/solubilizers (Ethanol, Transcutol P, Glycerol and PEG 400) in Eppendorf tubes. Eppendorf tubes were vortexed for 15 min and kept for attaining equilibrium at 37°±1° in a shaker bath for 48 h. The samples were centrifuged (Centrifuge 5424 R) at 12 000 rpm for 15 min to separate the undissolved drug. The supernatant was collected and diluted suitably with methanol which was further analyzed by using a Ultra-violet (UV) spectrophotometer (V-630, Jasco, Easton, USA) at λmax 227 nm.
Emulsification study:
The screening of surfactants and co-surfactants was done based on their emulsification efficiency and solubility of RB. The study was performed as per the reported method[27,62]. The oils were mixed with the surfactants and co-surfactants in 1:1:0 and 1:0.5:0.5 v/v ratios for Surfactant Emulsification study (SE) and Co-Surfactant Emulsification study (CSE). These mixtures were vortexed for 15 min and sonicated for 10 min. The samples were kept overnight for stabilization. Samples with phase separation were excluded. The remaining samples were further diluted 1000 times with distilled water and mixed by repeated inversions until the formation of uniform dispersion. The presence of larger oil globules was also considered phase separation and samples were excluded from the study. The dilutions were allowed to stabilize for 2 h and percentage Transmittance (% T) was measured at 650 nm using a UV spectrophotometer against water as a blank. All samples were prepared in triplicates.
Construction of pseudo ternary phase diagrams:
Pseudo ternary phase diagrams were constructed to determine the proportion of components giving microemulsion region and their effect on the globule size of ME[63]. The water titration method was used for constructing Pseudo ternary phase diagrams. Transcutol P and ethanol as cosurfactants and Kolliphor EL as a surfactant were selected for this study. Different weight ratios of Surfactants:Co-Surfactants (S:CoS) as 1:1, 2:1, and 3:1 were taken, vortexed for 15 min and kept overnight for stabilization and removal of bubbles. Oil and S:CoS mixture were mixed at different proportions (1:9, 2:8, 3:7, 4:6, 5:5, 6:4, 7:3, 8:2 and 9:1) (v/v) in glass test tubes. Water was added to the above mixture as aliquots until the turbidity was observed as an endpoint. The volume of water added was recorded. The values were given to software (TriDraw software, Version 2.6) as an input to construct the pseudo ternary phase diagrams.
Effect of oil concentration and Smix concentration on globule size:
The effect of oil concentration on globule size was determined by formulating different Micro Emulsion (ME) batches with varying oil concentrations from 5 %-25 % keeping Smix concentration constant at 60 % and water was added to produce 100 %. For determining the effect of Smix concentration, different MEs were prepared by varying Smix concentrations from 50 %-70 % keeping oil concentration fixed at 10 % and water to produce 100 %. These formulations were diluted 100 times using distilled water and their globule size was determined by a nanoparticle analyzer (SZ-100 Nanopartica, Horiba Scientific, India). All samples were prepared in triplicates.
Formulation of RB loaded ME:
Different RB-loaded MEs were prepared by mixing all the components. Initially, oils were mixed with S:CoS and RB was incorporated at a dose of 10 mg/ ml of the final formulation followed by mixing for 15 min. After complete solubilization of RB, water was added, mixed for 15 mins, and kept overnight for stabilization. We have kept the overall same of composition of MEs as 20 % oil, 60 % Smix and remaining 20 % Water for evaluating the effect of oils in further study. MEs comprising oil almond oil, LO and WO were denoted by RB-AO-ME, RBLO- ME, and RB-WO-ME respectively.
In vitro characterization:
The final formulation was characterized for appearance, globule size, Polydispersity Index (PDI), zeta potential, drug content, saturation solubility of RB, pH and stability to dilution and centrifugation.
Appearance: The final MEs were visually observed for an appearance like color and transparency.
Centrifugation study: Final ME formulations were centrifuged at 6000 ×g for 15 min and observed for phase separation.
Dilution potential: Final ME formulations were diluted 100 times with double distilled water and kept for 48 h. After 48 h, the samples were checked for visual signs of precipitation and phase separation.
Globle size, PDI and zeta potential: Globule size, PDI, and zeta potential of final ME formulations were determined by using a nanoparticle analyzer (SZ-100 Nanopartica, Horiba Scientific, India). All the ME formulations were suitably diluted with distilled water. All measurements were carried out at a temperature of 25° and in triplicates.
Drug content: The drug content was determined by the RP-HPLC method. The HPLC system consisted of a pump, UV detector, and Pearless C18 column (250 mm×4.6 mm, 5 μ, Chromatopak, India). The mobile phase was composed of water (adjusting to pH 3 with 85 % phosphoric acid) and acetonitrile (85:15, v/v). The flow rate was set at 1 ml/min at 25° with a run time of 10 min. The elution was monitored at 225 nm wavelength using a UV detector (Jasco UV 1575). Final MEs were diluted suitably using methanol and centrifuged at 10 000 rpm for 15 min. The supernatant was injected into the HPLC system analysed at λmax 225 nm.
Measurement of pH: The pH of final ME formulations was determined using a digital pH meter (Toshniwal Process instruments Pvt. Ltd) at room temperature. The solutions (1 % and 5 % v/v) of final MEs in distilled water were prepared for pH determination. The study was performed in triplicates.
In vitro drug release study:
The release of RB from all ME formulations was determined by using the dialysis bag method with modifications[64]. Briefly, the dialysis membranes were activated in phosphate buffer pH 7.4 for 12 h before the experiment. One end of each membrane was tightly tied using thread. The pure drug dispersed in phosphate buffer (5 mg) and ME formulations (equivalent to 5 mg) were transferred to dialysis bag prepared. Other ends of the membrane were tied tightly with thread to prepare the sac. The sacs were immersed in the dissolution vessels of the United States Pharmacopeia Type II dissolution apparatus (Electrolab dissolution apparatus) containing 500 ml of phosphate buffer pH 7.4, maintained at a temperature of 37°±1° with a constant stirring speed of 100 rpm. Aliquots were withdrawn from dissolution media at predetermined time intervals (0, 5, 15, 30, 60, 120, 240 and 360 min) and replaced with the same volume of fresh medium to maintain the sink condition. Aliquots were analyzed using a UV spectrophotometer at λmax 225 nm.
Ex vivo permeability study:
Ex vivo permeation study of RB-loaded ME formulations and RB solution was carried out by using the non-everted gut sac method[27]. Approximately 5 cm long intestinal tracts with an internal diameter of 0.5 cm were cut to prepare the intestinal sacs. Sacs were washed using Krebs- Ringer Phosphate buffer saline solution pH 7.4. Each sac was tied tightly with a thread at one end and filled with RB solution (containing 2.5 mg RB) or ME formulations (equivalent to 2.5 mg RB) in each sac using a micropipette and tied with thread. Each sac was placed in dissolution vessel containing 250 ml of Krebs-Ringers Phosphate buffer saline solution pH 7.4 [sodium chloride (0.67 %, w/v), potassium chloride (0.034 %, w/v), magnesium sulphate (0.059 %, w/v), calcium chloride (0.011 %, w/v), sodium dihydrogen phosphate (0.234 %, w/v) and glucose (0.18 %, w/v) in distilled water] maintained at 37°±1° at 50 rpm[65]. Aliquots were taken at time intervals of 5, 15, 30, 45, 60, 120, 180 and 240 min and replaced with fresh Krebs Ringer’s phosphate buffer saline solution pH 7.4. Samples were analysed by using a UV spectrophotometer at a detection wavelength of 225 nm. The cumulative amount of RB permeated per unit area (mg/cm2) was calculated. The steadystate flux (Jss) (mg/cm2h) was calculated[66]. The experiment was performed in triplicate for statistical significance.
Statistical analysis:
All results are reported as mean±standard deviation (n=3). For statistical data analysis GraphPad Prism 8 (San Diego, CA, USA) was used. Statistically significant differences between permeation results were determined using one-way Analysis of Variance (ANOVA) at the level of p<0.05 considered significant.
Results and Discussion
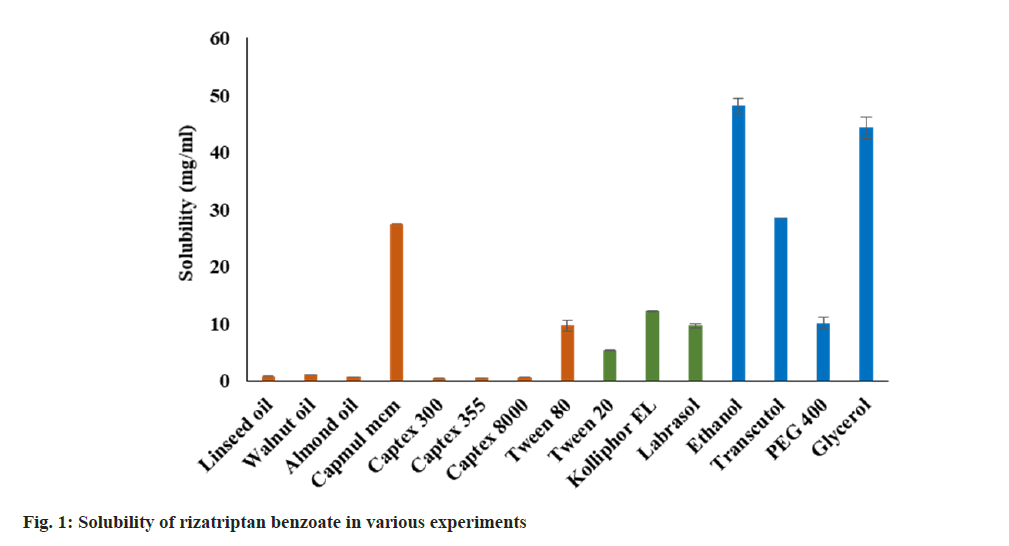
The saturation solubility of RB in various oil, surfactants, and co-surfactants/solubilizers was determined and depicted in fig. 1. Amongst all oils, RB showed the highest solubility in Capmul MCM (~27 mg/ml). Furthermore, the solubility in remaining oils was found to be less than 2 mg/ml including functional oils such as LO (0.8529 mg/ ml), WO (1.1275 mg/ml), and AO (0.7176 mg/ml). The solubility of RB in surfactants was found in the range of 5 to 12 mg/ml. The decreasing order of solubility as Kolliphor EL>Labrasol>Tween 80>Tween 20. Ethanol and glycerol showed the highest solubility of the RB (>40 mg/ml) amongst all excipients used. The decreasing order of solubility of RB in co-surfactants was observed as Ethanol>Glycerol>Transcutol P>PEG 400. However, the selection of components was done based emulsification study.
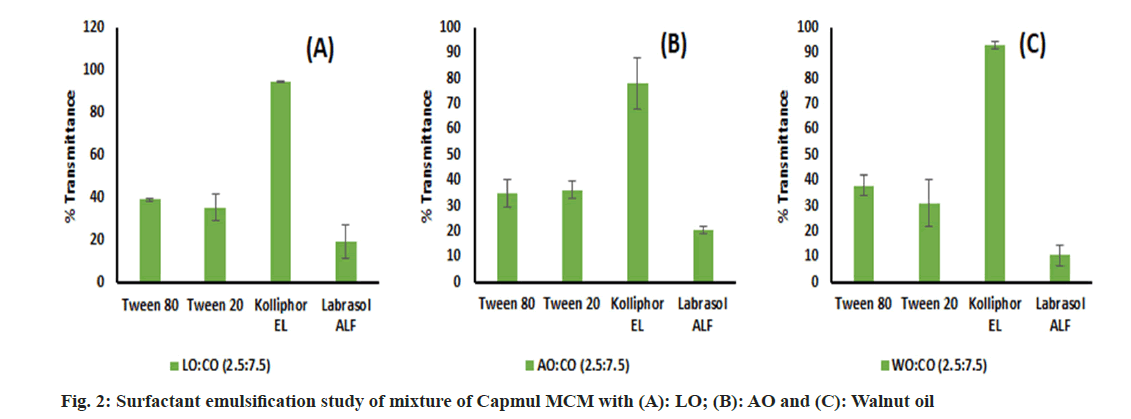
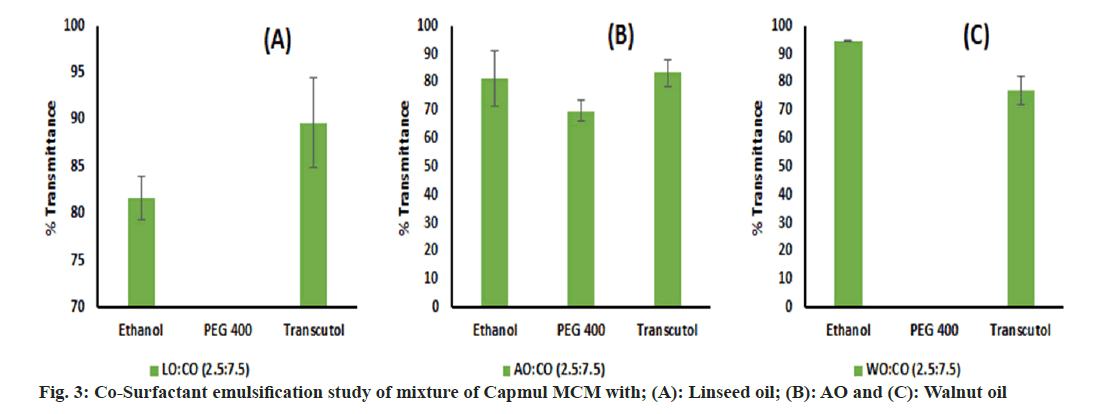
An emulsification study was performed and we have found that LO, WO and AO alone were very difficult to emulsify with surfactant. This may be due to the inability of surfactants to enter into long chains of oil which leads to poor emulsification[67]. Hence, these oils were blended with Capmul MCM in different ratios of 1:1, 2.5:7.5 and 1:9 v/v, and an emulsification study was performed again. Though the oil blend comprising a 1:1 volume ratio has showed phase separation with surfactants, the remaining blends were successfully emulsified by surfactants. Labrasol ALF showed poor emulsification potential with all oils. Kolliphor EL performed well and emulsified oils to a greater extent than other surfactants (fig. 2). However, intending to keep a greater proportion of oil in the end product, we decided to go ahead with the 2.5:7.5 ratio for further studies which is denoted by the oil blend concerning all oils. Based on SE, Kolliphor EL was selected for CSE. Though glycerol has shown good solubility of the drug, it was inefficient for supporting and improving the emulsification by Kolliphor EL and shown phase separation in all oil blends. Similarly, PEG 400 was found inefficient in emulsifying WO and LO but emulsified AO well. Ethanol and Transcutol P were found to be emulsifying all oil blends to a greater extent than other co-surfactants (fig. 3). For further study, Kolliphor EL was selected as a surfactant while Transcutol P was a cosurfactant based on their emulsification potential. Additionally, the P-gP efflux inhibition shown by Transcutol P and Kolliphor EL could be beneficial for enhancing drug transport and improving brain targeting[68,69].
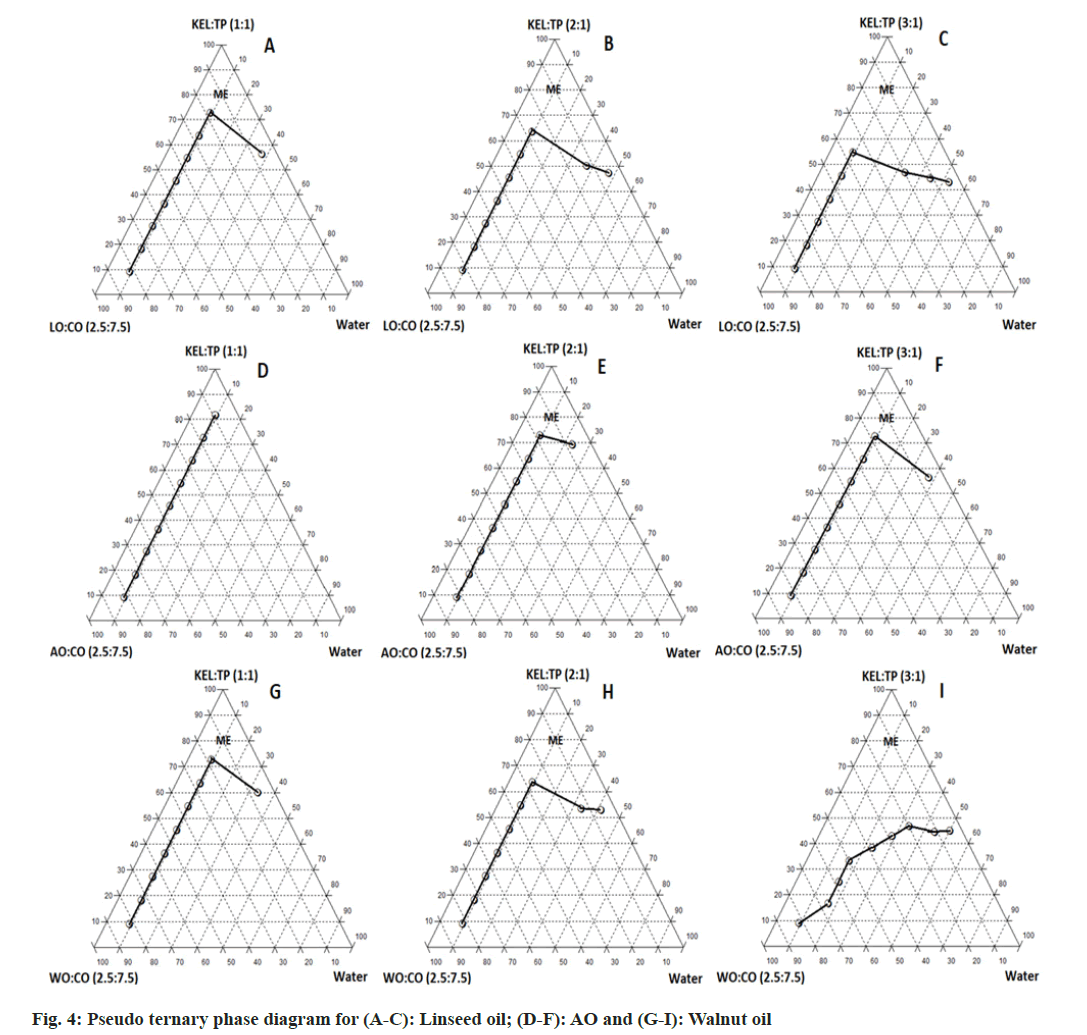
Pseudo ternary phase diagrams were constructed to identify the microemulsion region and to optimize the concentration of selected components for final formulation. It was observed that the microemulsion region increased with an increasing ratio of S:CoS from 1:1 to 3:1 (w/w) as depicted in fig. 4. This can be attributed to the higher amount of surfactant available in the system for emulsifying the oil efficiently[27]. Transcutol P as co-surfactant showed a greater microemulsion area as compared with the Ethanol. This is due to the role of medium chain length alcohols (Transcutol P), which can improve the flexibility of the hydrocarbon tail while also allowing for greater oil penetration into the hydrocarbon area[70]. Additionally, it was observed that AO showed less microemulsion region as compared with LO and WO. The pseudo ternary phase diagram with a 3:1 w/w ratio of S:CoS revealed a greater ME region and hence it was selected for further studies.
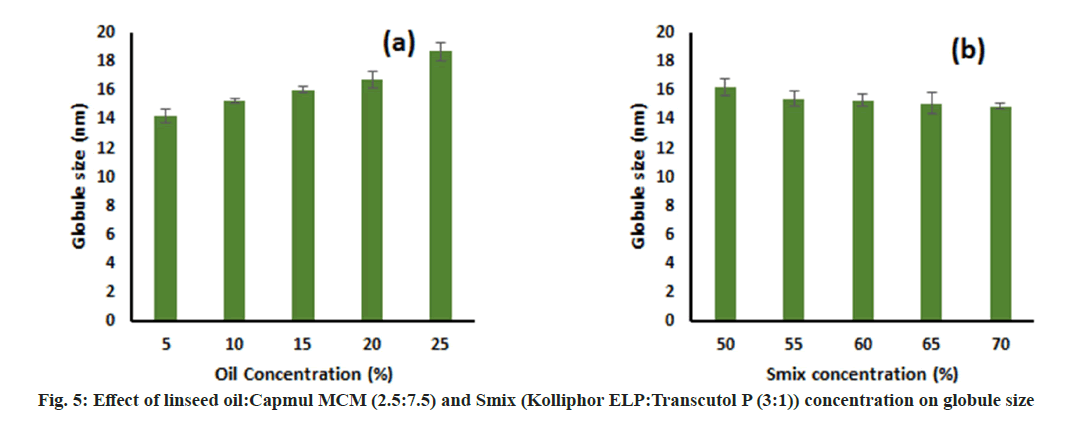
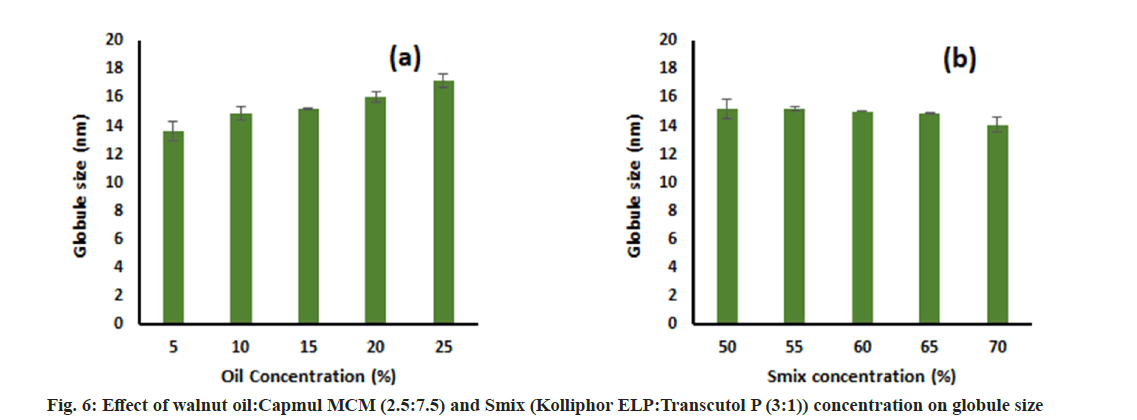
This study was performed to determine the effect of oil concentration and S:CoS concentration on the globule size of the final formulation. The effect was assessed by changing one factor at a time. It was observed that an increase in the oil concentration led to an increase in globule size and vice versa keeping S:CoS concentration constant (fig. 5a and fig. 6a). Furthermore, a decrease in globule size was observed upon increasing the S:CoS concentration constant (fig. 5b and fig. 6b). However, the increase or decrease in globule size was not that much variable, and hence the higher oil loading with appropriate S:CoS concentration was considered as final formulated which further might not need optimization. Based on these studies the composition of the final formulation was finalized, prepared as mentioned in the methods, and characterized further.
All formulations were found to be colorless, clear, and transparent. The globule size of both blank and drug-loaded formulations was below 20 nm which is desired for improved transport across biological membrane and brain targeting[69]. Drug loading did not significantly change the globule size and PDI. A lower PDI value was observed for all formulations which indicated the uniformity of globule size. No phase separation, signs of precipitation or visual changes were observed upon centrifugation as well as dilution. All the formulations have shown good solubility of RB (>50 mg/ml). The globule size, PDI, zeta potential, drug content, saturation solubility, and pH of all formulations is presented in Table 1.
| S No. | Formulation | Globule size (nm) | PDI | Zetapotential (mV) | Drugcontent | Saturation solubility (mg/ml) | pH |
|---|---|---|---|---|---|---|---|
| 1 | RB-LO-ME | 17.13±0.15 | 0.057±0.01 | -30.13±0.85 | 97.28±1.38 | 68.20±2.78 | 6.13±0.01 |
| 2 | RB-AO-ME | 17.03±0.30 | 0.078±0.02 | -29.53±0.70 | 97.70±0.94 | 70.27±0.45 | 6.20±0.01 |
| 3 | RB-WO-ME | 16.63±0.05 | 0.062±0.02 | -30.10±0.91 | 98.03±1.40 | 98.96±2.48 | 5.99±0.08 |
Table 1: Globule Size, Pdi, Zeta Potential, Saturation Solubility and Ph of Formulations
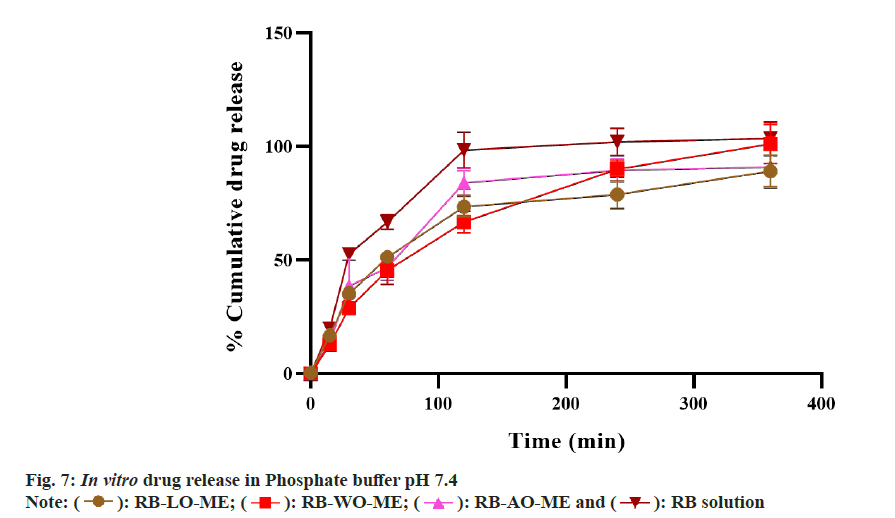
In vitro drug release study was performed to evaluate the drug release from the formulations. The release profile of RB from all formulations and drug solution in phosphate buffer pH 7.4 is shown in fig. 7. All formulations showed a higher drug release that can be attributed to the higher solubility of the drug in aqueous media. RB-LOME, RB-AO-ME, RB-WO-ME, and RB solution showed 89.18±6.88 %, 91.12±9.3%, 101.23±8.61 %, and 103.50±7.28 % drug release at the end of 6 h respectively. Initial faster drug release followed by a slower rate of drug release was observed. In the first hour, approximately 50 % drug was released from all formulations whereas 66.80±3.07 % drug released from drug solution. All three formulations exhibited sustained drug release when compared to pure drug solution. The data obtained from the In vitro drug dissolution study was fitted into different kinetic models such as zero order, first order, Higuchi, Korsmeyer- Peppas and Hixson Crowell model and drug release kinetic correspond to drug-loaded formulations was depicted in Table 2. The regression coefficients of all formulations were compared. The results revealed that all formulations followed the Higuchi model whereas plain drug solution was fitted into the Hixson Crowell model. In ME formulations, the drug diffuses from the internal phase (globules) to a continuous medium before crossing through the membrane. Drug release from formulation follows the Higuchi model i.e from matrix systems due to the higher surfactant concentration and higher viscosity[71]. The ME formulations were compared with plain drug solution for drug release profile and the similarity factor (f2) was calculated. The f2 value was found to be 41, 46, and 37 for RB-LO-ME, RB-AO-ME, and RBWO- ME respectively which indicated that the drug release from the optimized formulations was different than release from plain drug solution. No significant differences were observed in the release behavior of all ME formulations which may be due to a similar composition comprising the same excipients and drug. The rate of drug release from the microemulsions was slower than that of the plain drug solution (Table 3). RB, being a hydrophilic drug, dissolves and releases drug faster as compared to its microemulsion formulation, wherein, the oil phase acted as a reservoir for the drug and retarded the drug release due to its association with surfactant and drug. This association could lead to slower drug release observed from microemulsion formulation than the drug solution.
| Formulation | Zero order | First order | Higuchi model | Korsemeyer Peppas | Hixson crowell |
|---|---|---|---|---|---|
| RB-LO-ME | 0.7791 | 0.8983 | 0.9400 | 0.8772 | 0.8926 |
| RB-AO-ME | 0.7493 | 0.8735 | 0.9123 | 0.9016 | 0.836 |
| RB-WO-ME | 0.8906 | 0.9725 | 0.9852 | 0.9279 | 0.9499 |
| RB Solution | 0.6853 | 0.8054 | 0.8816 | 0.8562 | 0.9329 |
Table 2: Drug Release Kinetics Model Fitting
| Time (min) | Drug release (%) | Cumulative drug permeated (%) | ||||||
|---|---|---|---|---|---|---|---|---|
| RB-LO-ME | RB-AO-ME | RB-WO-ME | RB | RB-LO-ME | RB-AO-ME | RB-WO-ME | RB | |
| 5 | 16.41±1.23 | 13.67±2.15 | 12.81±1.85 | 19.65±0.16 | 5.46±0.01 | 6.06±0.006 | 6.72±0.01 | 3.81±0.01 |
| 15 | 16.57± 1.24 | 13.80±2.17 | 12.94±1.86 | 19.84±0.16 | 5.57±0.01 | 6.18±0.01 | 6.86±0.01 | 3.88±0.02 |
| 30 | 35.20±2.59 | 38.70±11.49 | 28.90±0.23 | 52.74±1.89 | 18.69±0.04 | 18.79±0.04 | 19.07±0.04 | 11.51±0.03 |
| 60 | 51.25±1.93 | 46.80±5.68 | 45.51±6.20 | 66.80±3.07 | 40.93±0.09 | 40.60±0.07 | 41.36±0.13 | 34.98±0.06 |
| 120 | 73.61±4.84 | 84.00±5.39 | 66.83±4.77 | 98.46±7.90 | 54.33±0.10 | 54.43±0.07 | 54.98±0.11 | 44.71±0.08 |
| 240 | 78.98±6.16 | 89.57±5.03 | 90.02±3.66 | 102.0±6.25 | 65.71±0.08 | 66.71±0.10 | 68.49±0.10 | 51.59±0.03 |
Table 3: In Vitro Drug Release and Ex Vivo Permeation Study
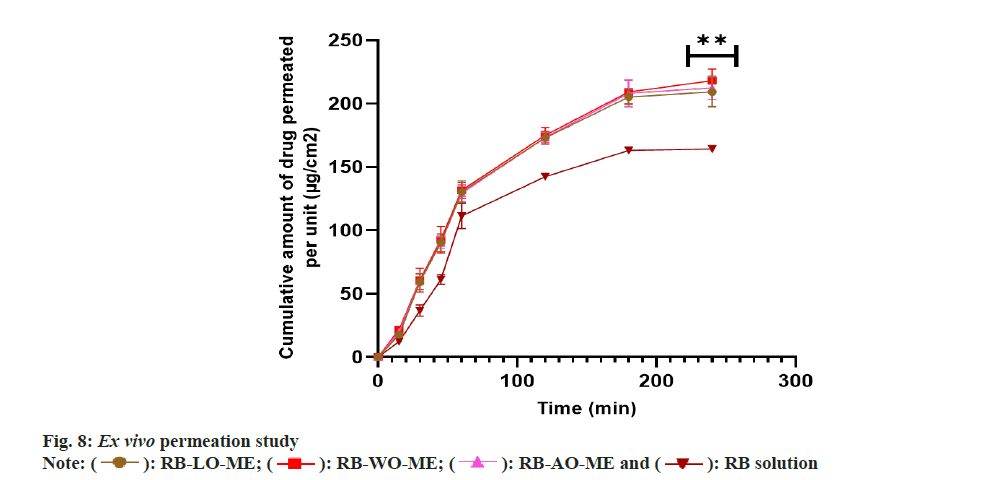
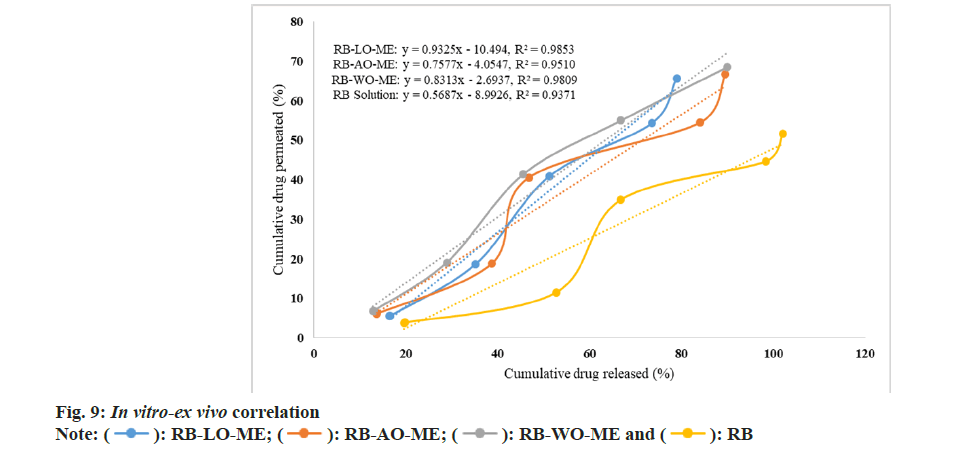
The Ex vivo permeability study was performed in a non-everted gut sac model using a goat intestine[72]. The permeation profile of all RB formulations and solution showed in fig. 8. Optimized ME formulations RB-LO-ME, RB-AO-ME, and RB-WO-ME showed higher steady-state flux 0.881±0.030 μg/cm2h-1, 0.893±0.039 μg/cm2h-1, and 0.9063±0.025 μg/cm2h-1 respectively than RB solution 0.716±0.018 μg/cm2h-1. Enhancement in the flux of RB-LO-ME, RB-AO-ME, RB-WOME was observed as 1.23, 1.25, and 1.27 folds respectively as compared with the RB solution. The results revealed that significant (p<0.05) enhancement in the flux from all ME formulations when compared with pure drug solution. Also, all three formulations had shown more than 65 % drug release whereas the pure drug solution has about 51 % drug release at the end of 4 h. The system components also exhibit properties like inhibition of P-gP efflux pump by Kolliphor EL and Transcutol P that could lead to enhancement in permeability along with other multiple factors like smaller globule size[68,69,72], lipophilic nature of the microemulsions, etc.,[73]. When compared with in vitro drug release, it was observed that though RB solution exhibited the highest drug release, the flux exhibited by the same was the lowest. The improvement in permeability concerning to slower drug release can be attributed to the use of functional components which can assist transportation across the biological membrane. Furthermore, upon generating In vitro-Ex vivo correlation by plotting cumulative drug release (%) vs cumulative drug permeated (%), we observed a more linear behavior of all ME formulations over RB solution based on the regression coefficient (fig. 9). RB-LO-ME and RB-WO-ME exhibited R2 greater than 0.98 whereas RB-AO-ME exhibited R2 around 0.95 as compared to RB solution (R2 of around 0.93). Here in this study, all the components were kept constant and oils were varied to check their influence on drug release as well as permeation. We observed that the WO exhibited better drug release and permeation followed by AO and LO. Nonetheless, this can be correlated with the PUFA content of the oil wherein WO comprised the highest percentage of PUFA (~70 %) which could help in transportation and improving permeation by the general pathways of absorption of PUFA oils[51]. The higher flux of formulations may be due to the higher content of fatty acids in PUFA oils and oil also act as a permeation enhancer[74,75]. Fatty acids improve the permeability of hydrophilic drugs via dilating tight junctions and altering the cytoskeleton of intestinal epithelial cells. Permeability increases may be due to the excipients properties such as Kolliphor EL disrupting the intestinal barrier and Transcutol P altering the intestinal membrane fluidity[76,77]. This sustained drug release with improved permeation could further help in achieving the enhanced bioavailability followed by drug delivery to the brain based on the fact that BBB has unique transporters for PUFA which can help in achieving brain targeting for CNS ailments[51]. Nevertheless, the findings need to be assessed in suitable animal models.
In the present study, we have developed three micro emulsions comprising three different functional oils named LO, almond oil, and WO respectively. Initially, the components were screened based on the pre-formulation studies comprising of solubility study, emulsification study, and generation of the pseudo ternary phase diagram. Further, the effect of Smix concentration and oil concentration was determined by changing one factor at a time and the final composition of the formulations was determined. Furthermore, the formulations were characterized for globule size, PDI, zeta potential, pH, drug content, and stability to centrifugation and dilution. The final formulation showed globule size below 25 nm which can help in proving the transport of drug across the cell membrane. In vitro drug release was performed which showed that all the formulations were following the Higuchi model whereas pure drug was following the Hixson Crowell model for drug release. Ex vivo permeation revealed improvement in flux when compared with pure drug. In vitro and Ex vivo correlation revealed that all ME formulations exhibited a more linear correlation than the pure drug solution. The main aim of this study was to develop functional micro emulsions for improving the permeation of drug. This study revealed the great potential of developed micro emulsions for improving dissolution as well as permeation which is one of the requirements for improving bioavailability.
Acknowledgments:
Authors are thankful to Zim Laboratories Limited, Nagpur, Abitec Corporation, India, K. K. Enterprise, Surat and Prano Flax (India) Pvt. Ltd., Jaipur, BASF, Gattefosse for providing gift samples for research.
Conflict of interests:
The authors declared no conflict of interests.
References
- Singh G, Sharma M, Kumar GA, Rao NG, Prasad K, Mathur P, et al. The burden of neurological disorders across the states of India: The global burden of disease study 1990–2019. Lancet Global Health 2021;9(8):e1129-44.
[Crossref] [Google Scholar] [PubMed]
- Popa-Wagner A, Dumitrascu DI, Capitanescu B, Petcu EB, Surugiu R, Fang WH, et al. Dietary habits, lifestyle factors and neurodegenerative diseases. Neural Regen Res 2020;15(3):394.
[Crossref] [Google Scholar] [PubMed]
- Gomez-Pinilla F, Gomez AG. The influence of dietary factors in central nervous system plasticity and injury recovery. PM R 2011;3(6):S111-6.
[Crossref] [Google Scholar] [PubMed]
- Bergen DC, Silberberg D. Nervous system disorders. Arch Neurol 2009:59:1194-6.
- Poovaiah N, Davoudi Z, Peng H, Schlichtmann B, Mallapragada S, Narasimhan B, et al. Treatment of neurodegenerative disorders through the blood–brain barrier using nanocarriers. Nanoscale 2018;10(36):16962-83.
[Crossref] [Google Scholar] [PubMed]
- Perucca P, Scheffer IE, Kiley M. The management of epilepsy in children and adults. Med J Aust 2018;208(5):226-33.
[Crossref] [Google Scholar] [PubMed]
- Bross M, Hackett M, Bernitsas E. Approved and emerging disease modifying therapies on neurodegeneration in multiple sclerosis. Int J Mol Sci 2020;21(12):4312.
[Crossref] [Google Scholar] [PubMed]
- Diener HC, Holle-Lee D, Nägel S, Dresler T, Gaul C, Göbel H, et al. Treatment of migraine attacks and prevention of migraine: Guidelines by the German migraine and headache society and the German society of neurology. Clin Transl Neurosci 2019;3(1):1-40.
- Hanif S, Muhammad P, Chesworth R, Rehman FU, Qian RJ, Zheng M, et al. Nanomedicine-based immunotherapy for central nervous system disorders. Acta Pharmacol Sin 2020;41(7):936-53.
[Crossref] [Google Scholar] [PubMed]
- Pardridge WM. Drug transport across the blood–brain barrier. J Cerebral Blood Flow Metab 2012;32(11):1959-72.
[Crossref] [Google Scholar] [PubMed]
- Alam MI, Beg S, Samad A, Baboota S, Kohli K, Ali J, et al. Strategy for effective brain drug delivery. Eur J Pharm Sci 2010;40(5):385-403.
[Crossref] [Google Scholar] [PubMed]
- Hossain S, Akaike T, Hoque Chowdhury E. Current approaches for drug delivery to central nervous system. Curr Drug Deliv 2010;7(5):389-97.
[Crossref] [Google Scholar] [PubMed]
- Misra A, Ganesh S, Shahiwala A, Shah SP. Drug delivery to the central nervous system: A review. J Pharm Pharm Sci 2003;6(2):252-73.
[Google Scholar] [PubMed]
- Sadeque AJ, Wandel C, He H, Shah S, Wood AJ. Increased drug delivery to the brain by P‐glycoprotein inhibition. Clin Pharmacol Ther 2000;68(3):231-7.
[Crossref] [Google Scholar] [PubMed]
- Lu W. Adsorptive-mediated brain delivery systems. Curr Pharm Biotechnol 2012;13(12):2340-8.
[Crossref] [Google Scholar] [PubMed]
- Zhang C, Nance EA, Mastorakos P, Chisholm J, Berry S, Eberhart C, et al. Convection enhanced delivery of cisplatin-loaded brain penetrating nanoparticles cures malignant glioma in rats. J Control Release 2017;263:112-9.
[Crossref] [Google Scholar] [PubMed]
- Wiggins JB, Rajapakse R. Balsalazide: A novel 5-aminosalicylate prodrug for the treatment of active ulcerative colitis. Expert Opin Drug Metab Toxicol 2009;5(10):1279-84.
[Crossref] [Google Scholar] [PubMed]
- Bashiri S, Ghanbarzadeh B, Ayaseh A, Dehghannya J, Ehsani A, Ozyurt H. Essential oil-loaded nanostructured lipid carriers: The effects of liquid lipid type on the physicochemical properties in beverage models. Food Biosci 2020;35:100526.
- Fahmy UA, Ahmed OA, Badr-Eldin SM, Aldawsari HM, Okbazghi SZ, Awan ZA, et al. Optimized nanostructured lipid carriers integrated into in situ nasal gel for enhancing brain delivery of flibanserin. Int J Nanomed 2023;18:2253-4.
[Crossref] [Google Scholar] [PubMed]
- Huang J, Wang Q, Li T, Xia N, Xia Q. Nanostructured lipid carrier (NLC) as a strategy for encapsulation of quercetin and linseed oil: Preparation and in vitro characterization studies. J Food Eng 2017;215:1-2.
- Bindhani S, Mohapatra S, Kar RK. Preparation, characterization and stability studies of solid self-emulsifying drug delivery system of nifedipine. Int J Appl Pharm 2020;12(2):94–102.
- Sandhu PS, Beg S, Mehta F, Singh B, Trivedi P. Novel dietary lipid-based self-nanoemulsifying drug delivery systems of paclitaxel with p-gp inhibitor: Implications on cytotoxicity and biopharmaceutical performance. Expert Opin Drug Deliv 2015;12(11):1809-22.
[Crossref] [Google Scholar] [PubMed]
- Cunha S, Forbes B, Sousa Lobo JM, Silva AC. Improving drug delivery for Alzheimer’s disease through nose-to-brain delivery using nanoemulsions, Nanostructured Lipid Carriers (NLC) and in situ hydrogels. Int J Nanomed 2021;16:4373-90.
[Crossref] [Google Scholar] [PubMed]
- Mazonde P, Khamanga SM, Walker RB. Design, optimization, manufacture and characterization of Efavirenz-loaded flaxseed oil nanoemulsions. Pharmaceutics 2020;12(9):797.
[Crossref] [Google Scholar] [PubMed]
- Cui SX, Nie SF, Li L, Wang CG, Pan WS, Sun JP. Preparation and evaluation of self-microemulsifying drug delivery system containing vinpocetine. Drug Dev Ind Pharm 2009;35(5):603-11.
[Crossref] [Google Scholar] [PubMed]
- Li T, Huang J, Wang Q, Xia N, Xia Q. Resveratrol and linseed oil co-delivered in O/W nanoemulsions: Preparation and characterization. Integr Ferroelectr 2018;190(1):101-11.
- More SK, Pawar AP. Preparation, optimization and preliminary pharmacokinetic study of curcumin encapsulated turmeric oil microemulsion in zebra fish. Eur J Pharm Sci 2020;155:105539.
[Crossref] [Google Scholar] [PubMed]
- Momoh MA, Franklin KC, Agbo CP, Ugwu CE, Adedokun MO, Anthony OC, et al. Microemulsion-based approach for oral delivery of insulin: Formulation design and characterization. Heliyon 2020;6(3):e03650.
[Crossref] [Google Scholar] [PubMed]
- Muzaffar FA, Singh UK, Chauhan L. Review on microemulsion as futuristic drug delivery. Int J Pharm Pharm Sci 2013;5(3):39-53.
- Jha SK, Dey S, Karki S. Microemulsions-potential carrier for improved drug delivery. Asian J Biomed Pharm Sci 2011;1(1):5-9.
- Di Miceli M, Bosch-Bouju C, Laye S. PUFA and their derivatives in neurotransmission and synapses: A new hallmark of synaptopathies. Proceed Nutr Soc 2020;79(4):388-403.
[Crossref] [Google Scholar] [PubMed]
- Willis LM, Shukitt-Hale B, Joseph JA. Dietary polyunsaturated fatty acids improve cholinergic transmission in the aged brain. Genes Nutr 2009;4(4):309-14.
[Crossref] [Google Scholar] [PubMed]
- Dinel AL, Rey C, Bonhomme C, Le Ruyet P, Joffre C, Layé S. Dairy fat blend improves brain DHA and neuroplasticity and regulates corticosterone in mice. Prostaglandins, Leukotr Essent Fatty Acids 2016;109:29-38.
[Crossref] [Google Scholar] [PubMed]
- Taccone-Gallucci M, Manca-di-Villahermosa S, Battistini L, Stuffler RG, Tedesco M, Maccarrone M. N-3 PUFAs reduce oxidative stress in ESRD patients on maintenance HD by inhibiting 5-lipoxygenase activity. Kidney Int 2006;69(8):1450-4.
[Crossref] [Google Scholar] [PubMed]
- Meital LT, Windsor MT, Perissiou M, Schulze K, Magee R, Kuballa A, et al. Omega-3 fatty acids decrease oxidative stress and inflammation in macrophages from patients with small abdominal aortic aneurysm. Sci Rep 2019;9(1):12978.
[Crossref] [Google Scholar] [PubMed]
- Sanchez-Romero L, Pacheco-Moises FP, Mohammed EH, Mireles-Ramirez MA, Cruz-Serrano JA, Velazquez-Brizuela IE, et al. Effect of fish oil on oxidative stress markers in patients with probable Alzheimer's disease. Arch Latinoam Nutr 2020;70(2):123-33.
- Silva RV, Oliveira JT, Santos BL, Dias FC, Martinez AM, Lima CK, et al. Long-chain omega-3 fatty acids supplementation accelerates nerve regeneration and prevents neuropathic pain behavior in mice. Front Pharmacol 2017;8:723.
[Crossref] [Google Scholar] [PubMed]
- Oppedisano F, Macri R, Gliozzi M, Musolino V, Carresi C, Maiuolo J, et al. The anti-inflammatory and antioxidant properties of n-3 PUFAs: Their role in cardiovascular protection. Biomedicines 2020;8(9):306.
[Crossref] [Google Scholar] [PubMed]
- Joffre C, Rey C, Laye S. N-3 polyunsaturated fatty acids and the resolution of neuroinflammation. Front Pharmacol 2019;10:1022.
[Crossref] [Google Scholar] [PubMed]
- Lim GP, Calon F, Morihara T, Yang F, Teter B, Ubeda O, et al. A diet enriched with the omega-3 fatty acid docosahexaenoic acid reduces amyloid burden in an aged Alzheimer mouse model. J Neurosci 2005;25(12):3032-40.
[Crossref] [Google Scholar] [PubMed]
- Li P, Song C. Potential treatment of Parkinson’s disease with omega-3 polyunsaturated fatty acids. Nutr Neurosci 2022;25(1):180-91.
[Crossref] [Google Scholar] [PubMed]
- Hsu MC, Huang YS, Ouyang WC. Beneficial effects of omega-3 fatty acid supplementation in schizophrenia: Possible mechanisms. Lipids Health Dis 2020;19:1-7.
[Crossref] [Google Scholar] [PubMed]
- Abiri B, Vafa M. Dietary omega-3 polyunsaturated fatty acids and treatment of cancer. Adv Obes Weight Manag Control 2018;8(3):198-201.
[Google Scholar] [PubMed]
- Bu J, Dou Y, Tian X, Wang Z, Chen G. The role of omega-3 polyunsaturated fatty acids in stroke. Oxidative Med Cell Longev 2016;2016.
- Damodar R, Reddy S, Goyal MA, PB E. Flaxseed oi alone and as an adjuant with phenytoin in mes-induced seizure in albino rats. Asian J Pharm Clin Res 2018;11(2):329-32.
- Shinto L, Marracci G, Mohr DC, Bumgarner L, Murchison C, Senders A, et al. Omega-3 fatty acids for depression in multiple sclerosis: A randomized pilot study. PLoS One 2016;11(1):e0147195.
[Crossref] [Google Scholar] [PubMed]
- Healy-Stoffel M, Levant B. N-3 (Omega-3) fatty acids: Effects on brain dopamine systems and potential role in the etiology and treatment of neuropsychiatric disorders. CNS Neurol Disord Drug Target 2018;17(3):216-32.
[Crossref] [Google Scholar] [PubMed]
- Edmond J. Essential polyunsaturated fatty acids and the barrier to the brain: The components of a model for transport. J Mol Neurosci 2001;16:181-93.
[Crossref] [Google Scholar] [PubMed]
- Goldberg IJ, Eckel RH, Abumrad NA. Regulation of fatty acid uptake into tissues: Lipoprotein lipase-and CD36-mediated pathways. J Lipid Res 2009;50:S86-90.
[Crossref] [Google Scholar] [PubMed]
- Lagarde M, Bernoud N, Brossard N, Lemaitre-Delaunay D, Thiès F, Croset M, et al. Lysophosphatidylcholine as a preferred carrier form of docosahexaenoic acid to the brain. J Mol Neurosci 2001;16(2-3):201-4.
[Crossref] [Google Scholar] [PubMed]
- Liu JJ, Green P, Mann JJ, Rapoport SI, Sublette ME. Pathways of polyunsaturated fatty acid utilization: implications for brain function in neuropsychiatric health and disease. Brain Res 2015;1597:220-46.
[Crossref] [Google Scholar] [PubMed]
- Vyas TK, Shahiwala A, Amiji MM. Improved oral bioavailability and brain transport of Saquinavir upon administration in novel nanoemulsion formulations. Int J Pharm 2008;347(1-2):93-101.
[Crossref] [Google Scholar] [PubMed]
- Sugasini D, Lokesh BR. Rats given linseed oil in microemulsion forms enriches the brain synaptic membrane with docosahexaenoic acid and enhances the neurotransmitter levels in the brain. Nutr Neurosci 2015;18(2):87-96.
[Crossref] [Google Scholar] [PubMed]
- Sugasini D, Lokesh BR. Curcumin and linseed oil co-delivered in phospholipid nanoemulsions enhances the levels of docosahexaenoic acid in serum and tissue lipids of rats. Prostaglandins Leukot Essent Fatty Acids 2017;119:45-52.
[Crossref] [Google Scholar] [PubMed]
- Wang LM, Yi Y, Yao YL, Feng G, Shu C, Wang HX, et al. Walnut oil improves spatial memory in rats and increases the expression of acid‐sensing ion channel genes Asic2a and Asic4. Food Sci Nutr 2019;7(1):293-301.
[Crossref] [Google Scholar] [PubMed]
- Liao J, Nai Y, Feng L, Chen Y, Li M, Xu H. Walnut oil prevents scopolamine-induced memory dysfunction in a mouse model. Molecules 2020;25(7):1630.
[Crossref] [Google Scholar] [PubMed]
- Chauhan A, Chauhan V. Beneficial effects of walnuts on cognition and brain health. Nutrients 2020 Feb 20;12(2):550.
- Poulose SM, Miller MG, Shukitt-Hale B. Role of walnuts in maintaining brain health with age. J Nutr 2014;144(4):561S-6S.
[Crossref] [Google Scholar] [PubMed]
- Batool Z, Sadir S, Liaquat L, Tabassum S, Madiha S, Rafiq S, et al. Repeated administration of almonds increases brain acetylcholine levels and enhances memory function in healthy rats while attenuates memory deficits in animal model of amnesia. Brain Res Bull 2016;120:63-74.
[Crossref] [Google Scholar] [PubMed]
- Haider S, Batool Z, Haleem DJ. Nootropic and hypophagic effects following long term intake of almonds (Prunus amygdalus) in rats. Nutr Hosp 2012;27(6):2109-15.
[Google Scholar] [PubMed]
- Kulkarni KS, Kasture SB, Mengi SA. Efficacy study of Prunus amygdalus (almond) nuts in scopolamine-induced amnesia in rats. Indian J Pharmacol 2010;42(3):168.
[Crossref] [Google Scholar] [PubMed]
- More SK, Pawar AP. Preparation, optimization and preliminary pharmacokinetic study of curcumin encapsulated turmeric oil microemulsion in zebra fish. Eur J Pharm Sci. 2020;155(May):105539.
- Subongkot T, Ngawhirunpat T. Development of a novel microemulsion for oral absorption enhancement of all-trans retinoic acid. Int J Nanomed 2017;12:5585-99.
[Crossref] [Google Scholar] [PubMed]
- Girotra P, Singh SK. Multivariate optimization of rizatriptan benzoate-loaded solid lipid nanoparticles for brain targeting and migraine management. AAPS PharmSciTech 2017;18(2):517-28.
[Crossref] [Google Scholar] [PubMed]
- More SK, Pawar AP. Preparation, optimization and preliminary pharmacokinetic study of curcumin encapsulated turmeric oil microemulsion in zebra fish. Eur J Pharm Sci 2020;155:105539.
- Ansari MJ, Alshetaili A, Aldayel IA, Alablan FM, Alsulays B, Alshahrani S, et al. Formulation, characterization, in vitro and in vivo evaluations of self-nanoemulsifying drug delivery system of luteolin. J Taibah Univ Sci 2020;14(1):1386-401.
- Malcolmson C, Satra C, Kantaria S, Sidhu A, Lawrence MJ. Effect of oil on the level of solubilization of testosterone propionate into nonionic oil-in-water microemulsions. J Pharm Sci 1998;87(1):109-16.
[Crossref] [Google Scholar] [PubMed]
- Al-Mohizea AM, Zawaneh F, Alam MA, Al-Jenoobi FI, El-Maghraby GM. Effect of pharmaceutical excipients on the permeability of P-glycoprotein substrate. J Drug Deliv Sci Technol 2014;24(5):491-5.
- L Shinde R, B Jindal A, V Devarajan P. Microemulsions and nanoemulsions for targeted drug delivery to the brain. Curr Nanosci 2011;7(1):119-33.
- Abd Sisak MA, Daik R, Ramli S. Study on the effect of oil phase and co-surfactant on microemulsion systems. Malaysian J Anal Sci 2017;21:1409-16.
- Yang H, Amnuaikit T, Boonme P. Preparation and evaluation of O/W and W/O microemulsions containing diclofenac sodium. Indian J Pharm Sci 2021;83(1):84-92.
- Narade S, Pore Y. Optimization of ex vivo permeability characteristics of berberine in presence of quercetin using 32 full factorial design. J Appl Pharm Sci 2019;9(1):073-82.
- Jha SK, Karki R, Puttegowda VD, Harinarayana D. In vitro intestinal permeability studies and pharmacokinetic evaluation of famotidine microemulsion for oral delivery. Int Sch Res Notices 2014;2014.
[Crossref] [Google Scholar] [PubMed]
- Patel JK, Jani RK. Enhancing effect of natural oils as permeation enhancer for transdermal delivery of diltiazem hydrochloride through Wistar rat skin. Skin 2016;6:15.
- Das S, Gupta KS. A comprehensive review on natural products as chemical penetration enhancer. J Drug Deliv Ther 2021;11(5-S):176-87.
- Pinjari MJ, Somani RS, Gilhotra RM. Investigation of different formulation approaches to enhance oral bioavailability of Paromomycin. Indian J Pharm Sci 2017;79(4):568-75.
- Ruckenstein E. The origin of thermodynamic stability of microemulsions. Chem Phys Lett 1978;57(4):517-21.
 ): RB-LO-ME; (
 ): RB-WO-ME; (
 ): RB-AO-ME and (
 ): RB solution
 ): RB-LO-ME; (
 ): RB-AO-ME; (
 ): RB-WO-ME and (
 ): RB
): RB


