- *Corresponding Author:
- D. Deng,
Department of Radiology, Hainan Modern Women and Children's Hospital, Haikou, Hainan Province 570203, China
E-mail: Danqiong8@126.com
| Date of Received | 10 June 2022 |
| Date of Revision | 14 April 2023 |
| Date of Acceptance | 04 November 2023 |
| Indian J Pharm Sci 2023;85(5):1605-1614 |
This is an open access article distributed under the terms of the Creative Commons Attribution-NonCommercial-ShareAlike 3.0 License, which allows others to remix, tweak, and build upon the work non-commercially, as long as the author is credited and the new creations are licensed under the identical terms
Abstract
Roles of acid-sensing ion channel 1a and vitamin D-mediated protective mechanisms in hypoxic-ischemic brain damage of neonatal rat were investigated in this work. 108 Sprague Dawley rats were randomly grouped into a sham operation group (Group A), a hypoxic-ischemic brain damage group (Group B), and a vitamin D treatment group (Group C), with 36 rats in each. A hypoxic-ischemic brain damage rat model was established to assess the blood-brain barrier permeability. Additionally, concentrations of 1,25(OH)2D3, superoxide dismutase activity, malondialdehyde levels, acid-sensing ion channel 1a, as well as vitamin D receptor gene and protein expressions in rat brain tissues were analyzed. Results showed that concentrations of 1,25(OH)2D3 in brain tissues and serum, superoxide dismutase levels, and malondialdehyde levels in Group C were higher in contrast to those in Group B but lower than those in Group A (p<0.05). The pH values in the brain tissues of Group C at 48 h and 72 h were higher than the value in Group B but lower in comparison to the Group A (p<0.05). Blood-brain barrier permeability in Group C was improved. Acid-sensing ion channel 1a was elevated in Group C than that in Group B but decreased than that in Group A (p<0.05). Furthermore, vitamin D receptor in Group B was higher, showing obvious differences to that in Groups A and C (p<0.05). In conclusion, vitamin D supplementation protected hypoxic-ischemic brain damage in rats by enhancing superoxide dismutase activity, downregulating malondialdehyde, regulating acid-base balance, improving blood-brain barrier permeability, and inhibiting acid-sensing ion channel 1a and vitamin D receptor.
Keywords
Acid-sensing ion channel 1a, hypoxic-ischemic brain damage, vitamin D, malondialdehyde, superoxide dismutase
Hypoxic-Ischemic Brain Damage (HIBD) in neonates refers to cranial and brain injuries caused by hypoxia and oxygen deprivation during fetal development and after birth[1]. It is a leading cause of neurological sequelae and even death in infants and young children[2]. HIBD encompasses both postnatal hypoxia and prenatal intrauterine distress, playing a significant role in increased infant mortality and the occurrence of long-term adverse diseases[3,4]. HIBD is a neurologic disorder associated with neuronal apoptosis, and its pathogenesis involves a series of pathological and physiological processes such as apoptosis, inflammatory responses and oxidative stress[5,6]. These processes, including energy depletion, membrane depolarization, edema, increased neurotransmitter release, elevated intracellular calcium ions, and anaerobic free radical production, all have detrimental effects on the developing brain. However, the exact pathological mechanisms of HIBD remain incompletely understood.
Acid-Sensing Ion Channel 1a (ASIC1a) is important in HIBD[7]. ASIC1a is an ion channel activated by hydrogen ions and is widely distributed in the nervous system[8]. Meanwhile, it is crucial in the process of neuronal death during hypoxic-ischemic conditions. By activating ASIC1a, intracellular calcium ion concentration increases, triggering a series of cell death-related mechanisms[9,10]. Currently, the understanding of the neuronal injury mechanisms mediated by ASIC1a remains incomplete. On the other hand, the protective mechanisms of vitamin D in HIBD have also drawn research attention[11,12]. Vitamin D is a fat-soluble vitamin that regulates cell differentiation, proliferation, and immune function[13]. Studies have indicated that vitamin D plays an important role in brain injuries, including its effects on neurotrophic factors, calcium channel regulation, reducing free radical damage, and inhibiting inflammatory cytokines[14,15]. However, the specific mechanisms by which vitamin D exerts its protective effects in HIBD are still not clear.
Therefore, this work aimed to explore the mechanisms of ASIC1a in HIBD and the protective effects mediated by vitamin D. The experimental animals were grouped into a sham group (Group A), a HIBD model group (Group B), and a vitamin D treatment group (Group C). Biochemical assays and molecular biology experiments were employed to observe the expression and function of ASIC1a on brain cell membranes in the HIBD model from the perspective of neonatal rats and at different time points. Meanwhile, it observed the causal relationship among the degree of Blood-Brain Barrier (BBB) disruption, pH values, and ASIC1a expression as HIBD progresses. Additionally, it investigated the protective mechanisms of vitamin D in neonatal rat HIBD and its potential impact on ASIC1a signaling targets in HIBD rats. The research findings were expected to give a theoretical basis for understanding the pathogenesis of HIBD and developing gene therapies.
Materials and Methods
Experimental animals and their groups:
108 healthy 7 d old Sprague Dawley (SD) rats were randomly grouped into three, as mentioned above, with 36 rats in each group. Groups B and C were subjected to hypoxic-ischemic modeling, and Group C received intraperitoneal injections of vitamin D (1 μg/kg) at 0, 24, 48, and 72 h after modeling. All experimental animals were obtained from the Hainan Provincial Experimental Animal Center.
Establishment of HIBD rat model:
Wistar rats were allowed to give birth and raise their offspring until the 7th d. After administering 1 % pentobarbital sodium (100 mg/kg) via intraperitoneal injection for anesthesia, the rats were fixed in a supine position on the surgical table. The neck area was disinfected with iodine, and a midline incision was made on the neck using ophthalmic scissors to expose the right carotid artery. The right carotid artery was double ligated and severed. After suturing and local disinfection of the skin, the rats were returned to their mothers for 1 h of recovery. Next, the rats were placed in a sealed hypoxia chamber maintained at 37°, and a gas mixture of 8 % Oxygen (O2) and 92 % Nitrogen (N2) was continuously introduced into the chamber at a flow rate of 5 l/min for 1 h. Afterward, the rats were removed from the chamber and allowed to recover for 1 h in ambient air before being placed back into their mother’s cages for further care. In the sham operation group, the procedure involved only making a skin incision using ophthalmic instruments. The right carotid artery of the rat pups was bluntly separated without ligation, and the skin was directly sutured.
Collection of blood samples (rat tail prick blood method):
At 48 h and 72 h, blood samples were collected from the animals in each experimental group. Prior to blood collection, the rats’ tails were warmed with warm water and then wiped with ethanol for disinfection, ensuring adequate blood flow. A size 7 or 8 injection needle was used to puncture the tail vein, and blood drops were collected when the needle was withdrawn. Approximately 10-50 mm3 of blood was collected in each instance for subsequent biochemical testing.
Preparation and observation of pathological tissue specimen:
At 48 h and 72 h, the animals in each experimental group were anesthetized, perfused, and their rat brain tissues were collected. The brain tissues were then washed clean with pre-chilled D-Hanks solution. A portion of the pathological tissues was directly immersed in 10 % formaldehyde solution for 24 h and then embedded in paraffin. Another portion of the tissues was rapidly frozen in liquid nitrogen and subsequently stored in a -80° freezer for use in subsequent biochemical and molecular biology studies. The pH value of the brain tissues was measured using a PH200 waterproof acidity/Oxidation-Reduction Potential (ORP) ion meter[9]. Slices of rat brain tissues were subjected to routine Hematoxylin and Eosin (HE) staining. Additionally, lead uranium double staining was performed, and the corresponding brain tissue pathological changes were observed using an optical microscope and EX-2000 transmission electron microscope.
Detection of BBB permeability by Immunoglobulin G (IgG) immunohistochemically staining of brain tissue sections:
The two-step method of IgG immunohistochemically staining was employed, using DAKO’s EnVision staining system (GLK500705). The basic steps were as follows. After dewaxing and hydration of paraffin sections, they were rinsed three times with Phosphate-Buffered Saline (PBS) and incubated at Room Temperature (RT) for 10 min with 3 % hydrogen peroxide, followed by three additional PBS rinses. Subsequently, the sections were incubated overnight (18 h) at 4° with the primary antibody (IgG, 1:8000, DAKO product). After washing with PBS three times, the sections were incubated at RT for 20 min with the secondary antibody (EnVision system).
Three more PBS washes were performed, and the sections were treated with 3,3'-Diaminobenzidine (DAB) chromogen. Staining was observed under a light microscope, and the reaction was stopped by placing the sections in water. Subsequently, counterstaining with hematoxylin and mounting of the slides were carried out. The results of IgG immunohistochemically staining were graded as follows; Grade 0 means no staining; Grade 1 means staining visible in the neural fiber network; Grade 2 means staining in the neural fiber network and in 1-20 astrocyte cell bodies (400× magnification) and Grade 3 means staining in the neural fiber network and in more than 20 astrocyte cell bodies (400× magnification)[16].
Concentration of 1,25(OH)2D3, activity of Superoxide Dismutase (SOD), and level of Malondialdehyde (MDA) in rat brain:
Cold-preserved rat hippocampal tissues were utilized to prepare homogenates. Enzyme-Linked Immunosorbent Assay (ELISA) assay was performed using ELISA kit. SOD activity was measured using the guanine oxidation method, and MDA levels were determined using the Thiobarbituric Acid (TBA) colorimetric method. Additionally, the concentration of 1,25(OH)2D3 was measured.
Detection of ASIC1a and Vitamin D Receptor (VDR) gene and protein in rat brain:
Total Ribonucleic Acid (RNA) was extracted from the samples following the TRIzol reagent instructions. The extracted RNA was then reverse transcribed into complimentary Deoxyribonucleic Acid (cDNA) using the Moloney Murine Leukemia Virus (MMLV) kit, following the provided instructions. The cDNA products were employed for real-time fluorescence quantitative Polymerase Chain Reaction (PCR) to detect the messenger RNA (mRNA) levels of ASIC1a, pASIC1a, and VDR. The corresponding primer sequences for ASIC1a were 5' CTGCGTGTGTGAAATGCCTTG 3' (forward) and 5' GGATGTTCTCCCCTATGTATT 3' (reverse); while those for the reference gene Glyceraldehyde 3-Phosphate Dehydrogenase (GAPDH) were 5' GGAGTCTACTGGCGTCTTCAC 3' (forward) and 5' ATGAGCCCTTCCACGATGC 3' (reverse).
Methods for statistics:
Experimental data were statistically analyzed using Statistical Package for the Social Sciences (SPSS) 23.0. The quantitative data were presented as mean±standard deviation. For inter-group comparisons, a one-way analysis of variance was performed. Further pairwise comparisons between two groups were conducted using the Student-Newman-Keuls test.
Results and Discussion
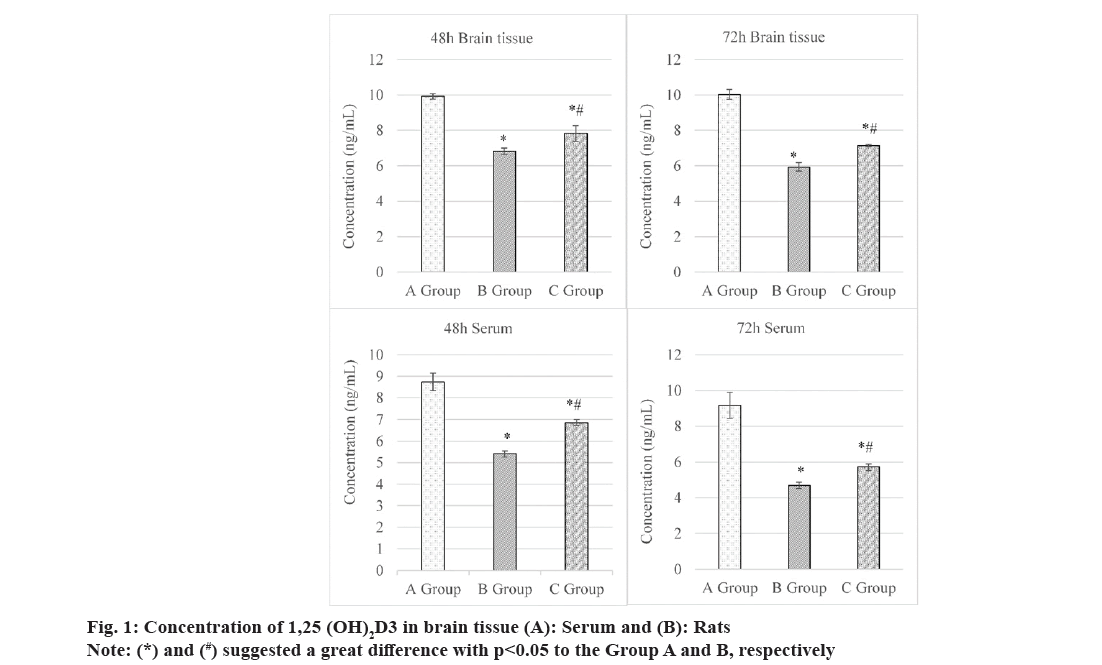
Concentrations of 1,25(OH)2D3 in the serum and brain tissues of rats were compared and observed, as illustrated in fig. 1.
At 48 h, its concentration of 1,25(OH)2D3 in the brain tissues was (9.92±0.15) ng/ml, (6.82±0.19) ng/ml, and (7.82±0.45) ng/ml in Groups A-C, respectively. It suggested that concentration in Group C was higher than that in Group B but lower in contrast to that in Group A, showing obvious differences with p<0.05. At 72 h, concentration of 1,25(OH)2D3 in the brain tissues was (7.14±0.08) ng/ml in Group C, which was lower to (10.03±0.28) ng/ml in Group A but lower based on (5.93±0.24) ng/ml in Group B. The comparison here demonstrated obvious differences (p<0.05).
At 48 and 72 h, concentrations of 1,25(OH)2D3 in serum were (8.74±0.41) ng/ml and (9.18±0.72) ng/ml in Group A, (5.41±0.14) and (4.69±0.18) ng/ml in Group B, as well as (6.85±0.14) and (5.72±0.19) ng/ml in Group C, respectively. These data suggested that concentrations of 1,25(OH)2D3 in serum of rats in Group C were higher to those in Group B but lower based on those in Group A, showing remarkable differences with p<0.05.
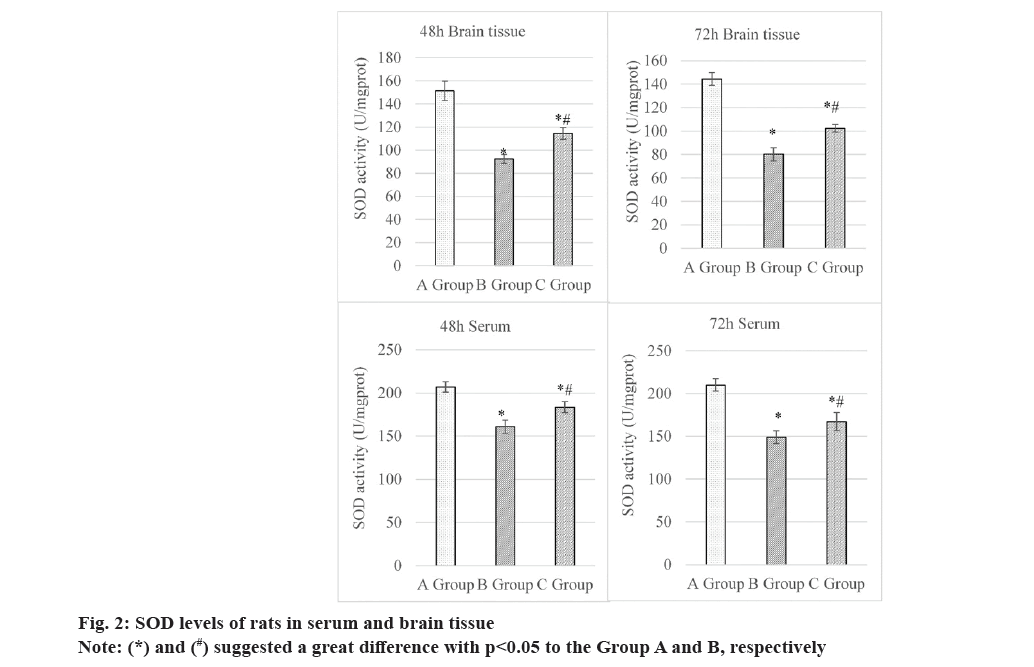
At 48 h, the SOD levels in the brain tissues were as follows; Group A (151.51±8.45) U/mg protein, Group B (92.33±3.94) U/mg protein, and Group C (114.60±5.04) U/mg protein. Thus, the level of this indicator in Group C was higher and lower than that in Groups B and A, respectively, all showing obvious differences (p<0.05). At 72 h, the SOD levels in the brain tissues were as follows; Group A (144.42±5.46) U/mg protein, Group B (80.23±5.66) U/mg protein, and Group C (102.38±3.21) U/mg protein. It suggested that the Group C exhibited a higher SOD level in contrast to Group B and a lower value based on Group A, presenting great differences with p<0.05.
At 48 h, the SOD levels in the serum were (206.89±5.95) U/mg protein, (160.92±7.51) U/mg protein, and (183.41±6.20) U/mg protein in Group A, B and C, respectively. The SOD level in Group C was higher than in Group B but lower than in Group A, demonstrating great differences (p<0.05). At 72 h, rats in three groups exhibited the SOD levels in the serum of (210.04±7.32) U/mg protein, (148.86±7.35) U/mg protein, and (167.11±10.79) U/mg protein, respectively. That in Group C was sharply different from the levels in the other groups (p<0.05). The specific details were explicated in fig. 2.
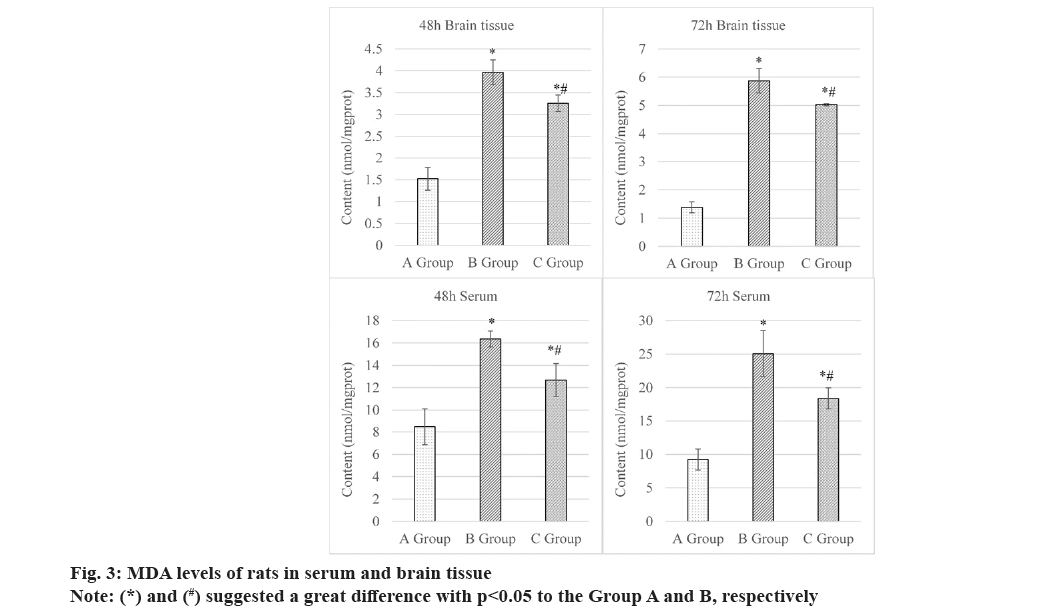
Fig. 3 summarized the comparison of MDA levels in rats in brain tissue and serum after intervention 48 h and 72 h. At 48 h, MDA levels in the brain tissues were (1.52±0.26) nmol/mg protein, (3.97±0.28) nmol/mg protein, and (3.26±0.19) nmol/mg protein in Groups A, B and C, respectively. The comparison indicated that the Group C presented higher value to Group B but lower level to Group A, both exhibiting obvious differences statistically (p<0.05). At 72 h, the MDA level showed the similar comparison results among all groups. Specifically, it was (1.38±0.19) nmol/mg protein in Group A, (5.87±0.43) nmol/mg protein in Group B, and (5.02±0.04) nmol/mg protein in Group C.
At 48 h, the MDA levels in the serum of rats were as follow; Group A (8.48±1.62) nmol/mg protein, Group B (16.35±0.72) nmol/mg protein, and Group C (12.68±1.48) nmol/mg protein. At 72 h, those in the serum were (9.24±1.58) nmol/mg protein, (25.06±3.43) nmol/mg protein, and (18.38±1.57) nmol/mg protein in Groups A, B and C, respectively.These findings disclosed that rats in Group C had mediate MDA level, which was higher to Group B and lower based on Group A, exhibiting obvious differences at both observed time points after they were intervened (all p<0.05). The above results were supported by specific data displayed in fig. 3.
The local pH values in the brain tissues of SD rats at 48 h and 72 h were measured and compared, as presented in Table 1. In both instances, the pH value in Group C was higher than in Group B but lower than in Group A, demonstrating observable differences with p<0.05.
| Time point | Group A | Group B | Group C |
|---|---|---|---|
| 48 h | 7.34 | 7.13* | 7.19*# |
| 72 h | 7.32 | 7.03* | 7.17*# |
Note: (*) and (#) suggested a great difference with p<0.05 to Group A and B, respectively
Table 1: Comparison on Local PH Values in Brain Tissue
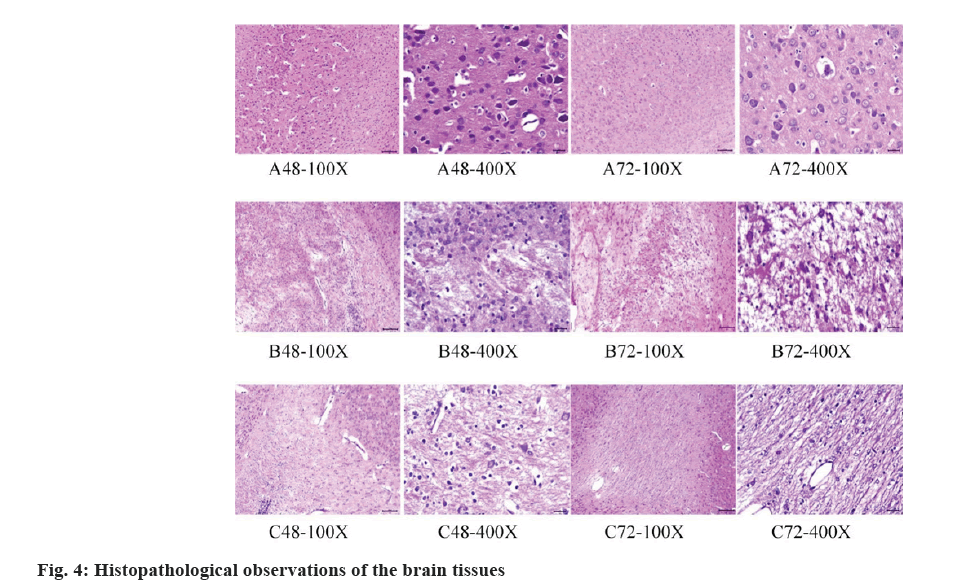
The histopathological observations of the brain tissues of rats were displayed in fig. 4 below. In Group A, the brain tissue structure appeared normal without any significant pathological changes. The cell morphology and arrangement were similar to the normal state, and there were no obvious histopathological features. In Group B, HE staining showed a certain degree of pathological changes in the brain tissues, including neuronal degeneration, necrosis or apoptosis. Abnormal nuclear staining, disordered cell arrangement, and increased glial cell reaction were also observed as pathological features. In Group C, the HE staining results indicated a reduction in the severity of pathological changes compared to Group B. Some recovery in cell morphology and arrangement was observed, with normal nuclear staining and a decrease in neuronal degeneration and necrosis.
The glial cell reaction was also reduced.
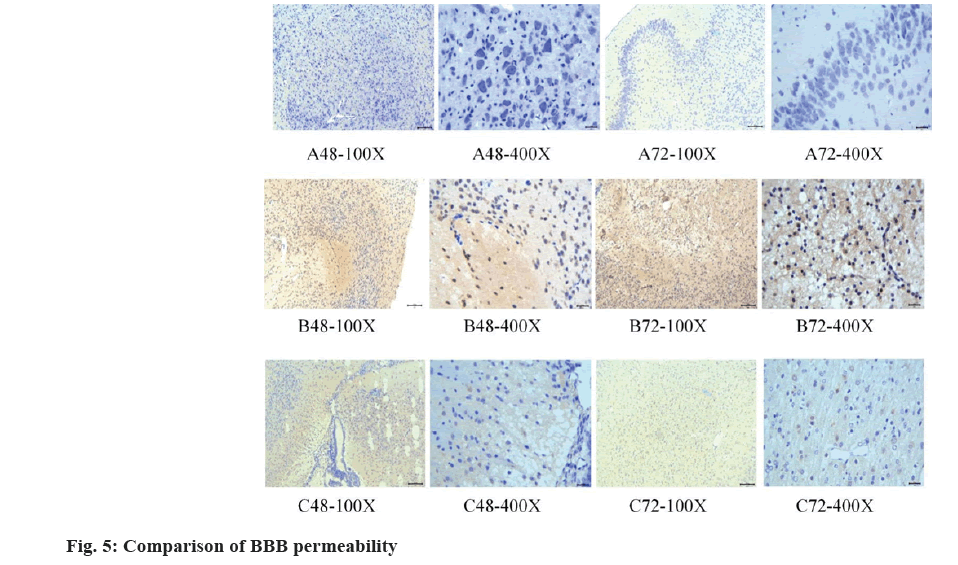
The immunohistochemistry staining results were displayed and compared in fig. 5. In Group A, a lower BBB permeability was observed. In Group B, an increased BBB permeability was visualized. In Group C, the BBB permeability was improved. These findings suggested that the treatment with vitamin D medication had a positive impact on restoring BBB function, reducing the permeability of substances in the blood.
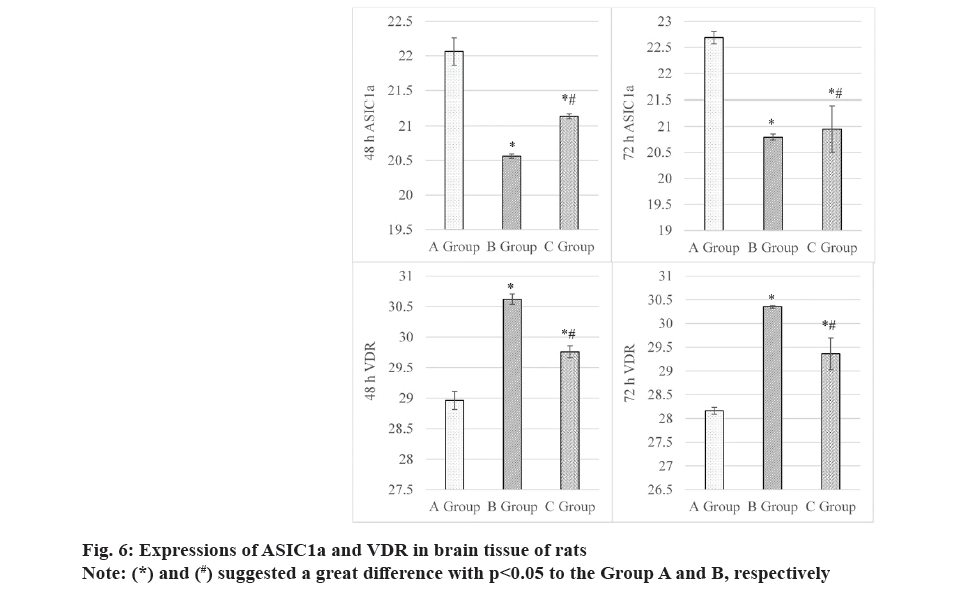
Results in fig. 6 revealed that at 48 h, ASIC1a gene in the brain tissues was expressed as (22.06±0.20) in Group A, (20.56±0.03) in Group B, and (21.14±0.04) in Group C. It seemed that Groups A and B exhibited the highest and lowest expression of ASIC1a gene, showing obvious differences for all comparisons herein (p<0.05). At 72 h, rats in Groups A, B and C exhibited the ASIC1a gene in the brain tissues of (22.68±0.12), (20.79±0.06) and (20.95±0.44), respectively. It indicated that the comparison among groups exhibited the similar results with that at 48 h, and the differences were great (p<0.05).
Furthermore, fig. 6 also explicated the changes of VDR gene after different intervention periods. At 48 h, VDR in serum showed the values of (28.96±0.15), (30.62±0.08), and (29.76±0.10) in Groups A, B and C. The data comparison among various groups exhibited remarkable differences with p<0.05, with VDR level in Group C was higher and lower than Group A and Group B, respectively. At 72 h, it had the similar comparison results for VDR in serum of rats in various groups, with specific values of (28.16±0.07), (30.35±0.03) and (29.36±0.33) in Groups A, B, and C, respectively. Similarly, the comparison revealed obvious differences with p<0.05.
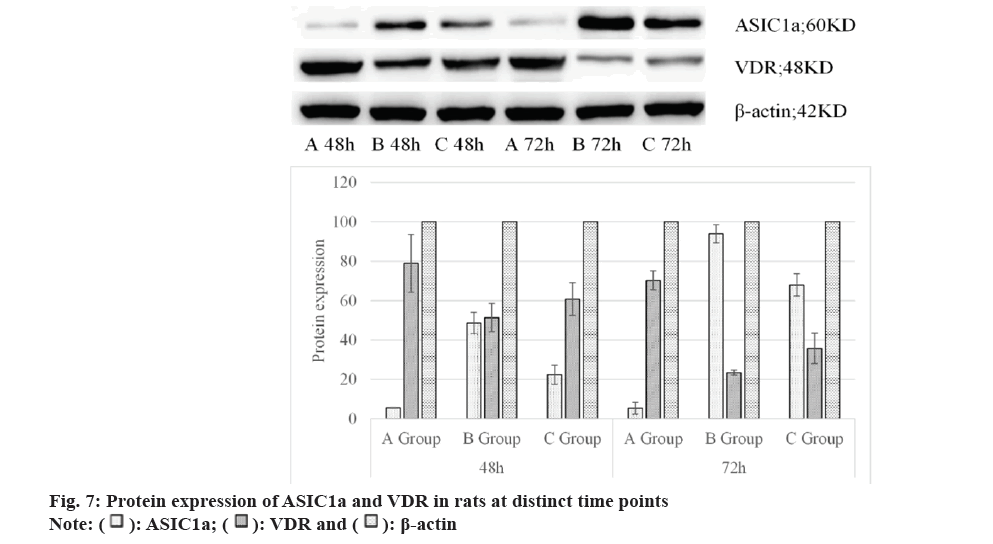
As displayed in Table 2, protein expressions of ASIC1a and VDR in rat brain tissues showed that at 48 h and 72 h, those in Group C were both higher than in Group A but lower than in Group B, showing considerable differences (p<0.05). Also, the above results were explicated in fig. 7 below.
| Group | 48 h | 72 h | ||||
|---|---|---|---|---|---|---|
| ASIC1a | VDR | β-actin | ASIC1a | VDR | β-actin | |
| A | 5.53±0.17 | 79.03±14.66 | 100 | 5.39±2.99 | 70.27±4.82 | 100 |
| B | 48.65±5.39 | 51.45±7.25 | 100 | 93.96±4.61 | 23.39±1.25 | 100 |
| C | 22.41±4.88 | 60.78±8.30 | 100 | 68.02±5.65 | 35.76±7.68 | 100 |
Table 2: Protein Expression Of ASIC1a and VDR in Rats at Distinct Time Points
HIBD is a common and severe disease with a complex and not fully understood pathogenesis. Therefore, it is necessary to conduct in-depth research on its occurrence and development mechanisms in order to better understand the disease and develop appropriate treatment strategies. Recent studies have shown that ASIC1a signaling target and vitamin D play important regulatory roles in the nervous system[17]. However, the specific mechanisms of ASIC1a signaling target and vitamin D in HIBD are still unclear. Hence, we hope that through this study, we can reveal their functions and interactions in HIBD. Vitamin D has been demonstrated to exert an important effect in various neuroprotective and repair processes, including its impact on neuronal survival and function, as well as its regulation of oxidative stress and inflammatory responses[15,18]. Additionally, research indicates that vitamin D deficiency in adults is associated with the development and severity of ischemic stroke[19]. Therefore, investigating the mechanisms of vitamin D in HIBD holds promise for providing new insights and targets for developing therapies for this disease. By studying a rat model, we can better simulate and understand the pathological and physiological processes of human HIBD. Thus, this research will delve into the mechanisms of HIBD, explore the roles of ASIC1a signaling target and vitamin D in it, and provide a scientific basis and new research directions for the treatment and intervention of this disease.
This work revealed that the HIBD group (Group B) exhibited a decrease in SOD levels, indicating that the hypoxic-ischemic state may lead to increased oxidative stress and inhibition of SOD activity. However, the vitamin D drug group (Group C) exhibited a recovery in SOD, suggesting that Vitamin D Supplementation (VDS) may have a reparative effect on the protective antioxidant function of SOD. Meanwhile, the hypoxic-ischemic group displayed a sharp increase in MDA levels, while the vitamin D drug group showed a decrease. This suggests that the hypoxic-ischemic state may lead to exacerbated lipid peroxidation, resulting in higher MDA production, while VDS may reduce MDA generation by inhibiting lipid peroxidation reactions and thereby alleviate oxidative stress damage. There are death mechanisms in the pathological environment of brain ischemia and hypoxia that do not depend on ion channel function[20]. Acidification leads to a sustained increase in proton concentration, activating and desensitizing the ASIC1a channel, causing conformational changes in ASIC1a protein, exposing the ASIC1a carboxyl terminal, and specifically binding to Receptor-Interacting Protein 1 (RIP1) to trigger RIP1 phosphorylation, thereby activating the process of neuronal programed necrosis (necroptosis) and brain injury[21]. In this work, the hypoxic-ischemic group held a decrease in local pH, while the vitamin D drug group exhibited a recovery in pH. This indicates that the hypoxic-ischemic state may lead to acidosis, while VDS may help regulate acid-base balance and increase the pH value of brain tissue.
Furthermore, the hypoxic-ischemic group exhibited an increase in BBB permeability, while the vitamin D drug group demonstrated an improvement in this condition. This suggests that the hypoxic-ischemic state may lead to BBB disruption, making it easier for substances in the blood to penetrate brain tissue, while VDS may help protect the integrity of the BBB. Additionally, the hypoxic-ischemic group displayed elevated ASIC1a and VDR genes, while the vitamin D drug group presented a decrease or improvement in gene expression after treatment. This indicates that the hypoxic-ischemic state may cause excessive activation of ASIC1a and VDR, increasing neuronal toxicity, while VDS may mitigate neural damage by regulating the expression of these genes. In summary, VDS may offer protection to rats in a hypoxic-ischemic state by increasing SOD activity, reducing MDA production, regulating acid-base balance, improving BBB permeability, and inhibiting excessive expression of ASIC1a and VDR.
These findings provide clues to the mechanisms of vitamin D in neuroprotection and hold important clinical significance. However, further research is needed to delve deeper into the detailed molecular mechanisms and potential therapeutic applications.
VDS has shown to yield a certain degree of protection in HIBD rats by increasing SOD activity, reducing MDA production, regulating acid-base balance, improving BBB permeability, and inhibiting excessive expression of ASIC1a and VDR. However, it was worth noting that the sample size of rats employed in this work was relatively small, which may impact the reliability and generalizability of the results. Future research can consider increasing the sample size to enhance the statistical power of the study. Furthermore, further investigations should focus on exploring the relationship between HIBD and inflammatory responses, and immune regulation. Considering the significant role of inflammatory responses in brain injury, future studies could delve into the potential mechanisms of ASIC1a and vitamin D in regulating inflammatory responses and immune reactions.
In conclusion, while this work yielded valuable insights into the protective effects of vitamin D in HIBD rats, additional research was needed to strengthen the findings and expand our understanding of the molecular mechanisms involved. Expanding the sample size and investigating the relationship with inflammatory responses and immune regulation were important steps in advancing the understanding and potential therapeutic applications of vitamin D in HIBD.
Authors' contributions:
Shenglong Wu and Yong Wei have contributed equally to this work.
Conflict of interests:
The authors declared no conflict of interests.
References
- Zheng Y, Wang X. Amide proton transfer (APT) imaging-based study on the correlation between brain pH and voltage-gated proton channels in piglets after hypoxic-ischemic brain injury. Quant Imaging Med Surg 2021;11(10):4408-17.
[Crossref] [Google Scholar] [PubMed]
- Zhao M, Chen S, Yang ML, Li SY, Jiang W, Xiao N. Vitamin a regulates neural stem cell proliferation in rats after hypoxic-ischemic brain damage via RAR?-mediated modulation of the β-catenin pathway. Neurosci Lett 2020;727:134922.
[Crossref] [Google Scholar] [PubMed]
- Xiong ZG, Chu XP, Simon RP. Ca2+-permeable acid-sensing ion channels and ischemic brain injury. J Membr Biol 2006;209:59-68.
[Crossref] [Google Scholar] [PubMed]
- Yin W, Zhang L, Qian M. Fibulin-5 gene attenuates inflammation via the Calcitonin Gene-Related Peptide (CGRP). J Biol Regulators Homeostatic Agents 2022;36(6):1749-57.
- Vannucci RC, Connor JR, Mauger DT, Palmer C, Smith MB, Towfighi J, et al. Rat model of perinatal hypoxic?ischemic brain damage. J Neurosci Res 1999;55(2):158-63.
[Crossref] [Google Scholar] [PubMed]
- Pouwer F, Kupper N, Adriaanse MC. Does emotional stress cause type 2 diabetes mellitus? A review from the European Depression in Diabetes (EDID) research consortium. Discov Med 2010;9(45):112-8.
[Google Scholar] [PubMed]
- Rothman SM, Olney JW. Glutamate and the pathophysiology of hypoxic–ischemic brain damage. Ann Neurol 1986;19(2):105-11.
[Crossref] [Google Scholar] [PubMed]
- Rice JE, Vannucci RC, Brierley JB. The influence of immaturity on hypoxic?ischemic brain damage in the rat. Ann Neurol 1981;9(2):131-41.
[Crossref] [Google Scholar] [PubMed]
- Mishra AP, Saklani S, Salehi B, Parcha V, Sharifi-Rad M, Milella L, et al. Satyrium nepalense, a high altitude medicinal orchid of Indian Himalayan region: Chemical profile and biological activities of tuber extracts. Cell Mol Biol 2018;64(8):35-43.
- McGinn EA, Powers A, Galas M, Lyden E, Peeples ES. Neonatal vitamin D status is associated with the severity of brain injury in neonatal hypoxic–ischemic encephalopathy: A pilot study. Neuropediatrics 2020;51(4):251-8.
[Crossref] [Google Scholar] [PubMed]
- McGinn EA, Lyden E, Peeples ES. Reply to: The severity of neuronal damage in neonatal hypoxic-ischemic encephalopathy: Does vitamin D status matter? Neuropediatrics 2021;52(05):419-20.
[Crossref] [Google Scholar] [PubMed]
- Bocci V, Valacchi G, Corradeschi F, Aldinucci C, Silvestri S, Paccagnini E, et al. Studies on the biological effects of ozone: 7. Generation of reactive oxygen species (ROS) after exposure of human blood to ozone. J Biol Regulators Homeostatic Agents 1998;12(3):67-75.
[Google Scholar] [PubMed]
- Lowe DW, Fraser JL, Rollins LG, Bentzley J, Nie X, Martin R, et al. Vitamin D improves functional outcomes in neonatal hypoxic ischemic male rats treated with N-acetylcysteine and hypothermia. Neuropharmacol 2017;123:186-200.
[Crossref] [Google Scholar] [PubMed]
- Panda PK, Sharawat IK. The severity of neuronal damage in neonatal hypoxic–ischemic encephalopathy: Does vitamin-D status matter? Neuropediatrics 2021;52(5):417-8.
[Crossref] [Google Scholar] [PubMed]
- Turukmane AV, Alhebaishi N, Alshareef AM, Mirza OM, Bhardwaj A, Singh B. Multispectral image analysis for monitoring by IoT based wireless communication using secure locations protocol and classification by deep learning techniques. Optik 2022;271:170122.
- Jiang W, Guo M, Gong M, Chen L, Bi Y, Zhang Y, et al. Vitamin A bio-modulates apoptosis via the mitochondrial pathway after hypoxic-ischemic brain damage. Mol Brain 2018;11(1):1-6.
[Crossref] [Google Scholar] [PubMed]
- Gelzo M, Caputo M, Comegna M, Cernera G, di Minno A, Scialo F, et al. Exploiting sterol profile analysis: Over 10 years of experience. A narrative review. Acta Med Mediterr 2021;37(1):35-42.
- Cai Y, Li X, Tan X, Wang P, Zhao X, Zhang H, et al. Vitamin D suppresses ferroptosis and protects against neonatal hypoxic-ischemic encephalopathy by activating the Nrf2/HO-1 pathway. Transl Pediatr 2022;11(10):1633-44.
[Crossref] [Google Scholar] [PubMed]
- Busl KM, Greer DM. Hypoxic-ischemic brain injury: Pathophysiology, neuropathology and mechanisms. Neuro Rehabilitation 2010;26(1):5-13.
[Crossref] [Google Scholar] [PubMed]
- Koehler RC, Yang ZJ, Lee JK, Martin LJ. Perinatal hypoxic-ischemic brain injury in large animal models: Relevance to human neonatal encephalopathy. J Cereb Blood Flow Metab 2018;38(12):2092-111.
[Crossref] [Google Scholar] [PubMed]
- Chen W, Xu B, Xiao A, Liu L, Fang X, Liu R, et al. TRPM7 inhibitor carvacrol protects brain from neonatal hypoxic-ischemic injury. Mol Brain 2015;8(1):1-3.
