- *Corresponding Author:
- Bhoomi Patel
Department of Pharmaceutical Chemistry and Quality Assurance, Shree S. K. Patel College of Pharmaceutical Education and Research, Ganpat University, Kherva, Mehsana, Gujarat 384012, India
E-mail: bhoomi16692@gmail.com
| Date of Received | 08 February 2020 |
| Date of Revision | 24 July 2021 |
| Date of Acceptance | 15 September 2021 |
| Indian J Pharm Sci 2021;83(5):939-946 |
This is an open access article distributed under the terms of the Creative Commons Attribution-NonCommercial-ShareAlike 3.0 License, which allows others to remix, tweak, and build upon the work non-commercially, as long as the author is credited and the new creations are licensed under the identical terms
Abstract
An innovative, sensitive, simple and rapid method has been developed for estimation of selective H1 receptor antagonist. The method is based on bromination of drug. The proposed spectrophotometric method was developed using potassium bromate-potassium bromide mixture in acidic condition followed by the reaction of surplus bromine with methyl orange dye and measure the absorbance at 506 nm. Beer’s law was obeyed in the concentration range of 0.2-1.2 μg/ml, 0.3-1.7 μg/ml and 0.03-0.18 μg/ml for olopatadine hydrochloride, fexofenadine hydrochloride and azelastine hydrochloride respectively. The method was optimized for concentration of hydrochloride, ml of hydrochloride, ml of potassium bromate-potassium bromide mixture, ml of dye and reaction time. Developed method has been validated in accordance to International Council on Harmonisation guideline Q2R1. Statistical analysis proved that the method is accurate, sensitive, selective, precise and reproducible. The simple procedure with high accuracy, wide linearity range and sensitivity imply that the demonstrated method to be appropriate for routine estimation and quality control assay of pharmaceutical formulations.
Keywords
Olopatadine hydrochloride, fexofenadine hydrochloride, azelastine hydrochloride, optimization, validation, potassium bromate-potassium bromide mixture
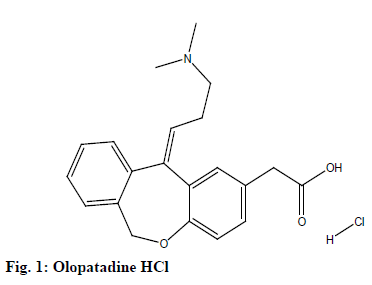
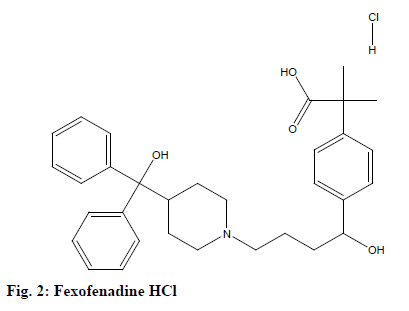
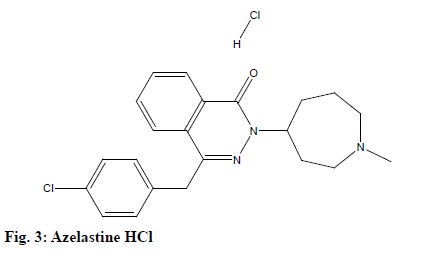
Olopatadine hydrochloride (HCl) (OLO), 2-[(11Z)- 11-[3-(dimethylamino)propylidene]-6H-benzo[c] [1]benzoxepin-2-yl]acetic acid hydrochloride[1] (fig. 1) is a white crystalline powder, almost odourless soluble in double distilled water, methanol and chloroform. It is commonly used as an anti-allergic agent. OLO is official in Indian Pharmacopoeia[2], United state pharmacopeia[3]. Fexofenadine HCl (FEX), 2-[4-[1-hydroxy-4-[4-[hydroxy(diphenyl)methyl] piperidin-1-yl] butyl] phenyl]-2-methylpropanoic acid hydrochloride[4] (fig. 2) is a white crystalline powder, almost odourless soluble in double distilled water, methanol and chloroform. It is commonly used as an antiallergic agent. FEX is official in Indian Pharmacopoeia[5], United state pharmacopeia[6], British Pharmacopoeia[7] and European Pharmacopoeia[8]. Azelastine HCl (AZE), 4-[(4-chlorophenyl)methyl]-2-(1-methylazepan- 4-yl)phthalazin-1-one hydrochloride[9] (fig. 3) is a white crystalline powder, almost odourless soluble in double distilled water, methanol and chloroform. It is commonly used as an anti-allergic agent. AZE is official in Indian Pharmacopoeia[10], British Pharmacopoeia[11] and European Pharmacopoeia[12].
OLO, FEX and AZE are selective histamine H1 antagonists and mast cell stabilizers that work by attenuating inflammatory and allergic reactions used for the treatment of seasonal and perennial allergic rhinitis and urticaria. Literature survey reveals that many analytical methods are reported for determination of mentioned H1 receptor antagonist such as spectrophotometry[13-16], voltammetry[17-19], chromatography[20-22], high performance liquid chromatography[23-28], high performance thin layer chromatography[29], Ultra-performance liquid chromatography (UPLC)[30], Liquid chromatography–mass spectrometry (LC–MS)[31] and stability indicating method[32] for have been employed. The objective of this study is to develop a relatively economic, valid, accurate, precise and sensitive colorimetric method for the estimation of various H1 receptor antagonists in the pure form and pharmaceutical dosage form. Since most of the reported methods have been found to be less sensitive and complicated, there is a true demand to develop a sensitive method for the estimation of same. Thus, the present investigation aims to develop a sensitive and cost-effective method for the estimation of various H1 receptor antagonists in the pharmaceutical dosage form using the spectrophotometric technique. The proposed method has the advantages of great sensitivity and simplicity along with good accuracy and precision. The method is applied successfully for the estimation of various H1 receptor antagonists like OLO, FEX and AZE in the respective pharmaceutical dosage forms without the interference of excipients. The color developed was stable for a long period of time; hence, this method can be extended for the routine assay of OLO, FEX and AZE in the respective pharmaceutical formulations. The method was validated as compliance with International Conference on Harmonization (ICH) guidelines[33].
Materials and Methods
OLO of pharmaceutical grade was kindly supplied as gift sample by USV Pvt. Ltd., Mumbai, India and were certified to contain 99.65 % (w/w), on dried basis. The nasal spray containing 665 μg/spray OLO was procured from Walgreens, market of USA which is used for analysis of pharmaceutical formulation. FEX of pharmaceutical grade was kindly supplied as gift sample by Camper healthcare, Ganpat Vidyanagar, Mehsana, India and were certified to contain 99.75 % (w/w), on dried basis. The FEX tablets contain 60 mg/tablet FEX was procured from Walgreens, market of USA which is used for analysis of pharmaceutical formulation. AZE of pharmaceutical grade was kindly supplied as gift sample by Sun pharma Pvt. Ltd. Vadodara, Gujarat, India and were certified to contain 99.89 % (w/w), on dried basis. The nasal sprays were procured from Janata super market, Mehsana, Gujarat, India containing 0.1 % w/v of AZE. Analytical reagent (AR) graded potassium bromate, potassium bromide, methyl orange dye, concentrated HCl and double distilled water used were purchased from Finar Chemicals Pvt. Ltd. The spectrophotometric analysis was performed using a double beam ultraviolet (UV)-visible spectrophotometer (Shimadzu, UV-1700, Japan), attached to a computer software UV probe 2.0, with a spectral width of 2 nm, wavelength accuracy of 0.5 nm and pair of 1 cm matched quartz cells. In addition, analytical balance (CP224S, Sartorius, Germany), ultrasonic cleaner (Frontline FS 4, Mumbai, India), volumetric flasks, beakers and pipettes of borosilicate glass were used in the study.
Preparation of stock solution:
Stock solutions were prepared by weighing 10 mg of OLO, FEX and AZE respectively. The weighed drugs were transferred to the separate 100 ml volumetric flask for OLO, FEX and AZE respectively and label them appropriately. Volumes were made up to the mark with double distilled water to obtain a solution containing 100 μg/ml. The solutions was further diluted with the same solvent to obtain final concentration of 10 μg/ml for OLO and FEX where 1 μg/ml for AZE.
Preparation of reagents:
Preparation of HCl solution xM: HCl solution (0.1, 0.2, 0.3, 0.4 and 0.5 M), prepared by diluting the appropriate volume (xM HCl prepared by transferring 85x ml of concentrated HCl to 1000 ml) of concentrated acid with double distilled water.
Preparation of potassium bromate-potassium bromide (KBr-KBrO3) mixture: Accurately weighed 1.67 g KBrO3 and 5.95 g KBr and dissolved in 100 ml distilled double distilled water[34,35] then transferred 10 ml of above solution to 100 ml volumetric flask and diluted up to mark with double distilled water.
Preparation of methyl orange dye: Dissolve 0.01 % methyl orange in double distilled water.
General procedure:
Accurately transferred 1 ml of OLO, FEX and AZE stock solutions to 10 ml separate volumetric flasks then added 2 ml 0.1 M HCl and added 2 ml KBr- KBrO3 reagent in all 10 ml volumetric flasks, allowed the reaction mixtures to bromination of drugs for 30 min, lastly excess bromine reacted with added 2 ml methyl orange dye[35] and formed pink colour in acidic condition.
Optimization of experimental variables:
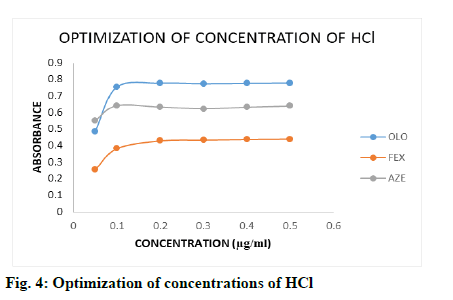
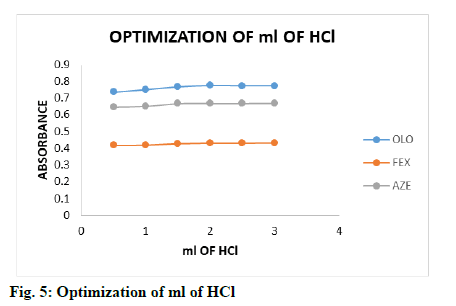
The effect of acid concentration on the measured species was investigated by following the general procedure. The effect of 2 ml of HCl of different concentrations (0.05, 0.1, 0.2, 0.3, 0.4 and 0.5 M) was studied by measuring the absorbance of the coloured product using a fixed concentration of drugs 1.0 μg/ml (fig. 4), simultaneously the effect of ml of optimized concentration of HCl (0.5-3.0 ml) was investigated by same procedure (fig. 5), it is clear that the absorbance of the coloured product remained constant with 2.0 -3.0 ml of 0.2-0.5 M HCl, 2.0-3.0 ml of 0.2-0.5 M HCl and 1.5-3.0 ml of 0.1-0.5 M HCl for OLO, FEX and AZE respectively. Therefore, 2.0 ml of 0.2 M HCl for OLO and FEX, 1.5 ml of 1.0 M HCl for AZE was selected for method.
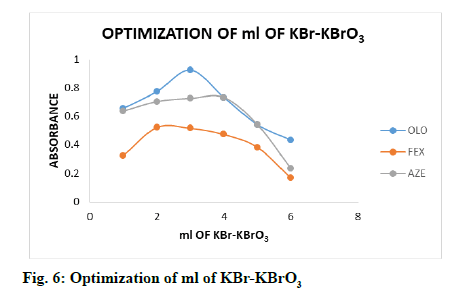
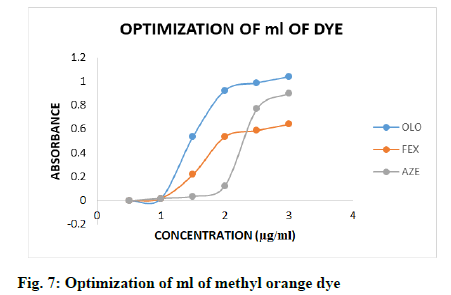
The effect of ml of KBr-KBrO3 mixture and ml of methyl orange dye were optimized, too by following general procedure. The effect of different ml of KBr- KBrO3 mixture (1.0-6.0 ml, fig. 6) and methyl orange dye (0.5-3.0 ml, fig. 7) were observed by measuring the absorbance of coloured products using same concentration of drugs, it is clear that the coloured products gave highest absorbance with 3.0, 2.0 and 4.0 ml of KBr-KBrO3 mixture and 2.0, 2.0 and 2.5 ml of methyl orange dye for OLO, FEX and AZE respectively.
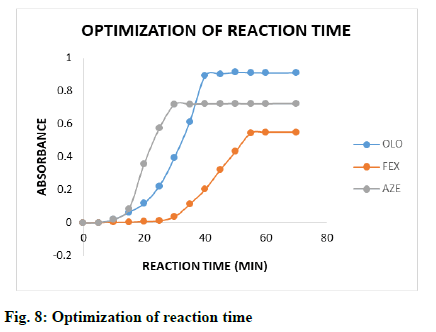
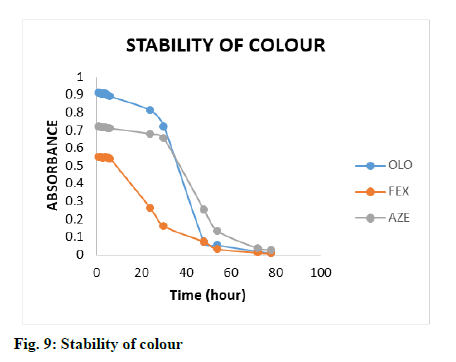
The effect of time on the reaction between drugs and KBr-KBrO3 mixture in the presence of HCl was studied by keeping all other reaction conditions unchanged. The absorbance of the coloured products were measured at different time intervals (5.0-78.0 min, fig. 8) and the result showed that the reaction was completed after 40, 55 and 30 min and remained stable for at least 22-24 h, 5-6 h and 28-30 h for OLO, FEX and AZE respectively (fig. 9).
Calibration curve:
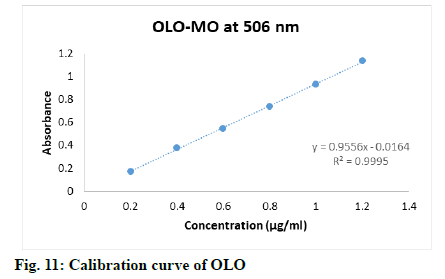
Appropriate aliquots (0.2, 0.4, 0.6, 0.8, 1.0 and 1.2 ml) stock solution of OLO were transferred to 10 ml volumetric flasks, then added 2.0 ml of 0.2 M HCl followed by 3.0 ml of KBr-KBrO3 mixture to each flask, keep all the flasks for 40 min at least to complete bromination of drug, lastly added 2.0 ml of methyl orange dye and diluted up to mark with double distilled water to obtain final concentrations 0.2-1.2 μg/ml.
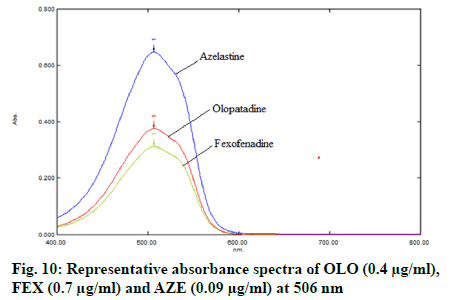
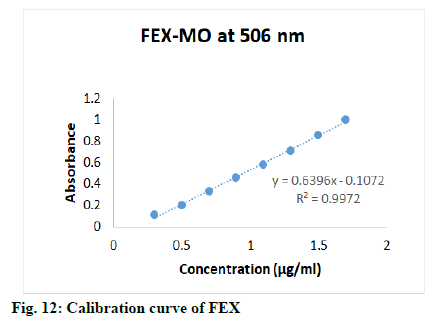
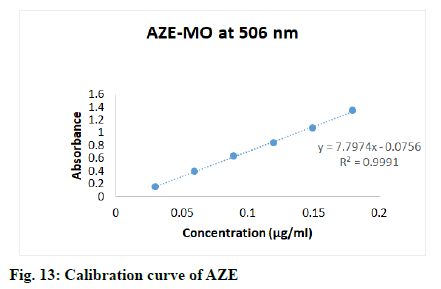
Appropriate aliquots (0.3, 0.5, 0.7, 0.9, 1.1, 1.3, 1.5 and 1.7 ml) stock solution of FEX were transferred to 10 ml volumetric flasks, then added 2.0 ml of 0.2 M HCl followed by 2.0 ml of KBr-KBrO3 mixture to each flask, keep the all flasks for 55 min at least to complete bromination of drug, lastly added 2.0 ml of methyl orange dye and diluted up to mark with double distilled water to obtain final concentrations 0.3-1.7 μg/ml. Appropriate aliquots (0.3, 0.6, 0.9, 1.2, 1.5 and 1.8 ml) stock solution of AZE were transferred to 10 ml volumetric flasks, then added 1.5 ml of 0.1 M HCl followed by 4.0 ml of KBr-KBrO3 mixture to each flask, keep the all flasks for 30 min at least to complete bromination of drug, lastly added 2.5 ml of methyl orange dye and diluted up to mark with double distilled water to obtain final concentrations 0.03-0.18 μg/ml. The solutions were mixed well and scanned in the visible range (400-800 nm, fig. 10), absorbances were recorded at wavelength of maximum absorbance (λmax) (506 nm). Calibration curves were constructed (fig. 11-fig. 13) by plotting absorbances versus concentrations of drugs and regression equations was computed.
Analysis of marketed formulation:
Accurately transferred 0.1 ml OLO nasal spray solution to 100 ml volumetric flask diluted up to the mark with double distilled water. Dissolve 1 FEX tablet powder to 100 ml volumetric flask, sonicate for 30 min to completely dissolve FEX and filter properly and diluted up to mark with double distilled water, dilute the above solution to obtain final concentration 10 μg/ml. Accurately transferred 0.5 ml AZE nasal spray solution to 100 ml volumetric flask diluted up to mark with double distilled water. Transferred 1 ml of sample solutions to 10 ml separate volumetric flask and followed the optimized procedure to obtain coloured product. Absorbance of obtained solution was measured at 506 nm and the concentration of the unknown was read from the calibration graph or calculated from the regression equation derived from Beer’s law.
Method validation:
The proposed method was validated as per the ICH guideline Q2R1, for the parameters like accuracy, linearity, precision, detection limit and quantitation limit. The linearity of the method was performed with the concentrations 0.2-1.2 μg/ml, 0.3-1.7 μg/ml and 0.03-0.18 μg/ml of OLO, FEX and AZE respectively. Calibration curves were constructed by plotting absorbances versus concentrations of drug and regression equations was computed (Table 1).
| Parameters | OLO | FEX | AZE |
|---|---|---|---|
| Wavelength (nm) | 506 nm | 506 nm | 506 nm |
| Beer’s law limit (µg/ml) | 0.2-1.2 | 0.3-1.7 | 0.03-0.18 |
| Regression equation | |||
| y=mx+c | y=0.9553x+0.0165 | y=0.6396x-0.1072 | y=7.7974x- 0.0756 |
| Slope (m) | 0.9553 | 0.6396 | 7.7974 |
| Intercept (c) | 0.0165 | 0.1072 | 0.0756 |
| Correlation coefficient (r2) | 0.9995 | 0.9972 | 0.9991 |
Table 1: Regression Data for Calibration Curve
The method precision (repeatability of the instrument was checked by repeated scanning (n=6) and measuring the absorbance of solution of OLO (0.6 μg/ml), FEX (1 μg/ml) and AZE (0.06 μg/ml) without changing the parameter of the method. Also, the intra-day and interday precision of the proposed method was evaluated by analyzing the corresponding responses 3 times on the same day and on 3 different days over a period of 1 w for 3 different concentrations of sample solutions of OLO (0.4, 0.6 and 0.8 μg/ml), FEX (0.6, 0.8 and 1.0 μg/ml) and AZE (0.06, 0.09 and 0.12 μg/ml). The results were reported in terms of percentage relative standard deviation (% RSD).
The Limit of Detection (LOD) and Limit of Quantitation (LOQ) were calculated using following formulae: LOD=3.3 (SD)/S and LOQ=10 (SD)/S, where SD=standard deviation of response and S=average of the slope of the regression line.
The accuracy of the method was determined by calculating recoveries by the standard addition method[13]. Known amounts of standard solution of OLO and FEX were added at 50 %, 100 % and 150 % levels to pre quantified sample solutions of drugs. Where, AZE was added at the known amount of 80 %, 100 % and 120 % levels to pre quantified sample solutions of drugs.
Results and Discussion
Bromate-bromide mixture in acid medium shows as an equivalent solution of bromine and has been widely used for the assay of several organic and bio active pharmaceutical compounds. The proposed method describes the in situ generation of bromine by the action of the hydrochloric acid on KBr-KBrO3 mixture. In the present method varying concentrations of drug solutions were reacted with a fixed and known excess amount of generated bromine in hydrochloride acid medium and after a predetermined time, the un-reacted bromine is determined by treating with a known fixed amount of methyl orange and measuring the absorbance at 506 nm (fig. 8). A linear relation has been found between absorbance and concentration of drugs which formed the basis for quantification of the drug.
The calibration curve was found to be linear over the range of 0.2-1.2 μg/ml, 0.3-1.7 μg/ml and 0.03-0.18 μg/ml for OLO, FEX and AZE respectively. The data of regression analysis of the calibration curves is shown in Table 1. The proposed method was successfully applied to the determination of pharmaceutical dosage forms of respective drugs. The results were comparable with the corresponding labelled amounts. The developed method was also found to be linear. The results of repeatability data was found to be 0.25, 0.31 and 0.30 RSD values for OLO, FEX and AZE respectively, low value of RSD indicates that proposed method is repeatable. The RSD values for inter-day precision were 1.32-1.79, 1.14- 1.88 and 0.43-1.70, while for intra-day precision were 0.57-1.30, 0.73-1.05 and 0.66-1.22 for OLO, FEX and AZE respectively. The RSD values of intermediate precision less than 2 indicates the propose method is reproducible.
The LOD value was found to be 0.01, 0.02. 0.0015 μg/ ml of OLO, FEX and AZE respectively, while LOQ value was 0.04, 0.07, 0.0045 μg/ml of OLO, FEX and AZE respectively. The results of recovery studies (Table 2) were 98.83±0.40, 98.68±0.63 and 102.6 ±0.87 % of OLO, FEX and AZE respectively. Findings of all validated parameters are summarized in Table 3. The proposed study, spectrophotometric method was developed for the estimation of H1 receptor antagonists and validated as per ICH guidelines.
| Drug | Level | Amount present (µg/ml) | Amount added (µg/ml) | % Mean recovery±*SD |
|---|---|---|---|---|
| OLO | I | 0.3694 | 0.2 | 98.37±1.42 |
| II | 0.3694 | 0.4 | 99.12±0.73 | |
| III | 0.3694 | 0.6 | 98.99 ±1.00 | |
| FEX | Level | Amount present (mg/tablet) | Amount added (mg) | % Mean recovery±*SD |
| I | 59.56 | 30.00 | 97.64±1.43 | |
| II | 59.56 | 60.00 | 98.94±1.56 | |
| III | 59.56 | 90.00 | 96.68±0.64 | |
| AZE | Level | Amount present (µg/ml) | Amount added (µg/ml) | % Mean recovery±*SD |
| I | 0.05 | 0.04 | 101.6±1.00 | |
| II | 0.05 | 0.05 | 102.4±1.48 | |
| III | 0.05 | 0.06 | 102.6±0.87 |
*SD: Standard Deviation
Table 2: Accuracy Data
| Parameters | OLO | FEX | AZE |
|---|---|---|---|
| Wavelength (nm) | 506 nm | 506 nm | 506 nm |
| Beer’s law limit (µg/ml) | 0.2-1.2 | 0.3-1.7 | 0.03-0.18 |
| Regression equation | |||
| y=mx+c | y=0.9553x+0.0165 | y=0.6396x-0.1072 | y=7.7974x-0.0756 |
| Slope (m) | 0.9553 | 0.6396 | 7.7974 |
| Intercept (c) | 0.0195 | 0.1072 | 0.0756 |
| Correlation coefficient (r2) | 0.9995 | 0.9972 | 0.9991 |
| Method precision | 0.25 | 0.31 | 0.3 |
| Repeatability (n=6, % *RSD) | |||
| Interday precision (n=3, % *RSD) | 1.32-1.79 | 1.14-1.88 | 0.43-1.70 |
| Intraday precision (n=3, % *RSD) | 0.57-1.30 | 0.73-1.05 | 0.66-1.32 |
| LOD (µg/ml) | 0.01 | 0.02 | 0.001 |
| LOQ (µg/ml) | 0.04 | 0.07 | 0.004 |
| % Recovery±*SD (n=3) | 99.33±0.96 | 98.42±0.70 | 97.84±0.90 |
| Assay±*SD (n=3) | 98.24±1.36 | 97.71±1.30 | 102.2±0.54 |
*SD: Standard Deviation; *RSD: Relative Standard Deviation
Table 3: Summary of Validation Parameters for an Innovative Spectrophotometric Method for the Estimation of H1 Receptor Antagonist in Pharmaceutical Formulations
Statistical analysis proved that method was accurate, precise and repeatable. The developed method was found to be simple, sensitive and inexpensive for analysis. The method was successfully used for determination of drug in a pharmaceutical formulation. Assay (Table 4) results for nasal spray formulation of OLO using proposed method showed 98.42±0.47 %, tablet of FEX contains 97.71±0.71 and nasal spray formulation of AZE contains 97.84±0.90.
| Sample No. | OLO | FEX | AZE | |||
|---|---|---|---|---|---|---|
| Label claim (µg/spray) |
% Label claim (%) | Label claim (mg/tablet) |
% Label claim (%) | Label claim (% w/v) |
% Label claim (%) | |
| 1 | 665 | 98.76 | 60 | 99.27 | 0.1 | 97.54 |
| 2 | 665 | 97.84 | 60 | 98.09 | 0.1 | 97.82 |
| 3 | 665 | 98.28 | 60 | 98.56 | 0.1 | 98.41 |
| 4 | 665 | 98.57 | 60 | 95.51 | 0.1 | 96.08 |
| 5 | 665 | 99.07 | 60 | 97.05 | 0.1 | 98.95 |
| 6 | 665 | 98.00 | 60 | 97.78 | 0.1 | 98.21 |
| Mean | 98.42 | Mean | 97.71 | Mean | 97.84 | |
| *SD | 0.465 | *SD | 1.30 | *SD | 0.902 | |
*SD: Standard Deviation
Table 4: Assay Results for Nasal Spray Formulation
Acknowledgements:
The authors thank USV Pvt. Ltd., Mumbai, India for providing OLO, Camper healthcare, Gujarat, India for providing FEX and Intas pharmaceuticals, Gujarat, India for providing AZE as gift samples for this work. We also thank Dr. D. B. Patel, Scientific advisor, Dr. R. K. Patel, Principal and Dean, Prof. P. U. Patel, HOD of Pharmaceutical chemistry department and the entire team of Shree S. K. Patel College of Pharmaceutical Education and Research, Ganpat University for providing required facilities to carry out this research work.
References
- Rajan VR. UV-Spectrophotometric estimation of olopatadine hydrochloride in bulk and pharmaceutical dosage form by area under curve and second order derivative methods. Res J Pharm Technol 2015;8(3):265-9.
- Indian Pharmacopoeia, 2018. Government of India: Ministry of Health and Family Welfare. The Indian Pharmacopoeia Commission, Ghaziabad, 8th ed. 2018;3:2779-83.
- U.S. Pharmacopeia-National Formulary, (USP 36-NF 31) 2013. The United State Pharmacopeial Convention, 12601 Twinbrook Parkway, Rockville, MD 20852, 2013;3:4567-74.
- O’Neil MJ. The Merck index: an encyclopedia of chemicals drug and biological. Fexofenadine. Merck & Co. Inc. 14th ed. 2006; 4113, 819.
- Indian Pharmacopoeia, 2018. Government of India: Ministry of Health and Family Welfare. The Indian Pharmacopoeia Commission, Ghaziabad, 8th ed. 2018;2:2053-56.
- U.S. Pharmacopeia-National Formulary, (USP 36-NF 31) 2013. The United State Pharmacopeial Convention, 12601 Twinbrook Parkway, Rockville, MD 20852, 2013;2: 3573-78.
- British Pharmacopoeia, the Department of Health, Social Services and Public Safety. Fexofenadine hydrochloride. The stationary office on behalf of the medicines and healthcare products regulatory agency 2010;1:882-4.
- European Pharmacopoeia 6.0. Starboury, Quarterly forum Publication. Council of Europe 2008;1888-90.
- O’Neil MJ. The Merck index: an encyclopedia of chemicals drug and biological. Azelastine. Merck & Co. Inc. 14th ed. 2006; 2184, 432.
- Indian Pharmacopoeia, 2018. Government of India: Ministry of Health and Family Welfare. The Indian Pharmacopoeia Commission, Ghaziabad, 8th ed. 2018;2:1303-04.
- British Pharmacopoeia, the Department of Health, Social Services and Public Safety. Azelastine HCl. The stationary office on behalf of the medicines and healthcare products regulatory agency 2010;1:199-200.
- European Pharmacopoeia 6.0. Starboury, Quarterly forum Publication. Council of Europe 2008;1236-38.
- Jain D, Basniwal PK. Spectrophotometric determination of olopatadine hydrochloride in eye drops and tablets. J Pharm Res 2013;12(2):48-52.
- Bhanu P, Thangabalan B. Estimation of Olopatadine HCl by RP-HPLC and UV spectrophotometric method in pure and pharmaceutical formulations. Int J Pharm Anal Res 2014;3(4):434-44.
- Gazy AA, Mahgoub H, El-Yazbi FA, El-Sayed MA, Youssef RM. Determination of some histamine H1-receptor antagonists in dosage forms. J Pharm Biomed Anal 2002;30(3):859-67.
- Patel Rina B, Patel Bhavika B. Development and validation of first order derivative spectrophotometric method for simultaneous estimation of fluticasone propionate and azelastine hydrochloride in nasal spray preparations. Inventi Rapid: Pharm Anal 2013;3:1-5.
- Gupta VK, Jain R, Radhapyari K, Jadon N, Agarwal S. Voltammetric techniques for the assay of pharmaceuticals-a review. Anal Biochem 2011;408(2):179-96.
- Sreedhar NY, Sreenivasulu A, Kumar MS, Nagaraju M. Voltammetric determination of olopatadine hydrochloride in bulk drug form and pharmaceutical formulations. Int J Pharm Sci Res 2012;3(7):2517-21.
- Abdel-Razeq SA, Foaud MM, Salama NN, Abdel-Atty S, El-Kosy N. Voltammetric determination of azelastine-HCl and emedastine dirumarate in micellar solution at glassy carbon and carbon paste electrodes. Sens electroanalysis 2011;6:289-305.
- Lakshmi Narasimha Rao K, Sudheer Babu K, Soloman Raju K, Padmaja Reddy K. Simultaneous estimation of azelastine hydrochloride, fluticasone propionate, phenylethyl alcohol, benzalkonium choride by RP-HPLC method in nasal spray preparations. Int J Res Pharm Sci 2007;1:473-80.
- Langevin CN, Pivonka J, Wichmann JK, Kucharczyk N, Sofia RD. High performance liquid chromatographic determination of azelastine and desmethylazelastine in guinea pig plasma and lung tissue. Biomed Chromatogr 1993;7(1):7-11.
- Park YS, Kim SH, Kim YJ, Yang SC, Lee MH, Shaw LM, et al. Determination of azelastine in human plasma by validated liquid chromatography coupled to tandom mass spectrometry (LC-ESI/MS/MS) for the clinical studies. Int J Biomed Sci 2010;6(2):120-7.
- Fujita K, Magara H, Kobayashi H. Determination of olopatadine, a new antiallergic agent, and its metabolites in human plasma by high-performance liquid chromatography with electrospray ionization tandem mass spectrometry. J Chromatogr B 1999;731(2):345-52.
- Fujimaki K, Lee XP, Kumazawa T, Sato J, Sato K. Determination of some antiallergic drugs in human plasma by direct-injection high-performance liquid chromatography-tandem mass spectrometry. Forensic Toxicol 2006;24(1):8-16.
- Wei L, Hui Z, Dong-yang LI, Pei HU, Ji JI. Quantitative determination of olopatadine in human plasma by high-performance liquid chromatography-tandem mass spectrometry. J Chin Mass Spectrom Soc 2006;27(4):193-7.
- Ulavapalli KR, Sriramulu J, Mallu UR, Bobbarala V. Simultaneous determination of psuedoephedrine, fexofenadine and loratadine in pharmaceutical products using high resolution RP-HPLC method. J Pharm Res 2011;4(4):1219-21.
- Konieczna L, Plenis A, Oledzka I, Kowalski P, Baczek T. Rapid RP-LC method with fluorescence detection for analysis of fexofenadine in human plasma. Chromatographia 2010;71(11):1081-6.
- Arayne MS, Sultana N, Shehnaz H, Haider A. RP-HPLC method for the quantitative determination of fexofenadine hydrochloride in coated tablets and human serum. Med Chem Res 2011;20(1):55-61.
- Mahajan A, Gandhi PS, Pandita N, Gandhi SV, Deshpande PB. Validated high performance thin layer chromatographic method for estimation of olopatadine hydrochloride as bulk drug and in ophthalmic solutions. Int J Chem Tech Res 2010;2(3):1372-5.
- Rele RV, Patil SP. Reversed phase ultra-performance liquid chromatography method for determination of olopatadine hydrochloride from active pharmaceutical dosage form. Der Pharmacia Sinica 2014;5(1):18-22.
- Guo D, Zou J, Zhu Y, Lou S, Fan H, Qin Q. Measurement of fexofenadine concentration in micro‐sample human plasma by a rapid and sensitive LC‐MS/MS employing protein precipitation: application to a clinical pharmacokinetic study. Biomed Chromatogr 2010;24(3):335-41.
- Dey S, Reddy YV, Swetha B, Kumar SD, Murthy PN, Sahoo SK, et al. Method development and validation for the estimation of olopatadine in bulk and pharmaceutical dosage forms and its stress degradation studies using UV–VIS spectrophotometric method. Int J Pharm Pharm Sci 2010;2(14):212-8.
- ICH Harmonised Tripartite Guideline. Validation of Analytical Procedures: Text and Methodology Q2(R1). Proceedings of the International convention on quality for the pharmaceutical industry, European Union, Japan and USA; 2005.
- Hosny M, Anis M. Spectrophotometric determination of olopatadine HCl in pharmaceutical formulation. Anal Chem Indian J 2011; 10(7): 419-29.
- Vijayakumar B, Seethamma M, Venkateshwarlu G. Spectrophotometric determination of drugs based on oxidation by using bromate-bromide mixture and methyl orange dye. IOSR J Appl Chem 2016;9(2):62-8.
