- *Corresponding Author:
- Manjula Shantaram
Department of Studies & Research in Biochemistry
Mangalore University, Jnana Kaveri Post Graduate Centre
Chikka Aluvara, Kodagu-571 232
E-mail: manjula59@gmail.com
| Date of Received | 09 February 2020 |
| Date of Revision | 23 May 2020 |
| Date of Acceptance | 21 June 2020 |
| Indian J Pharm Sci 2020;82(4):601-611 |
This is an open access article distributed under the terms of the Creative Commons Attribution-NonCommercial-ShareAlike 3.0 License, which allows others to remix, tweak, and build upon the work non-commercially, as long as the author is credited and the new creations are licensed under the identical terms
Abstract
The aim of the present study was to evaluate the total phenolic and flavonoid content, acetylcholinesterase inhibitory and antioxidant activity of Olea dioica. Some bioactive chemical constituents were characterized through GC-MS, LC-MS analyses. Methanol leaf extract of Olea dioica exhibited antioxidant property and acetylcholinesterase inhibition activity. Results showed that the plant extract could provide a significant source of secondary metabolites that could act as natural acetylcholinesterase inhibitors and antioxidants, which might be useful to treat Alzheimer’s disease.
Keywords
Alzheimer’s disease, Olea dioica Roxb., HPTLC, Acetylcholinesterase, TLC, GC-MS, LC-MS, FT-IR
Karnataka is part of a highly biodiverse-rich region of India. The Western Ghats region is one of the mega-biodiverse regions of the world. A study by the Botanical Survey of India indicated the presence of 3824 species belonging to 1223 genera and more than 200 families in the forests of the state, of which 1493 species have medicinal value [1]. The medicinal plants are the most valuable natural resources. Scientific documentation of medicinal plants has proven to be a helpful resource for the ancient Rigveda, Atharvaveda and Ayurvedic healthcare system, which is widely practised in India even today. Herbal drugs are used as household remedies for common ailments since time immemorial. The traditional system of medicine acts as a major part in the healthcare of rural population for all types of ailments [2]. Medicinal plants are potential renewable natural resources and are generally considered to have a beneficial role in human well-being [1,3]. Several parts of herbs for example roots, leaves, stem, bark, flowers and fruits are rich in phenolics, flavonoids, alkaloids and other secondary metabolites. The pharmacological properties of each plant are due to their active principles. The advantages of medicinal plant are their easy availability and low cost [4,5]. Plant-based products are less expensive and have fewer side effects [5-7].
Alzheimer’s disease (AD) is associated with dysfunction of cortical cholinergic neurotransmission. The currently known acetylcholinesterase inhibitors, physostigmine, donepezil, and galantamine, have shown improvement in Alzheimer’s patients [8]. One of the most studied areas of research has been the study of plants with an acetylcholinesterase (AChE) action [9]. Extensive data exhibit that AChE inhibitors can delay the development of AD. Plant-based compounds have been well accepted for the treatment of mental dysfunctions connected with AD. To understand the possible role of Olea dioica Roxb., in neurodegenerative ailments, the present study examined the antiAChE activity of O. dioica plant extracts, and according to the literature survey performed antiAChE activity has not been reported so far. As part of a programme to search for new bioactive constituents from O. dioica, the focus of this study was to establish innovative sources of AChE inhibitors, useful in treating AD [9-11]. It is believed that O. dioica could be a potential candidate for developing as an alternative strategy for AChE inhibition in AD.
Materials and Methods
Preparation of plant extract:
The O. dioica plants were collected from Pilikula, Mangalore, Karnataka and were washed twice with distilled water and allowed to dry for 23 d and made into a fine powder. Fifty grams of the powder was Soxhlet-extracted with methanol for 12 h and the extract was stored in brown bottles at room temperature (RT).
Phytochemical screening:
The leaf extract was screened for the presence of phytochemicals like alkaloids, steroids, triterpenoids, flavonoids, proteins, phenolic compounds, carbohydrates, reducing sugars and saponins using standard methods [12].
Alkaloids:
Mayer’s test was employed. The extract was treated with Mayer’s reagent, which led to the formation of an yellow precipitate indicating the presence of alkaloids. Wagner’s test was performed by treating the extract with Wagner’s reagent, which is iodine in potassium iodide. Emergence of a brown to reddish precipitate indicated the presence of alkaloids.
Saponins and coumarins:
Foam test was performed with 1-2 ml of the plant extract, which was shaken with 2 ml of water and persistent production of foam for 10 min indicated the presence of saponins. Coumarins were detected using the NaOH test. The plant extract was added to 10 % NaOH followed by the addition of chloroform. Development of an yellow colour indicated the presence of coumarin.
Flavonoids:
Dilute ammonia solution (4-5 ml) was added to a part of the plant extract followed by concentrated sulphuric acid. The formation of yellow colour indicated the presence of flavonoids. A few drops of the extract was taken and a small amount of zinc dust was added followed by concentrated HCl along the wall of the test tube. The formation of magenta colour indicated the presence of flavonoids.
Steroids and triterpenoids:
Triterpenoids were detected with Salkowski test, in which chloroform was added to 4-5 ml of the extract followed by the addition of 2-5 drops of concentrated H2SO4. Appearance of a red colour upon standing for a few minutes indicated the presence of steroids and the formation of yellow colour indicated the presence of triterpenoids.
Phenolic compounds and proteins:
A small quantity of the extract was dissolved in Milli Q water, to which 1-3 ml of 5 % FeCl3 solution was added. The development of green or blue colour indicated the presence of phenolic compounds. Biuret protein test was performed by adding to 1-2 ml of plant extract, 4 % NaOH and 3-4 drops of 1 % copper sulphate solution. A violet or pink colour indicated the presence of protein.
Carbohydrates and reducing sugars
Molisch test was employed, 2-3 ml of methanol extract was taken, a few drops of alpha-naphthol solution was added, mixed and concentrated sulphuric acid was added to this mixture. Formation of a violet ring indicated the presence of carbohydrates. One to 2 ml each of Fehling’s solutions were taken, mixed and the mixture was boiled for 1-2 min, followed by the addition of equal volume of plant extract and heated in a water bath for 6-7 min. The development of brick-red precipitate indicated the presence of reducing sugars in the plant extract.
Column chromatography and UV analysis:
The crude extract obtained from Soxhlet extraction was subjected silica gel (60-120 mesh) column chromatography (10×2 cm column) [14,15]. The adsorbed extract was eluted with hexane and ethyl acetate in the ratio of 3:2 at a flow rate of 3 ml/min. Fifteen fractions were collected and the second fraction (F2) was further analysed as it had exhibited positive antioxidant activity. The O. dioica leaf crude extract and F2 fraction were dissolved in the eluent and scanned on a UV/Vis spectrophotometer (Beckman Coulter, USA) in the range of 200-1000 nm [13].
Determination of total phenolic content of the F2 fraction:
For the determination of total phenolic content the Folin-Ciacalteu (FC) method was used [12] in which 0.2 ml of F2 fraction (20 μg/ml) was mixed with 0.1 ml FC reagent diluted with Milli Q water (2:20 v/v) and 0.1 ml (37.5 g in 500 ml) of sodium carbonate solution. The mixture was vortexed for 10-20 s and allowed to stand for 20-25 min at RT for colour development. Absorbance was measured at 765 nm on a UV-spectrophotometer. Total phenolic content was expressed as mg/g standard gallic acid equivalent using the following equation based on the calibration curve, y=0.1226x, where x is the absorbance and y is the standard gallic acid equivalents in mg/g. This assay was carried out in triplicate.
Determination of total flavonoids:
Estimation of the total flavonoids in the F2 fraction was done using a colorimetric method [16,17]. Two hundred microlitres of F2 fraction (20 μg/ml) was added to a clean test tube containing 2 % AlCl3 solution (0.5 ml) and 0.25 ml of distilled water. It was incubated for 50-60 min at RT and the absorbance was measured at 510 nm. Total flavonoid content was calculated as quercetin equivalents (1 mg/ml). The following equation based on the calibration curve was used, y = 0.0265x, R2 = 0.9222, where x is the absorbance and y, is the quercetin equivalent (mg/g).
2,2-diphenyl-1-picryl-hydrazyl-hydrate (DPPH) assay:
The antioxidant activity was determined using the Brand-Williams method [18] with a slight modification and DPPH was freshly prepared by dissolving 6 mg of DPPH in 25 ml methanol. The F2 fraction was taken at various concentrations (20, 40, 60, 80, and 100 μg/ml) and diluted with dimethyl sulfoxide (DMSO) to get test sample solutions. The reaction mixture was measured at 517 nm after incubating at RT in dark for 30 min. Quercetin was used as a positive control. The free radical scavenging activity of F2 fraction was determined by comparing its absorbance with that of a blank solution. The DPPH radical scavenging activity was expressed as % inhibition and calculated using the following Eqn, % inhibition of DPPH radical = Ab–As/ Ab×100.
Ferric-reducing antioxidant power (FRAP) assay:
The antioxidant capacity of F2 fraction was estimated using UV spectrophotometer following the method of Benzie and Strain [19] with a slight modification. The assay reagent was prepared by mixing 150 mM of sodium acetate buffer (pH 3.6), 20 ml of TPTZ in 40 mM hydrochloric acid and 20 mM ferric chloride hexahydrate (FeCl3.6H2O) in the proportion of 10:1:1 at RT. Working reagents were freshly prepared. To a working FRAP reagent (3.95 ml), 5 μl F2 fractions at different concentrations (20, 40, 60, 80 and 100 μg/ml) was added and mixed carefully and incubated at RT for 30 min. A passionate blue-colour complex was formed, and the absorbance was measured at 593 nm against the blank.
Thin layer chromatography (TLC):
The targeted fraction was collected from column chromatography and subjected to TLC for purification of bioactive compounds. TLC plates were prepared using 20×20 cm glass plates, the thickness of the coated silica gel was 0.2 mm and the coated plates were activated in a hot air oven at 90-120° for 30 min. Approximately 15-20 ml of the sample was loaded using capillary tubes and the dried plates were placed in a TLC chamber charged with the desired mobile phase of chloroform:methanol in 95:5 ratio [20].
High-performance thin-layer chromatography (HPTLC):
The F2 fraction was used in HPTLC analysis [21]. Readymade silica gel 60 F254 TLC plate, 20×20 cm and 20.0 μl of the F2 fraction sample was loaded on the plate (ATS 4, Camag, Muttenz, Switzerland). The F2 fraction sampleloaded TLC plate was kept in the HPTLC chamber with standardised mobile (chloroform:methanol, 95:5) phase up to 90 mm (terpenoids, phenolics, and glycosides). The developed TLC plate was dried in a hot air oven to evaporate the solvent. The TLC plate images were taken in visible light, 254 and 366 nm.
Gas chromatography-mass spectrometry (GC-MS) analysis:
The semi-purified F2 fraction obtained from O. dioica was analysed by a GC-MS (GCMS-S80, Shimadzu) [21]. The F2 fraction was injected in split mode at 220° and the transfer line was set to 240°. Helium was used as the carrier gas at a constant flow rate of 1 ml/min. The temperature was ramped up from 60 to 260° at a rate of 3°/min and then exposed at 260° for 60 min in full scan mode, m/z (mass-to-charge ratio) 20-600. Electron impact ionisation was employed (70 eV), and the MS ion source was maintained at 240°.
Liquid chromatography-mass spectrometry (LC-MS) analysis:
LC-MS instrument (Agilent 1100 LC, Bruker-make MS model Esquire 3000) having quadra pole time of flight mass equipped with electrospray ionisation (ESI) and atmospheric pressure chemical ionisation (APCI) and PDA detector source having a mass range of 100 amu in quadruple and 10 000 amu in TOF was used to detect the m/z ratio and the MS of the plant F2 fraction [22].
Acetylcholinesterase inhibition by bioautography method:
The AChE inhibitory activity was qualitatively evaluated by bioautographic method [14] in which acetylcholinesterase inhibitory activity of F2 fraction was determined using TLC. On the Silica gel-coated TLC plate, (2.5 mm F254, 10×10 cm, Merck, Germany) 1 mg/ml F2 fraction was spotted and developed with standard mobile-phase chloroform:methanol (95:5), and dried at RT. After developed TLC plates were sprayed with freshly prepared enzyme solution (3 U/ml; Electric eel AChE enzyme, Sigma-Aldrich), incubated at RT for 3 min. Later, they were sprayed with 3 mM DTNB or Ellman’s reagent and 15 mM acetylcholine iodide (ACHI) solution in phosphate buffer until saturation level was reached. Later, the plates were dried at RT for 1 min to develop colourless or white spots over yellow background as acetylcholinesterase inhibition zones [23].
Acetylcholinesterase assay by spectrophotometric method:
The AChE inhibition activity was determined by Ellman method [24-30] with a slight modification in the method. Briefly, 2 ml of 0.1M Tris-HCl buffer (pH 8.0), 100 μl of plant sample at different concentrations (20-100 mg/ ml) and 20 μl AChE (3 U/ml) solution were mixed and incubated for 5-10 min at RT and later 50 μl of 3 mM DTNB was added to the mixture. The reaction was then initiated by the addition of 50 μl of acetylthiocholine iodide (15 mM) when yellow colour appears. Galantamine (1 mg/ml) was used as a positive control. The absorbance of the mixture was measured at 412 nm on a UV/Vis spectrophotometer (Beckman Coulter, USA).This assay was carried out in triplicate. Percent inhibition of enzyme activity was calculated using the Eqn., % inhibition = A0−A1/A0×100, where A0 was the absorbance of the control and A1, the absorbance of the sample. Tests were carried out in triplicate and data were analysed using descriptive statistics.
Fourier-transform infrared spectroscopy (FTIR):
The functional groups on the F2 fraction of the leaf extract were characterised by FTIR analysis (Bruker) and the spectra were scanned in the range of 3500- 500 cm−1. The sample was prepared by dispersing the F2 fraction uniformly in a matrix of KBr (potassium bromide). The intense bands were compared with standard values to recognise the functional groups.
Results and Discussion
The phytochemicals of the methanol extracts of O. dioica (fig. 1A) leaf extract are presented in Table 1. The sample contained flavonoids, triterpenoids, saponins, coumarins, phenolic compounds but sugars, proteins, and steroids were absent. The UV/Vis spectral analysis was performed to identify phytoconstituents present in the methanol extract (crude) and the F2 fraction of O. dioica at 200 to 1000 nm wavelength for the proper baseline. The spectra lead to the identification of π-bonds, σ-bonds, chromophores and aromatic rings in the constituents. The plant extract gave absorption peaks between 200-1000 nm (fig. 1A and B). The region from 200-400 nm indicated the presence of heteroatoms such as S, O, N, and unsaturated groups. Absorption peaks at 200-400 nm represented presence of flavonoids and their derivatives [21]. There are typically two absorption maxima for flavonoids in the range of 230-285 and 300-350 nm. But a range of 270-670 nm is reported for the presence of phenolic acid, flavonoids, flavanol, and alkaloids (Table 1). The crude extract and column fraction contained phenolic acid, flavonoids, flavanol, and alkaloids. Separation of the mixture and determination of purity of the separated compounds were accomplished by column chromatography and TLC. Different fractions were collected for AChE inhibition assay. TLC was also used for the separation of plant mixture and isolation of bioactive compounds by the preparative method and standard mobile phase (Table 2).
| Plant crude extract and F2 fraction | Absorbance range | Type of compound present |
|---|---|---|
| 200-300 nm | Flavonoids and their derivatives | |
| 400-700 nm | Phenolic acid, flavonoids, flavanols and alkaloids | |
| Phenolics | ++ | |
| Saponins | + | |
| Triterpenoids | + | |
| Alkaloids | ++ | |
| Coumarins | + | |
| Flavonoids | ++ | |
| Carbohydrates and Reducing sugars | - | |
| Proteins | - | |
‘+’ indicates the presence and ‘-’ the absence of phytoconstituents
Table 1: Phytochemical Analysis of Methanol Extract
| Mobile phase | Ratio | Number of bands | Rf Value in cm |
|---|---|---|---|
| Chloroform:methanol | 90:10 | 4 | 0.5,0.52,0.63,0.65 |
| Chloroform:methanol | 95:5 | 6 | 0.2,0.5,0.52,0.60,0.63,0.75 |
| Chloroform:methanol | 80:20 | 2 | 0.6,0.65 |
Table 2: Different TLC Mobile Phases

Figure 1: UV absorbance spectra
UV absorbance spectra of A. leaf extracts and B. F2 fraction
The phenolic content of the F2 fraction, calculated from the standard gallic acid calibration curve (R2=0.973), was 20 μg/ml with GAE/g. Flavonoids in methanol leaf extract were found to be 12.3 μg/ml QE/g of dry sample. Leaf extract contained more phenolic compounds compared to flavonoids.
DPPH and FRAP assays with colorimetric and spectrophotometric methods, respectively, were stable with free radical absorption at 515 and 593 nm. The colour changed significantly from deep violet to pale yellow and absorbance of reaction mixture significantly decreased indicating major antioxidant activity of the plant sample. The methanol F2 fraction showed good scavenging activity (DPPH, fig. 2A; FRAP, fig. 2B).

Figure 2: Antioxidant activity of F2 fraction in DPPH and FRAP
assays
Antioxidant activity of F2 fraction in A. DPPH assay and B.
FRAP assay, % inhibition of F2 fraction compared
to quercetin
compared
to quercetin
HPTLC is one of the most commonly used methods for analysis in clinical chemistry, pharmaceutical industry, biochemistry, forensic chemistry, food and drug, and other areas. The benefits of HPTLC included presentation of the results as an image, low cost of operation, large sample size, parallel analysis of samples, the possibility of multiple detections and rapidity in obtaining results. In plant biochemistry, plant compounds can be identified and exact Rf value obtained easily (Table 3). In the HPTL chromatogram of methanol extract images showed different bands in visible light, at 254 nm and at 366 nm (fig. 3).
| Peak | Start position Rf | Max Rf | Max height AU | Area % |
|---|---|---|---|---|
| 254 nm | ||||
| 0.01 | 0.03 | 51.4 | 1.84 | |
| 0.04 | 0.06 | 75.0 | 3.99 | |
| 0.10 | 0.12 | 51.6 | 2.44 | |
| 0.19 | 0.20 | 12.8 | 0.56 | |
| 0.27 | 0.32 | 19.5 | 2.43 | |
| 0.37 | 0.38 | 33.8 | 1.00 | |
| 0.54 | 0.57 | 22.2 | 2.28 | |
| 0.67 | 0.69 | 23.5 | 1.91 | |
| 0.72 | 0.75 | 35.2 | 5.37 | |
| 0.81 | 0.83 | 33.1 | 3.41 | |
| 0.89 | 0.93 | 44.5 | 4.46 | |
| 0.94 | 0.97 | 57.9 | 6.47 | |
| 1.04 | 1.13 | 330. | 63.83 | |
| 366 nm | ||||
| 0.01 | 0.02 | 25.1 | 0.73 | |
| 0.05 | 0.07 | 21.3 | 1.33 | |
| 0.14 | 0.17 | 32.0 | 1.92 | |
| 0.18 | 0.20 | 92.0 | 5.12 | |
| 0.28 | 0.32 | 61.5 | 4.92 | |
| 0.41 | 0.46 | 11.6 | 0.96 | |
| 0.52 | 0.56 | 128.6 | 11.93 | |
| 0.62 | 0.64 | 32.6 | 2.93 | |
| 0.89 | 0.93 | 25.0 | 2.34 | |
| 0.95 | 0.97 | 39.4 | 3.16 | |
| 1.00 | 1.04 | 56.1 | 6.74 | |
| 1.06 | 1.14 | 439.2 | 57.91 | |
Detected peaks, their corresponding max Rf values on TLC plate, max height (AU) and calculated percent area of the bands at wavelengths, 256 and 366 nm
Table 3: HPTL Chromatogram of Methanol Extract at 254 and 366 Nm

Figure 3: HPTL chromatogram of methanol extract
Images showing different bands in a. visible light, b. at 254 nm
and c. at 366 nm, mobile phase used was chloroform:methanol
(95:5)
The GC-MS analysis of the F2 fraction of O. dioica (fig. 4A) showed different peaks, which indicated presence of different phytochemical constituents in this fraction. A comparison of the MS of the constituents with the NIST library showed that eight phytocompounds could be identified and characterised (Table 4). The MS of all the plant phytochemicals was identified in the F2 fraction of O. dioica. LC-MS also showed different peaks (fig. 4B) and the masses compared with the NIST library to identify 4 compounds (Table 5).
| Compound | Formula | Component Area | Match Factor | Component RT | Biological activity | Structure |
|---|---|---|---|---|---|---|
| Hexadecanal | C16H32O | 1031497.9 | 97.2 | 16.5304 | Not reported |  |
| Octadecanal | C18H36O | 1593500.6 | 93.1 | 18.5544 | Antibacterial, anticancer [22] |  |
| 6-Octadecenoic acid, (Z)- | C18H34O2 | 1011874.3 | 87.3 | 19.6524 | Cancer preventive, Insectifuge [23] |
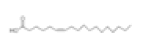 |
| Octadecenoic acid, | C18H36O2 | 477597.8 | 57.5 | 19.8364 | Antimicrobial [24] | 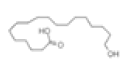 |
| Lupeol trifluoroacetate | C32H49F3O2 | 676094.3 | 74.0 | 21.7475 | Antitumor, antiinflammatory [25] | 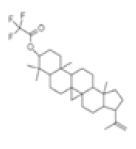 |
| 12-Oleanen-3-yl acetate (3Alpha) | C32H52O2 | 1010116.9 | 73.8 | 22.0146 | Not reported | 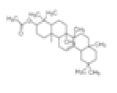 |
| Urs-12-en-3-ol, acetate- | C32H52O2 | 1097934.9 | 57.5 | 22.1155 | Antimicrobial [26] | 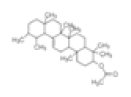 |
| Lu-20(29)-en-3-ol, acetate, (3.beta.)- | C32H52O2 | 5529041.9 | 89.2 | 23.9495 | Antiinflammatory [27] | 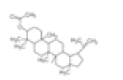 |
Table 4: The Identified Components Present In GC-MS Analysis and Biological Activity of Components
| Compound name | Molecular formula | MWA | Biological activity | Structure |
|---|---|---|---|---|
| Isocryptotanshinone | C19H20O3 | 296 | Antibacterial, antioxidative and anticancer [28] | 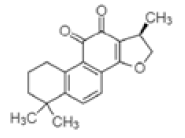 |
| Ginkgolic acid | C22H34O3 | 346 | Antimicrobial, antioxidant and cytotoxic [29] | 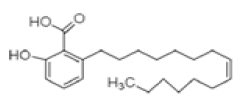 |
| Soya cerebroside | C40H75NO9 | 713 | Not reported | 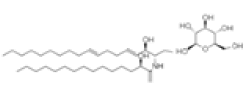 |
| Loganetin | C11H16O5 | 228 | Antimicrobial and antifungal [30] | 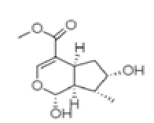 |
Table 5: Identified Components Present In LC-MS Analysis and the Mass Compared with the NIST Library

Figure 4: GC-MS and LC-MS spectra of the leaf extract and F2 Fraction
A. GC-MS spectrum of the F2 fraction and B. LC-MS spectrum of the leaf extract
The qualitative results of the bioautographic assay of AChE inhibitory activity in TLC plates exhibited white spots or colourless regions over yellow background indicating acetylcholinesterase inhibition zones (fig. 5). In the photograph, the spot confirmed the potential AChE inhibitors based on clear zones against a yellow background. Rf values of plant bioactive compounds were utilised for the isolation of the compound in a preparative scale.

Figure 5: Bioautographic AChE inhibition assay
Bioautographic AChE inhibition assay on TLC plates,
white spots over a yellow background developed indicate
acetylcholinesterase inhibition zones A. TLC plate under UV-light,
B and C indicate at different times of incubation
The present study investigated the AChE inhibitory potential of F2 fraction from O. dioica (fig. 6). The methanol extract exhibited good AChE inhibitory activity with >60 % inhibition at 20, 40, 60, 80, 100 and 120 μg/ml concentrations. The maximum AChE inhibition of the F2 fraction could be due to the presence of bioactive compounds. Some studies showed that the AChE inhibitory activity of the plant bioactive compounds is being used as the main approach to treat AD [25].

Figure 6: Percent inhibition of AChE by F1-3 fraction and
galantamine
Percent inhibition of AChE activity by different concentrations
of F1-3 fractions and galantamine as a positive control,  galatamine,
FTIR measurement was used to ascertain the bioactive components in the F2 fraction which gave absorption bands in the FTIR spectrum due to their active functional groups (fig. 7). FTIR results showed bands in the range of 3500-500 cm−1. Each band stretching and vibration indicated the presence of some functional groups like alcoholic and phenolic OH groups (Table 6).
| Extracts | Peak Value | Functional Group | Functional Group Name | Vibrations |
|---|---|---|---|---|
| F-2 Fraction of O. dioica | 784.63 | C-I | Haloalkane | Stretch |
| 903.22 | - | - | - | |
| 1092.49-1220.74 | C-F | Haloalkane | Bending | |
| 1359.22-1421.56 | C-O, C-F | Alcohols, ethers, esters and haloalkane | Bend out-of plane | |
| 1708.79 | C=O | acid, saturated | - | |
| 3004.45 | C-H | Aromatic | Bending | |
| 3532.66 | O-H | Alcohols and phenols | Bending |
Table 6: FTIR Peak Values and Functional Groups of F2 Fraction of Plant Leaf Extract

Figure 7: FTIR spectrum of F2 fraction
Medicinal plants contained bioactive compounds such as phenolics, anthocyanins and flavonoids. The phenolic and flavonoid compounds were reported to possess various pharmacological activities, including free radical scavenging, antidiabetic and anticancer effects. The present study revealed that the methanol extract of O. dioica possessed substantial quantity of phenolics and flavonoids. As this leaf extract exhibited extensive antioxidant activity and antiAChE activity, the under-investigated plant could have an important role in alleviating the human ailments [5].
Phytochemical studies of the methanol leaf extract showed the presence of several flavonoids and phenolic compounds. The leaf extract also harboured other bioactive compounds such as tannins, sterols and saponins (Table 1) but protein was absent in the methanol leaf extract [31]. The UV-spectroscopy gives qualitative and quantitative measurements of plant secondary metabolites and helps characterise the detailed chemistry of the compound. UV-spectrum of the leaf extract and F2 fraction has absorption peaks ranging from 200 to 400 and 400 to 700 nm indicating the presence of some plant compounds (fig. 1A and B, Table 1). The intensity values provide information on the plant secondary compounds [13].
The separation and determination of purity of the bioactive compounds was accomplished by HPTLC and TLC. Different mobile phases were used for isolating the active compounds (Table 2). TLC and HPTLC were also employed for the separation of the mixture and isolation of the bioactive compounds using the preparative mode (fig. 3). Leaf extract contained more flavonoids and phenolic compounds in the F2 fraction [32].
DPPH assay is a stable, free radical scavenging indicator, which is dense in the presence of hydrogen-donating antioxidants. The plant leaf extracts of O. dioica showed highest scavenging activity (fig. 2). The absorbance of O. dioica extract increased due to the configuration of the Fe2+-TPTZ complex with rising concentration as seen in the reference antioxidant (fig. 2B). Hence, the plant extracts should be able to donate electrons to free radicals. O. dioica leaf extract showed good activity [33]. The phytochemical components were recognized by the GC-MS (fig. 4A) and LC-MS (fig. 4B). Analysis of the F2 fraction of O. dioica was enumerated along with their molecular formula, retention time, peak area and biological activity (Tables 4 and 5). The GC/MS and LC-MS analysis of O. dioica revealed the presence of 8 compounds recognized in the F2 fraction and 4 compounds in LC-MS [34].
The qualitative bioautographic assay of AChE activity in TLC plates exhibited white spots or colourless regions over a yellow background indicating acetylcholinesterase inhibition zones (fig. 5). The spots were confirmed as potential AChE inhibitors based on the clear zones against yellow background [35-41]. On the other hand, spectrophotometric assay showed good AChE inhibition activity (fig. 6) and the methanol extract exhibited AChE inhibitory activity.
FTIR is a high-resolution analytical technique to identify functional groups of the chemical constituents of extracts. The FTIR analysis (fig. 7) revealed the presence of functional groups mentioned in Table 6. The functional groups were amines, aldehydes, alkenes, amides, phenols, alcohols, carboxylic acids and anhydride, quinines and organic halogen compounds.
The medicinal plants are used as nutraceuticals, pharmaceuticals, food supplements, and in cosmetic industries, O. dioica species are native to India, particularly to the Western Ghats region of Karnataka and to northeast India. They are used in the conventional method of medicine for curing fever and diabetes. These have been used to ameliorate human suffering from neurodegenerative diseases, cancer, to improve memory and learning. Olea plants have a wide range of secondary metabolites and more pharmacologically active constituents are present in O. dioica. Antimicrobial and cytotoxicity of methanol extract was reported earlier. In the present study compounds in the F2 fraction of leaf extract were identified by GC-MS, LC-MS, HPTLC. O. dioica provides valuable resources for the development of antiAChE compounds which could be used to treat AD.
References
- Akshay KR, Sudharani N, Anjali KB, Deepak TM. Biodiversity and strategies for conservation of rare, endangered and threatened medicinal plants. J Pharmacogn Phytochem 2014;2(3)12-20.
- Sringeswara AN, Shivanna MB. Floristic diversity in Kudremukh National Park, Western Ghats, Karnataka. New Delhi, India: ENVIS-The Ministry of Environment Forests and Climate Change; 2012.
- Harsha V, Hebbar S, Shripathi V, Hegde G. Ethnomedicobotany of Uttara Kannada District in Karnataka, India-plants in treatment of skin diseases. J Ethnopharmacol 2003;84(1)37-40.
- Bandonienė D, Markovic M. On-Line HPLC-DPPH Screening Method for Evaluation of Radical Scavenging Phenols Extracted from Apples Malusdomestica L. J Agric Food Chem 2002;50(9)2482-7.
- Bhandary MJ, Chandrashekar KR, Kaveriappa KM. Medical ethnobotany of the Siddis of Uttara Kannada district, Karnataka, India. J Ethnopharmacol 1995;47(3)149-58.
- Harsha V, Hebbar S, Hegde G, Shripathi V. Ethnomedical knowledge of plants used by Kunabi Tribe of Karnataka in India. Fitoterapia 2002l;73(4):281-7.
- Pratap GK, Shantaram M. Practice of traditional medicinal plants in humans and cattle in Arasikerehobli of Karnataka. J Med Plants Studies 2017;5(3):38-41.
- Agatonovic-Kustrin S, Morton DW. HPTLC – Bioautographic methods for selective detection of the antioxidant and α-amylase inhibitory activity in plant extracts. Methods 2018;5:797-802.
- Lee M-J, Prabhu S, Meng X, Li C, Yang CS. An Improved Method for the Determination of Green and Black Tea Polyphenols in Biomatrices by High-Performance Liquid Chromatography with Coulometric Array Detection. Anal Biochem 2000;279(2)164-9
- Liu SC, Chiu CP, Tsai CH, Hung CY, Li TM, Wu YC, et al. Soya-cerebroside, an extract of Cordyceps militaris, suppresses monocyte migration and prevents cartilage degradation in inflammatory animal models. Sci Rep 2017;22:71.
- Pratap GK, Ashwini S, Manjula S. Alzheimer’s Disease: A Challenge In Managing With Certain Medicinal Plants – A Review. Int J Pharm Sci Res 2017;3(2):52-73.
- Moonmun D, Majumdar R, Lopamudra A. Quantitative Phytochemical Estimation and Evaluation of Antioxidant and Antibacterial Activity of Methanol and Ethanol Extracts of Heliconia rostrata. Indian J Pharm Sci 2017;79(1):79-90.
- Domenici V, Ancora D, Cifelli M, Serani A, Veracini CA, Zandomeneghi M. Extraction of Pigment Information from Near-UV Vis Absorption Spectra of Extra Virgin Olive Oils. J Agric Food Chem 2014;6;2 38(93):17-25.
- Devika R, Koilpillai J. In vitro Quantification Study of Flavonoids from Tageteserecta. Asian J Biotechnol 2014;6(1)21-4
- Bajpai VK, Majumder R, Park JG. Isolation and purification of plant secondary metabolites using column-chromatographic technique. Bangladesh J Pharmacol 2016;1(11):844.
- Adebiyi OE, Olayemi FO, Ning-Hua T, Guang-Zhi Z. In vitro antioxidant activity, total phenolic and flavonoid contents of ethanol extract of stem and leaf of Grewia carpinifolia. Beni-Suef Univ J Basic Appl Sci 2017;6(1):10-4.
- Sugimoto H, Yamanish Y, Iimura Y, Kawakami Y. Donepezil Hydrochloride E2020] and Other Acetylcholinesterase Inhibitors. Curr Med Chem 2000;3(3)03-39.
- Sulaiman C, Gopalakrishnan VK. Radical scavenging and In-Vitro Hemolytic Activity of Aqueous Extracts of Selected Acacia Species. J Appl Pharm Sci 2013;03:109-11.
- Jothy SL, Zuraini Z, Sasidharan S. Phytochemicals screening, DPPH free radical scavenging and xanthine oxidase inhibitory activities of Cassia fistula seeds extract. J Med Plant Res 2011;5(10):1941-7.
- Gomathi D, Ravikumar G, Kalaiselvi, M, Vidya B, Uma C. HPTLC fingerprinting analysis of Evolvulusalsinoides L. L. J Acute Med 2012;3:77-82.
- Attimarad M, Mueen Ahmed KK, Aldhubaib BE, Harsha S. High-performance thin layer chromatography: A powerful analytical technique in pharmaceutical drug discovery. Pharm Methods 2011;2(2):71-5.
- Jain PK, Soni. Phytochemical analysis of Mentha spicata plant extract using UV-VIS, FTIR, and GC/MS technique. J Chem Pharm Res 2016;8(2):1-6.
- El-Din MSM, El-Ahwany AMD. Bioactivity and phytochemical constituents of marine red seaweeds (Jania rubens, Corallina mediterranea and Pterocladia capillacea). J Taibah Univ Sci 2016;10:471-84.
- Abubakar M, Majinda R. GC-MS Analysis and Preliminary Antimicrobial Activity of Albizia adianthifolia (Schumach) and Pterocarpus angolensis (DC). Medicines 2016;3:3.
- Anand Gideon V. GC-MS analysis of phytochemical components of Pseudoglochidion anamalayanum Gamble: An endangered medicinal tree. Pelagia Res Libr Asian J Plant Sci Res 2015;5:36-41.
- Ghribia L, Ghouilaa H, Omrib A, Besbesb M, Janneta HB. Antioxidant and anti–acetylcholinesterase activities of extracts and secondary metabolites from Acacia cyanophylla. Asian Pac J Trop Biomed 2014;4:S417-23.
- Krishnamoorthy K, Subramaniam P. Phytochemical Profiling of Leaf, Stem, and Tuber Parts of Solena amplexicaulis (Lam.) Gandhi Using GC-MS . Int Sch Res Notices 2014;2014:1-13.
- Wal P, Wal A, Sharma G, Rai AK. Biological activities of lupeol. Syst Rev Pharm 2011;2:96-103.
- Guo S, Luo W, Liu L, Pang X, Zhu H, Liu A, et al. Isocryptotanshinone, a STAT3 inhibitor, induces apoptosis and pro-death autophagy in A549 lung cancer cells. J Drug Target 2016;24:934-42.
- Hua Z, Wu C, Fan G, Tang Z, Cao F. The antibacterial activity and mechanism of ginkgolic acid C15:1. BMC Biotechnol 2017;17:1-12.
- Moreira V, Vieira IJC, Braz-Filho R. Chemistry and Biological Activity of Condamineeae Tribe: A Chemotaxonomic Contribution of Rubiaceae Family. Am J Plant Sci 2015;1(26):12-31.
- Załuski D, Kuźniewski R. In Vitro Anti-AChE, Anti-BuChE, and Antioxidant Activity of 12 Extracts of Eleutherococcus Species. Oxid Med Cell Long 2016:1-7.
- Holden M, Kelly C. Use of cholinesterase inhibitors in dementia. Advn Psych Treat 2002;8(2):89-96.
- Owokotomo IA, Ekundayo O, Abayomi TG, Chukwuka AV. In-vitro anti-cholinesterase activity of essential oil from four tropical medicinal plants. Toxicol Rep 2015;2:850-7.
- Ingkaninan K, Temkitthawon P, Chuenchom K, Yuyaem T, Thongnoi W. Screening for acetylcholinesterase inhibitory activity in plants used in Thai traditional rejuvenating and neurotonic remedies. J Ethnopharmacol 2003;92(3):261-4.
- Dalai MK, Bhadra S, Chaudhary SK, Chanda J, Bandyopadhyay A, Mukherjee PK. Anticholinesterase activity of Cinnamom umzeylanicum L. leaf extract. Tang Human Med 2014;4(2):111-6.
- Arora S, Kumar G, Meena S. Gas Chromatography-Mass Spectroscopy Analysis Of Root Of An Economically Important Plant, Cenchrus ciliaris L. From Thar Desert, Rajasthan India]. Asian Jf Pharm Clin Res 2017;1(10):9:64.
- Nair VP, Hunter JM. Anticholinesterases and anticholinergic drugs. BJA Educ 2004;5:164-8.
- Rogers SL, Farlow MR, Doody RS, Mohs R, Friedhoff LT. A 24-week, double-blind, placebo-controlled trial of donepezil in patients with Alzheimer’s disease. Neurology 1998;50(1):136-45.
- Ouattara N, Meda RNT, Hilou A, Guenné S, Konaté K, Coulibaly AY, et al. Anti-acetylcholinesterase and antioxidant activities and HPLC-MS analysis of polyphenol from extracts of Nelsoniacanescens Lam. Spreng. Asian Pac J Trop Dis 2013;3(5):382-8.
- Rao A. Study on Antioxidant and Cytotoxic Properties of Olea Dioica Roxb., Crude Extract and Its Pure Compound Collected from Western Ghats, Karnataka, India. Asian J Pharm Clinical Res 2017;10(2):356.


