- *Corresponding Author:
- Kanan Gamit
Ramanbhai Patel College of Pharmacy, Charotar University of Science and Technology, Charusat Campus, Changa, Gujarat 388421, India
E-mail: kanangamit.ph@charusat.ac.in
| Date of Received | 25 August 2021 |
| Date of Revision | 20 July 2023 |
| Date of Acceptance | 02 February 2024 |
| Indian J Pharm Sci 2024;86(1):139-145 |
This is an open access article distributed under the terms of the Creative Commons Attribution-NonCommercial-ShareAlike 3.0 License, which allows others to remix, tweak, and build upon the work non-commercially, as long as the author is credited and the new creations are licensed under the identical terms
Abstract
A simple, precise and accurate ultraviolet-visible spectrophotometer method has been developed by applying ratio spectra derivative method and validated for the simultaneous estimation of moxifloxacin hydrochloride and loteprednol etabonate from ophthalmic formulation. Absorbance of moxifloxacin hydrochloride and loteprednol etabonate was recorded at their respective wavelength and then zero order spectra was converted to first order derivative spectra after dividing respective zero order spectra with divisor concentration. Developed method was linear at concentration range 4-20 µg/ml, (r2 =0.99) and (r2 =0.99), for loteprednol etabonate and moxifloxacin hydrochloride respectively. The linear regression equations were y=0.005x+0.001 for loteprednol etabonate and y=0.118x-0.062 for moxifloxacin hydrochloride. The results of analysis were validated which showed that proposed method was simple, precise and accurate.
Keywords
Moxifloxacin hydrochloride, loteprednol etabonate, ratio spectra derivative method
Quantitative analysis of any drug is an important tool in the pharmaceutical industry. It is important to determine that the raw material, intermediate products as well as final products meet its specifications and are of required quality. Multicomponent dosage forms are known to be effective due to their combined mode of action in the body. The complexities of these dosage forms including the presence of multiple drug entities possess considerable challenge to the analytical chemist during development of assay procedure. Combination of Moxifloxacin Hydrochloride (MOX) and Loteprednol Etabonate (LOT) is used to treat conjunctivitis[1-4].
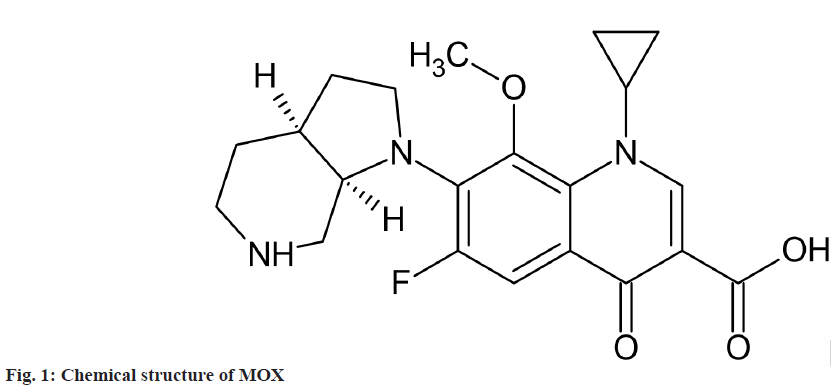
MOX is a 4th generation synthetic fluoroquinolone antibacterial agent[5]. It is chemically 1-cyclopropyl- 7-[(1S, 6S)-2,8-diazabicyclo[4.3.0]non-8-yl]-6- fluoro-8-methoxy-4-oxo-quinoline-3-carboxylic acid (fig. 1). Various High Performance Liquid Chromatography (HPLC), High-Performance Thin-layer Chromatography (HPTLC) and spectroscopic methods are available for estimation of MOX in Active Pharmaceutical Ingredient (API) and pharmaceutical dosage form[6-18].
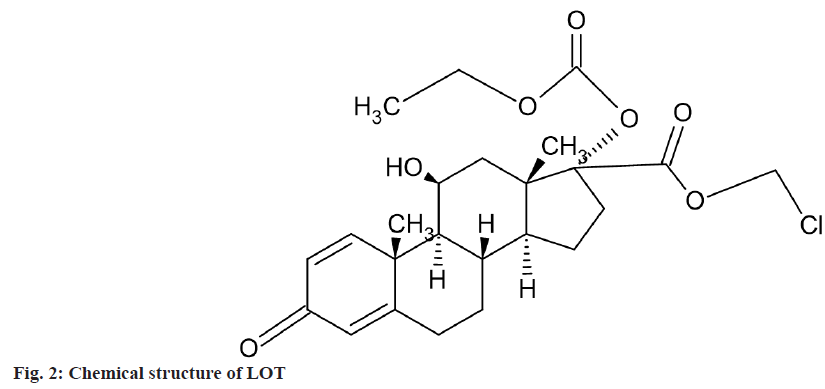
Chemically, LOT is 7-(ethyl carbonate) chloromethyl 11ß,17-dihydroxy-3- oxoandrosta- 1,4-diene-17ß-carboxylate (fig. 2). It was estimated in bile and blood by HPLC[19] and in combination with other drug by RP-HPLC and spectroscopic method[20-23]. The combination of these two drugs is not official in any pharmacopoeia; hence no official method is available for the simultaneous estimation of LOT and MOX in their combined synthetic mixture or dosage forms. Literature survey does not reveal any simple spectrophotometric method for simultaneous estimation of LOT-E and MOX-I in synthetic mixture or combined dosage forms. Combination of MOX and LOT in ophthalmic formulation was estimated by Spectrophotometric Q-absorbance ratio method. Absorbance ratio method uses the ratio of absorbances at two selected wavelengths, one which is an isoabsorptive point and other being the λmax of one of the two components[24].
Spectrophotometry methods are considered to be suitable for the simultaneous estimation of the drugs present in multicomponent dosage forms. Ratio Spectra Derivative method used for the simultaneous estimation of MOX and LOT because it has advantage to suppress matrix effect, resolve the overlay spectra, high number of analytical signal and maxima and minima, easy measurement and rapid operation. So, it was thought of our interest to develop an analytical method for simultaneous estimation of MOX and LOT by ratio spectra derivative method. Numbers of multicomponent dosage forms are available with ingredients, which provide a challenge for analyst for estimation of active drugs by different analytical methods in fixed dosage combination (Table 1).
| Parameter | Optimized value |
|---|---|
| Wavelength range | 200-400 nm |
| Concentration range | 4-20 µg/ml |
| Divisor concentration for MOX | 16 µg/ml LOT |
| Divisor concentration for LOT | 12 µg/ml MOX |
| Smoothing factor | 8 nm |
| Scaling factor | 1 |
| Analytical wavelength for MOX | 285 nm |
| Analytical wavelength for LOT | 238 nm |
| Solvent | Methanol |
Table 1: Optimized Parameter for Ratio Derivative Method
Materials and Methods
Procurement of active pharmaceutical ingredient and formulation:
MOX was procured from Cadila Pharmaceuticals Ltd., Dholka and LOT was procured from Arti healthcare Ltd., Mumbai as a gift sample. Formulation named Moxinix-LP eye drops was procured form the market which contained MOX and LOT 0.5 % w/v individually.
Reagents and instrument:
Methanol (AR Grade) was purchased from Lobachem, India. Ultraviolet (UV)-Visible Spectrophotometer (UV-1800, Shimadzu Corporation, Japan) was used to carry out experiments.
Preparation of standard stock solution:
MOX standard stock solution (100 μg/ml): 10 mg of standard MOX was weighed and transferred to a 100 ml volumetric flask and dissolved in 30 ml methanol. The flask was shaken and volume was made up to the mark with methanol to give a solution containing 100 μg/ml of MOX.
LOT standard stock solution (100 μg/ml): 10 mg of standard LOT was accurately weighed and transferred to a 100 ml volumetric flask and dissolved in 30 ml methanol. The flask was shaken, and volume was made up to the mark with methanol to give a solution containing 100 μg/ml of LOT.
Selection of analytical wavelength:
10 μg/ml solutions of MOX and LOT were prepared by transferring 1 ml from the standard stock solution of MOX and LOT to the 10 ml volumetric flask and diluted up to the mark with methanol and spectrums were recorded between 200-400 nm. The spectrum of MOX and LOT was recorded and peak maxima of both the drugs were found. The peak maximum of MOX was 294 nm and a peak maximum of LOT was 243 nm were obtained.
Calibration curve for the MOX (4-20 μg/ml):
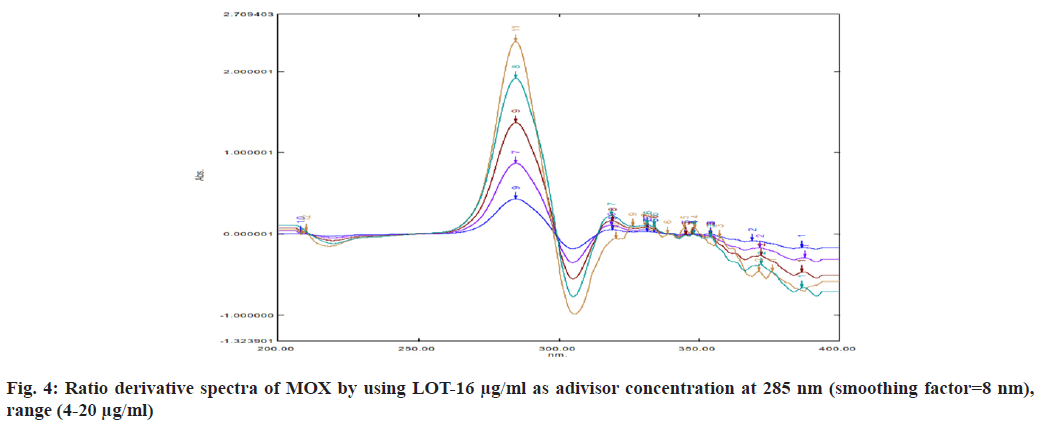
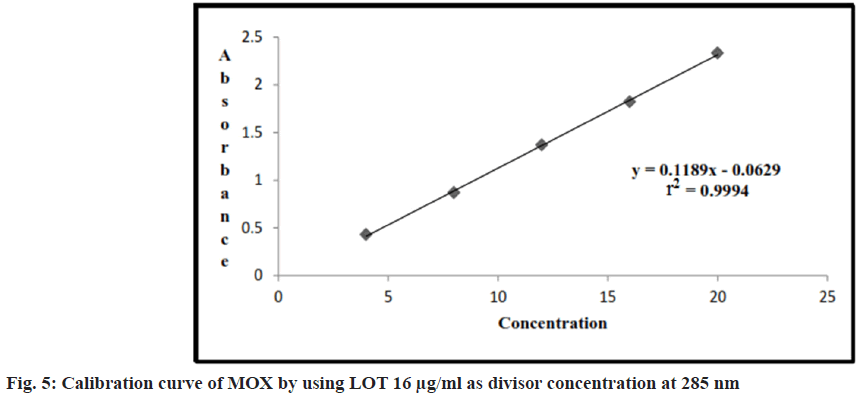
Appropriate volume of aliquots 0.4, 0.8, 1.2, 1.6, 2 ml from standard MOX stock solutions were transferred to different volumetric flasks of 10 ml capacity. The volume was adjusted to the mark with the methanol to obtain concentration of 4, 8, 12, 16 and 20 μg/ml. Absorbance of each solution against the methanol at wavelengths 294 nm were measured and after dividing all zero order spectra with divisor concentration (LOT 16 μg/ml) and converted this ratio spectra into first derivative, the absorbance measured at 285 nm. Results are shown in Table 2.
Calibration curve for the LOT (4-20 μg/ml):
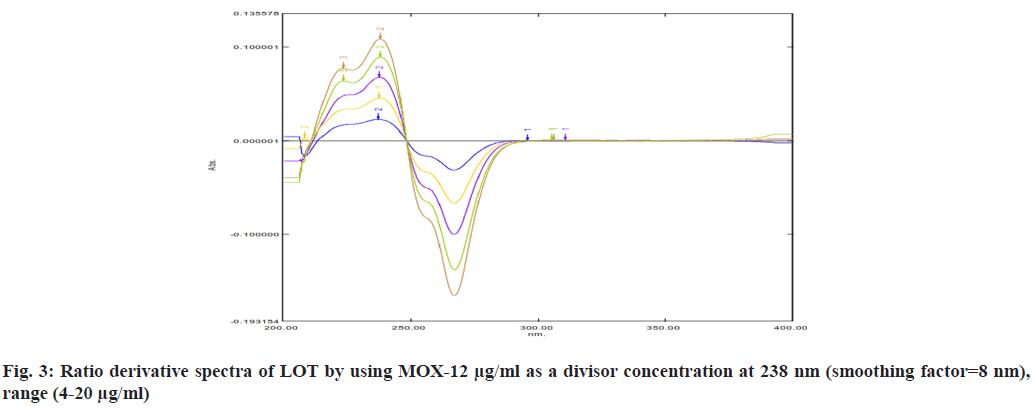
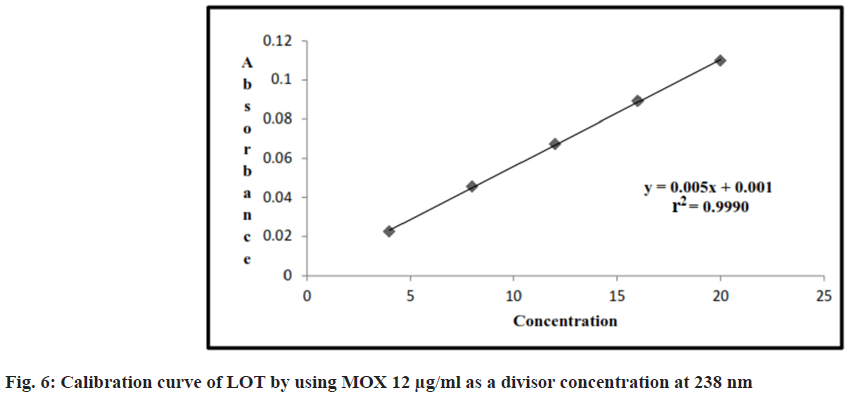
Appropriate volume of aliquots 0.4, 0.8, 1.2, 1.6, 2 ml from standard LOT stock solutions were transferred to different volumetric flasks of 10 ml capacity. The volume was adjusted to the mark with the methanol to obtain concentration of 4, 8, 12, 16 and 20 μg/ml. Absorbance of each solution against the methanol at wavelength of 243 nm were measured and after dividing all zero order spectra with divisor concentration (MOX 12 μg/ml) and converted this ratio spectra into first derivative, the absorbance measured at 238 nm. Results are shown in Table 2.
| Concentration | LOT (238 nm) | MOX (285 nm) | ||
|---|---|---|---|---|
| Absorbance±standard deviation | % RSD | Absorbance±standard deviation | % RSD | |
| 4 | 0.022 ± 0.00037 | 1.68 | 0.422 ± 0.00047 | 0.11 |
| 8 | 0.042 ± 0.00068 | 1.61 | 0.868 ± 0.00057 | 0.06 |
| 12 | 0.066 ± 0.00115 | 1.66 | 1.368 ± 0.00074 | 0.05 |
| 16 | 0.089 ± 0.00089 | 1.02 | 1.822 ± 0.00106 | 0.05 |
| 20 | 0.109 ± 0.00115 | 1.05 | 2.323 ± 0.00372 | 0.16 |
Table 2: Calibration Data of LOT and MOX
Sample preparation of MOX and LOT from ophthalmic formulation:
The quantity of eye drops equivalent to 1 ml volume was taken in 100 ml volumetric flask, 30 ml methanol added to the flask, the flask was shaken and volume was made up to the mark with the methanol to obtain final concentration of 50 μg/ml LOT and MOX. From the above solution 2.5 ml of aliquot was taken and transferred to the 10 ml volumetric flask, the volume was made up to the mark with methanol to get a concentration 12.5 μg/ml of MOX and LOT. Solution filtered with the help of whatman filter paper (Grade 42). This solution further used for estimation of MOX and LOT.
Validation of UV Method[25-31]:
Linearity: Linearity was established by taking absorbance at 285 nm and 238 nm respectively of MOX and LOT at concentration range 4-20 μg/ml.
Precision: Interday and intraday precision is expressed in percentage Relative Standard Deviation (% RSD). For interday evaluation, data was taken on 3 consecutive d and for Intraday data was taken 3 times in same day for precision study, concentration selected for both MOX and LOT is 8, 12 and 16 μg/ml. The result obtained for each concentration was subjected to statistical treatment to determine mean and % RSD. The results of the studies are shown in Table 3 and Table 4 for intraday and interday precision respectively.
| Concentration (µg/ml) | MOX | LOT | ||
|---|---|---|---|---|
| Absorbance±standard deviation | % RSD | Absorbance±standard deviation | % RSD | |
| 8 | 0.868 ±0.000577 | 0.06 | 0.042 ±0.00057 | 1.35 |
| 12 | 1.366±0.0036 | 0.26 | 0.064 ±0.00057 | 0.78 |
| 16 | 1.824± 0.0045 | 0.24 | 0.087 ±0.0015 | 1.14 |
Table 3: Intraday Precision of MOX and LOT
| Concentration (µg/ml) | MOX | LOT | ||
|---|---|---|---|---|
| Absorbance±standard deviation | % RSD | Absorbance±standard deviation | % RSD | |
| 8 | 0.868±0.001 | 0.11 | 0.041±0.00057 | 1.38 |
| 12 | 1.366±0.0023 | 0.16 | 0.065±0.0015 | 1.53 |
| 16 | 1.8255±0.0055 | 0.3 | 0.086±0.0017 | 1.93 |
Table 4: Interday Precision of MOX and LOT
Accuracy: Accuracy for method was confirmed by recovery study from marketed formulation at three levels of standard addition 50 %, 100 % and 150 %. Concentration selected for MOX and LOT to perform accuracy study was 8 μg/ml. Results of accuracy studies are shown in Table 5.
| Concentration (µg/ml) | Level (%) | MOX | LOT | ||
|---|---|---|---|---|---|
| Mean % recovery±standard deviation | % RSD | Mean % recovery±standard deviation | % RSD | ||
| 8 | 50% | 98.56±0.53 | 0.54 | 96.94 ±4.74 | 4.89 |
| 100% | 100±1.08 | 1.08 | 99.00±1.02 | 1.03 | |
| 150% | 98.98±0.26 | 0.26 | 98.7±0.46 | 0.46 | |
Table 5: Accuracy of MOX and LOT (n=3)
Repeatability: Repeatability was performed by recording absorbance for MOX and LOT at selected concentration, 8 μg/ml. The results are shown in Table 6. LOD and LOQ values were determined to establish sensitivity of the developed analytical method for MOX and LOT.
| Concentration (µg/ml) | MOX | LOT | ||
|---|---|---|---|---|
| Mean±standard deviation | % RSD | Mean±standard deviation | % RSD | |
| 8 | 0.868±0.00057 | 0.06 | 0.041±0.00057 | 1.39 |
Table 6: Repeatability of MOX and LOT (n=6)
Assay: From the calibration curve, the line equation was constructed using the least square regression analysis. Amount of MOX and LOT present in tablet was calculated from line equation using area of peak corresponded to MOX and LOT. Results are shown in Table 7.
| API | Label claim (%) | Amount obtain (%) | (%) Mean±standard deviation | % RSD |
|---|---|---|---|---|
| MOX | 0.5 | 0.51 | 100.13±0.152 | 0.152 |
| LOT | 0.5 | 0.49 | 98.6±1.154 | 1.17 |
Table 7: Assay MOX and LOT (n=3)
Results and Discussion
For selection of divisor concentration, all the concentration of range was tested individually. 16 μg/ml LOT and 12 μg/ml MOX selected as a divisor concentration because it gives high correlation coefficient (fig. 3 and fig. 4). Derivative spectra calculating with smoothing factor 8 nm and scaling factor 1, it gives best derivative spectra. So this is considered for determination. Parameters selected for optimization of method are mentioned in Table 1.
Linearity range for LOT and MOX were 4-20 μg/ ml, (r2=0.99) and (r2=0.99), for LOT and MOX respectively. The linear regression equations are y=0.118x–0.062 for MOX and y=0.005x+0.001 for LOT shown in Table 2, fig. 5 and fig. 6.
The correlation coefficient value for plot of concentration of MOX and LOT was found approaching 1.0, which ensured the linearity of area for the concentration range selected for the studies. The correlation coefficient value for plot of concentration of MOX and LOT was found approaching 1.0, which ensured the linearity of area for the concentration range selected for the studies. The results of precision studies are shown in Table 3 and Table 4, which showed that showed that % RSD value for all three selected concentrations was within the recommended limit. Intraday precision was 0.06 %-0.26; % RSD was 0.78 %-1.35 %; interday precision was found to 0.11-0.30; % RSD was 1.38 %-1.93 % for MOX and LOT respectively. As the value for % RSD was very low, it may confirmed that method was precise.
Accuracy studies were carried out at three different level, i.e. 50, 100 and 150 %. Concentration of the sample solution selected was 8 μg/ml for both MOX and LOT. Results of accuracy studies are shown in Table 5. The results of repeatability for MOX and LOT are shown in Table 6 for selected concentration of 8 μg/ml. LOD was found to 0.01 μg/ml and 0.56 μg/ml for MOX and LOT respectively. LOQ was found to be 0.042 μg/ml and 1.70 μg/ml for MOX and LOT respectively. Assay of MOX and LOT was performed from eye drops. Results are shown in Table 7.
Accurate and precise method was developed for simultaneous estimation of MOX and LOT. Method was validated according to International Council for Harmonisation guideline. The % RSD value is less than 2 obtained. This method can be applied for the simultaneous estimation of MOX and LOT from ophthalmic formulation. The excipients usually present in the pharmaceutical formulation did not interfere with estimation of MOX and LOT.
Conflict of interest:
The authors declared no conflict of interests.
References
- Martindale. The extra pharmacopeia. The Pharmaceutical Press 1989.
- Rang HP, Dale JP, Ritter JM, Flower RJ. Rang and dale’s pharmacology. Elsevier Health Sciences 2007.
- Tripathi KD. Essentials of Medical pharmacology. JP Medical Ltd 2006.
- Parmar RB, Tank HM. Design formulation and evaluation of reservoir type controlled released moxifloxacin hydrochloride ocular insert. AJPSci 2013;3(1):19-24.
- O'Neil MJ. The merck index: An Encyclopedia of chemicals, drugs and biologicals. RSC Publishing 2006;967.
- Pharmacopoiea B. British Pharmacopoeia. The Stationary Press 2011;1493.
- Sanapala A, Priyadarsini J. Method development and validation for estimation of moxifloxacin HCl from pharmaceutical dosage form by RP-HPLC method. Int J Adv Pharma Sci 2010;1(2):347-52.
- Misra M, Misra AK, Zope P, Panpalia GM, Dorle AK. Simple and validated UV-spectroscopic method for estimation of moxifloxacin HCL in bulk and formulation. J Glob Pharm Techn 2010;2(6):21-7.
- Dhillon V, Chaudhary AK. A validated HPTLC method for estimation of moxifloxacin hydrochloride in tablets. Pharm Methods 2010;1(1):54-6.
[Crossref] [Google Scholar] [PubMed]
- Dhumal DM, Shirkhedkar AA, Nerkar PP, Surana SJ. Simultaneous estimation of moxifloxacin hydrochloride and dexamethasone sodium phosphate in bulk and in ophthalmic solution by RP-HPLC. J Chil Chem Soc 2012;57(4):1344-1347.
- Dave JB, Vyas PJ, Patel CN. A validated stability-indicating high performance liquid chromatographic method for moxifloxacin hydrochloride and ketorolac tromethamine eye drops and its application in pH dependent degradation kinetics. Chronicles of Young Scientists. 2013; 4(1):24-9.
- Razzaq SN, Khan IU, Ashfaq M, Mariam I. Stability indicating HPLC method for simultaneous determination of moxifloxacin hydrochloride and ketorolac tromethamine in pharmaceutical formulations. Quim Nova 2012;35(6):1216-21.
- Soni AK, Gohel M, Thakkar V, Baldaniya L, Gandhi T. Simultaneous estimation of moxifloxacin hydrochloride and difluprednate by ratio derivative spectrophotometry. Int J Pharm Pharm Sci 2014;6(8):387-90.
- Dewani AP, Barik BB, Kanungo SK, Wattyani BR, Chandewar AV. Development and validation of RP-HPLC method for the determination of moxifloxacin in presence of its degradation products. Am Eurasian J Sci Res 2011;6(4):192-200.
- Razzaq SN, Khan IU, Mariam I, Razzaq SS. Stability indicating HPLC method for the simultaneous determination of moxifloxacin and prednisolone in pharmaceutical formulations. Chem Cent J 2012;6(1):94-8.
[Crossref] [Google Scholar] [PubMed]
- Parmar A, Parmar R. Simultaneous estimation of Moxifloxacin HCl and bromfenac sodium in eye drops by spectrophotometric methods. J Pharm Sci Bioscientific Res 2012;2(1):36-9.
- Patel SH, Raval MA, Shah UM. Development and validation of spectrofluorometric method for the estimation of moxifloxacin in pharmaceutical dosage form. Int J Pharm Pharm Sci 2013;5(4):252-4.
- Nguyen HA, Grellet J, Ba BB, Quentin C, Saux MC. Simultaneous determination of levofloxacin, gatifloxacin and moxifloxacin in serum by liquid chromatography with column switching. J Chromatogr B Analyt Technol Biomed Life Sci 2004;810(1):77-83.
[Crossref] [Google Scholar] [PubMed]
- Lunn G. HPLC methods for recently approved pharmaceuticals. John Wiley and Sons 2005.
- Patel AB, Patel DB. Development and validation of RP-HPLC method for simultaneous estimation of gatifloxacin and loteprednol etabonate in pharmaceutical dosage form. AJRC 2013;6(4):393-7.
- Vashi SA, Shah M, Malairajan P, Patel A, Patel Z. Analytical method development and validation for the determination of loteprednol etabonate and tobramycin in combined dosage form. J Pharm Sci Bioscientific Res 2015;5(4):379-84.
- Saxena V, Anoop S. Development and validation of HPLC method for simultaneous estimation of loteprednol etabonate and gatifloxacin. Int J Sci Res 2013;2(5):252-5.
- Premakumari KB, Marugan V. Simultaneous spectrophotometric estimation of Loteprednol etabonate and Gatifloxacin from bulk and ophthalmic formulation. IJPRS 2014;3(2):482-90.
- Patel SK, Patel KP. Spectrophotometric estimation of loteprednol etabonate and moxifloxacin HCl in eye drops by Q-absorbance ratio method. Int Res J Pharm 2013;4(1):186-9.
- International Conference on Harmonization (ICH). Validation of analytical procedures: Text and methodology. 2005.
- Raval MA, Gamit KG, Vyas NY, Patel ND. Estimation of withaferin: A from ashwagandhadi lehya using HPLC. Int J Pharm Sci Res 2020;11(1):334-42.
- Gamit KG, Vyas NY, Patel ND, Raval MA. Estimation of guggulsterone-z in gokshuradi guggulu using reversed-phase high-performance liquid chromatography. Asian J Pharm Clin Res 2018;11(11):204-8. [Crossref]
[Google Scholar] [PubMed]
- Vyas NY, Patel SH. Simultaneous estimation of curcuminoids, piperine and gallic acid in an ayurvedic formulation by validated HPTLC method. Asian J Pharm Clin Res 2016;9:117-22
- Vyas NY, Patel SH. Validated spectrofluorimetric method for estimation of Piperine in an Ayurvedic formulation. Asian J Pharm Clin Res 2012;5(4):231-3.
- Vyas NY, Panchal S. Development and validation of RP-HPLC method for simultaneous estimation of nebivolol and indapamide in pharmaceutical dosage form. Asian J Pharm Anal 2014;4(3):98-102.
- Patel M, Vyas NY. Development and validation of stability indicating HPTLC method for estimation of ursolic acid. Asian J Res Chem 2013;6(6):546-51.
