- *Corresponding Author:
- J. Guan
Addiction Ward, Wuhan Mental Health Center, Wuhan, 430000, China
E-mail: guanjuan89546@126.com
| This article was originally published in a special issue, "Clinical and Experimental Studies on Drug and Intervention Repurposing in China |
| Indian J Pharm Sci 2019:81(4)spl issue1;7-12 |
This is an open access article distributed under the terms of the Creative Commons Attribution-NonCommercial-ShareAlike 3.0 License, which allows others to remix, tweak, and build upon the work non-commercially, as long as the author is credited and the new creations are licensed under the identical terms
Abstract
In order to understand the basic mechanism of brain diseases, autoregressive model coefficients, frequency band energy, approximate entropy, and Lempel-Ziv complexity of magnetoencephalographic signals of schizophrenia were extracted as features. Distance criterion and Plus-L Minus-R algorithm were used to screen channels, back propagation neural network and support vector machine were applied to distinguish magnetoencephalographic signals of schizophrenic and normal people, and genetic algorithm was adopted to select features with significant differences. Finally, electroencephalography experiments were designed based on steady-state visual evoked potentials, and electroencephalographic signals of multiple subjects were collected. The collected signals were analyzed using discrete Fourier transform, canonical correlation analysis and multivariable synchronization index analysis methods. The results showed that the correct classification rates of schizophrenic and normal people were 96.25 and 98.75 %, respectively. The correct classification rates of back propagation neural network and support vector machine were 98.5 and 99.75 %, respectively. Signal energy, correlation coefficient and synchronization index were the highest at the target stimulus frequency. The in-depth study of brain signals in patients with schizophrenia provided a reference for clinical diagnosis.
Keywords
Brain signal, schizophrenia, steady state visual evoked potential
Electroencephalography (EEG) is the discharge activity of brain neurons recorded by scalp electrodes. EEG signals indicate the change of voltage difference between two different locations of the brain over time. EEG is often used in the diagnosis and monitoring of epilepsy, and can also be used to analyse other diseases, such as Alzheimer's disease, schizophrenia and so on[1]. Magnetoencephalography (MEG) is a non-invasive technique for detecting brain function. It can detect the magnetic field produced by nerve current in the brain. It is another study of brain function and clinical application developed after EEG[2]. Schizophrenia is a serious and persistent mental illness, which affects 0.4- 0.6 % of the world's population. Most of the patients are in post-adolescence or early adulthood[3].
In recent years, more and more scholars have devoted themselves to the study of schizophrenia. Huang et al. have designed a simple choice task. The subjects need to predict 500 random left-or right-facing stimuli. By analysing the mutual information and crossover mutual information of the binary response signals of the subjects, it was found that the response sequences produced by the patients with schizophrenia show stronger interdependence[4]. Schizophrenic patients lack synchronous alternation ability in completing memory tasks. There are differences in brain activity between patients and normal people in frontal and temporal lobes[5]. Akar et al. used approximate entropy (AE), Shannon entropy, Kolmogorov complexity (KC) and Lempel-Ziv complexity (LZC) to analyse EEG complexity. Compared to normal people, the complexity of schizophrenic patients was lower, and there were significant differences in the left frontal lobe (F3) and parietal lobe (P3) regions of the brain. Compared with other eigenvalues, KC could detect EEG complexity more sensitively in patients with schizophrenia. In addition, there were significant hemispheric complexity differences in the frontal and parietal regions of the brain[6]. Nugent et al. analysed the brain source connectivity in resting state and task state of schizophrenia patients. It was found that the average connectivity of schizophrenia patients and normal people was significantly different in θ band, and the scalp oscillation power of schizophrenia patients was higher than that of normal people[7]. Schizophrenia is a very common mental disorder, and it seriously endangers human health. The in-depth study of brain signals of schizophrenic patients can provide reference for clinical diagnosis and bring hope for the rehabilitation of schizophrenic patients.
Materials and Methods
Magnetoencephalographic data of schizophrenia:
The MEG data used are from the NIH (National Institute mental Health) Research Center. The magnetoencephalographic data were collected by a 275-channel CTF-275 magnetoencephalograph. The subjects include 10 healthy subjects and 10 schizophrenics. In the experiment, the subjects were in a closed-eye resting state. The acquisition time of magnetoencephalographic signals was 4 min and the sampling frequency was 600 Hz. Before extracting features, the signal was pre-processed as follows: firstly, the signal was filtered by 0.1-50 Hz band-pass filter, then principal component analysis combined with independent component analysis was used to remove artifacts such as eye and electrocardiograph (ECG), and the sampling frequency was 150 Hz. The 40 s data of beginning and end were removed, and the actual analysis time was 160 s, so that the data of each participant was a group of 273×24000 data array.
Extraction of characteristic parameters of magnetoencephalographic signals in schizophrenia:
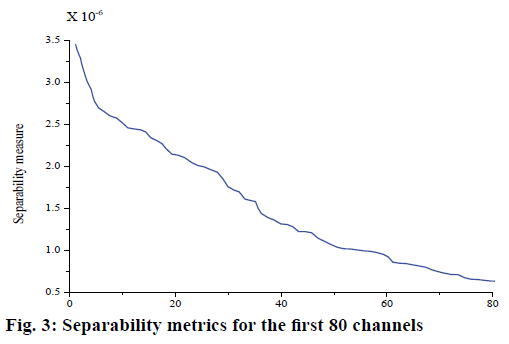
Before feature extraction, MEG signals were windowed and segmented into stationary signals with 200 sample points per segment. Firstly, feature parameters such as model coefficients, bandwidth energy, AE and LZC were extracted, and 12 feature parameters were obtained from each segment of data. In order to visually represent the extracted features, the average and standard deviation of frequency band energy characteristics, AE and LZC were calculated, respectively. 20 subjects were divided into 10 groups, each consisting of one normal person and one schizophrenic patient. According to Eqn. 1, the separability measure J was calculated for 273 channel data of each group, and all channels were arranged in descending order according to J value, and the first 80 channels were selected. Of the 80 channels in 10 groups, channels with more than 6 occurrences were selected. Eqn. 1, J = trSb/tsSw.
Back propagation (BP) neural network and support vector machine (SVM) network selection channel:
Channel selection for BP neural network and SVM classifier was done on the basis of distance criterion, LRS (Plus-L Minus-R selection) algorithm was used to further select the 21 selected channels. In LRS algorithm, each time a one-dimensional feature of 12-dimensional features was used as the data sample of the classifier, and the classification accuracy of the classifier was used as the evaluation function. The algorithm stops when the number of channels was 15. Genetic algorithm combined with BP neural network selection: genetic algorithm was used to select features. Table 1 is the parameter setting of genetic algorithm, the maximum evolutionary algebra was 100, and the fitness function is defined as the classification accuracy of classifier.
| Items | Parameters |
|---|---|
| Population size | 20 |
| Stopping criteria | Maximum evolutionary algebra |
| Initialization | Uniform distribution in [0,…,1] |
| Selection | Roulette selection |
| Crossover | Single point crossover |
| Mutation | Boundary mutation |
Table 1: Genetic algorithm parameters
Design of experimental system:
The experimental system mainly included four stages, signal acquisition, pre-processing, feature extraction and pattern classification. Pre-processing is mainly used to eliminate the interference signals in the steady state visually evoked potentials (SSVEP) signal. In feature extraction part, DFT, CCA and MSI were used to extract the features of SSVEP signal. Considering the real-time performance of brain-computer interface (BCI) system, a simple and efficient value comparison method was used for classification. Feature extraction and classification methods were used to identify the subjects' gaze targets. These algorithms are very important to the performance of the whole BCI system. Design and implementation of visual stimulation interface: during the experiment, all stimuli were presented to the subjects simultaneously. The subjects focus on one stimulus, and the oscillating component of the EEG signal was the evoked SSVEP signal. When designing stimulator, the effects of stimulator equipment, stimulus frequency and stimulus colour on SSVEP signal should be considered.
NeuroScan EEG acquisition system was used to collect EEG signals. The system included Synamps2/ RT amplifier, 64-conductive electrode cap and Curry7 analysis software. Synamps2/RT amplifier included two parts, a control box (system) and an amplifier (head box). The position of 64-conductive electrode cap electrode meets the international 10-20 system standard. The parameters of the amplifier such as sampling frequency and available electrodes, were set by Curry7 analysis software, and the impedance of each electrode is displayed online. In addition, the software can also pre-process the collected EEG signals, including baseline correction, removal of direct current (DC) drift, removal of eye, and filtering subsection.
EEG experimental process:
The subjects were made to sit 60 cm away from the display. The four stimulation frequencies were 7.5, 8.57, 10 and 12 Hz, respectively. There were three healthy male subjects aged 20-25. Participants were required to complete two sessions, each session consisting of 10 trials. Each trial participant continued to watch the flicker of a block on the interface for 16 s. The target stimulation frequency of session 1 was 8.57, 12, 7.5, 12, 10, 8.57, 10, 10, 12, and 12 Hz; the target stimulation frequency of session 2 was 12, 8.57, 7.5, 10, 12, 12, 7.5, 10, 8.57 and 10 Hz. When the subjects looked at the target stimulus at a certain frequency, they could detect the same frequency of SSVEP signal and harmonic signal, which were mainly distributed in the occipital lobe of the brain. The data of O1, O2, Oz and VEO were recorded. VEO is a vertical eye signal. The electrode impedance was less than 5000 Euros and the sampling frequency of SSVEP was 500 Hz.
EEG frequency recognition:
Signal pre-processing was using Curry7 software to pretreat the collected SSVEP signal. Covariance method was used to remove the eye artifacts and segment the data in different time windows. SSVEP frequency recognition based on DFT, Fourier transform is generally used to process linear steady-state signals. The segmented SSVEP signals can be approximately regarded as linear steady-state signals. The collected data were divided into two overlapping segments for 2 s, and the DFT was carried out on the segmented data that are the spectrum of the SVEP signals of 7.5, 8.57, 10 and 12 Hz, respectively. Segmentation with overlapping multi-time windows for the data of three subjects was conducted, and the data after segmentation were performed with DFT. The energy at all four stimulation frequencies was calculated and the frequency corresponding to the maximum energy was used as the target frequency recognized.
Results and Discussion
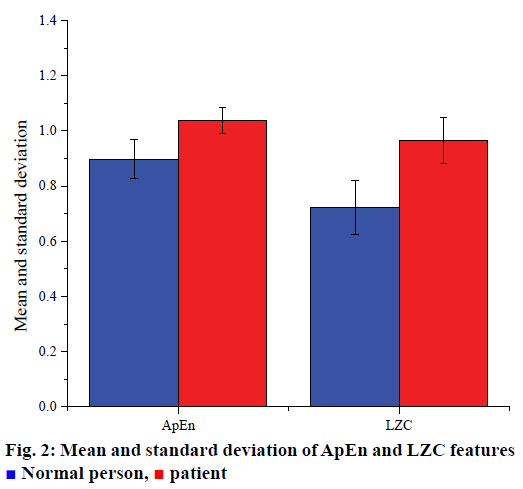
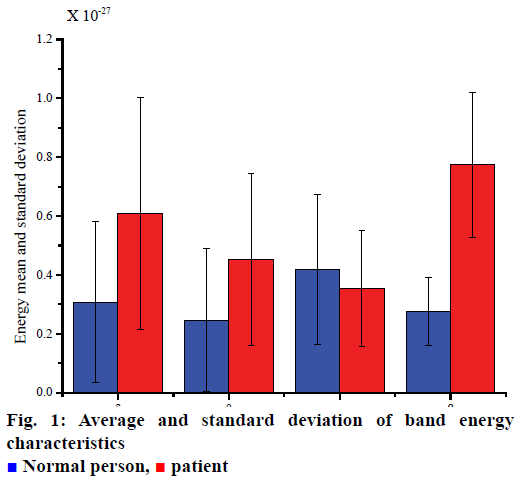
Six AR model coefficients, four frequency band energies, one AE feature and one LZC feature obtained by extracting the characteristic parameters of the signal. Finally, 12 characteristic parameters were obtained from each segment of the data. In order to visually represent the extracted features, the average and standard deviation of band energy characteristics, AE and LZC were calculated, respectively. Fig. 1 shows the energy of four bands, δ, θ, α, and β. Fig. 2 shows the AE and LZC.
Because there were redundant channels in 273 channels of MEG signal, the distance criterion was used to preselect 273 original channels. Separability measure J was calculated for 273 channel data of each group, and all channels were arranged in descending order according to J value. Separability measure of the first 80 channels was selected as shown in fig. 3. The results of channel selection based on BP neural network and SVM classifier are shown in Table 2. The shadows in the table represent the channels in the temporal lobe.
| Classification characteristics | AR1 | AR2 | AR3 | AR4 | AR5 | AR6 | α | β | δ | θ | ApEn | LZC |
|---|---|---|---|---|---|---|---|---|---|---|---|---|
| LRS channel selection (BP) screening channel | MRT24 | MLO41 | MRT24 | MLC42 | MRT24 | MRT53 | MRT52 | MLO42 | MLO41 | MLO41 | MLO41 | MRT44 |
| MRT44 | MRT24 | MLC42 | MRF65 | MRF65 | MLO42 | MRF35 | MRC15 | MRT22 | MRC15 | MRF65 | MLC42 | |
| MLC42 | MRF65 | MRC15 | MRC15 | MRC15 | MRC15 | MLO42 | MRF65 | MRF65 | MRF44 | MLC42 | MLO42 | |
| MRT41 | MLC42 | MRF65 | MRT24 | MLC42 | MRF65 | MRT11 | MRF14 | MRT31 | MRF14 | MRT11 | MRT31 | |
| MRT42 | MRT44 | MLO42 | MRT32 | MRF44 | MRT52 | MRC15 | MRF35 | MRF35 | MRF35 | MRF25 | MLO41 | |
| MRF25 | MRC15 | MRT42 | MLO42 | MRT11 | MRF25 | MRT31 | MRT44 | MRC15 | MRT11 | MRT22 | MRF44 | |
| MRC15 | MRT31 | MRT52 | MRT41 | MRT51 | MRF44 | MRT51 | MRF25 | MRT32 | MRT51 | MRT31 | MRT52 | |
| MRF65 | MRF14 | MRT53 | MRF14 | MRT52 | MRT32 | MRF65 | MRT31 | MRF44 | MRT31 | MRT44 | MRT53 | |
| MRT32 | MRT41 | MRT21 | MRF35 | MRF25 | MRT42 | MRT53 | MRT22 | MRT11 | MRT22 | MRT52 | MRT51 | |
| MLO42 | MRT22 | MRT44 | MRF44 | MRT53 | MRT22 | MRF14 | MRT42 | MRT24 | MRT53 | MRT41 | MRF35 | |
| MRF44 | MRT32 | MLO41 | MRT22 | MLO42 | MRT21 | MLC42 | MRT21 | MRF25 | MRF25 | MRF44 | MRF25 | |
| MRT31 | MRF44 | MRT11 | MRT51 | MRF14 | MLO41 | MRT42 | MRT51 | MRT53 | MRT52 | MRT53 | MRT22 | |
| MRT21 | MRT53 | MRF44 | MRF25 | MLO41 | MRF35 | MRT22 | MRT11 | MRT44 | MRT21 | MRF35 | MRC15 | |
| MRF14 | MRT51 | MRT31 | MLO41 | MRT31 | MRT31 | MRT32 | MRT52 | MLO42 | MRT44 | MRT24 | MRT11 | |
| MRT11 | MRT42 | MRF14 | MRT21 | MRF35 | MRF14 | MRT21 | MRT41 | MRT41 | MRF65 | MRF14 | MRF14 | |
| Evaluation function | 95.25 | 96.25 | 96.75 | 96.25 | 93.5 | 85.75 | 70.75 | 75.25 | 77 | 76.25 | 72.5 | 65.75 |
| LRS Channel selection (SVM) screening channel | MLO41 | MLO41 | MRF65 | MRT24 | MLO42 | MRF65 | MRF44 | MRF44 | MRT44 | MLO41 | MLO42 | MLO41 |
| MRT52 | MRT24 | MRC15 | MLO41 | MRF65 | MRT32 | MRT31 | MRT11 | MLC42 | MLC42 | MRT44 | MRT42 | |
| MRT24 | MRF65 | MLO42 | MLC42 | MRC15 | MLC42 | MLO42 | MRT21 | MRT52 | MRT41 | MRF65 | MLO42 | |
| MLC42 | MRC15 | MRT24 | MRT51 | MRT24 | MRT22 | MRC15 | MLC42 | MRF65 | MRT52 | MRT41 | MRT41 | |
| MRF14 | MRF35 | MRT44 | MRF44 | MLC42 | MRT53 | MLC42 | MRT24 | MRC15 | MRT53 | MRT32 | MRF44 | |
| MRT11 | MRF44 | MRF44 | MRC15 | MRF44 | MRT41 | MRT11 | MRF25 | MLO41 | MRF35 | MRT51 | MRT51 | |
| MRC15 | MRF14 | MRF14 | MRF14 | MRT21 | MRT42 | MRF35 | MRT32 | MRT53 | MRT21 | MRF44 | MRF14 | |
| MRF65 | MRT21 | MRT21 | MRT44 | MRF25 | MRT52 | MRT44 | MRF14 | MRT24 | MRT22 | MRF14 | MRF65 | |
| MRT31 | MRT51 | MRT51 | MRT31 | MRF14 | MRT51 | MRT21 | MLO41 | MRT51 | MRT32 | MRT21 | MRT24 | |
| MRT44 | MRT53 | MLO41 | MRT11 | MRF35 | MRT21 | MRT24 | MRT41 | MRT22 | MRF65 | MRT53 | MRT32 | |
| MRF44 | MRT42 | MRF25 | MRF25 | MLO41 | MRT44 | MRT32 | MLO42 | MRF25 | MRT51 | MLC42 | MRT52 | |
| MRT22 | MRT32 | MRT53 | MRT42 | MRT31 | MRT11 | MRT52 | MRT22 | MRF35 | MRT11 | MRF35 | MRT31 | |
| MRT51 | MRT31 | MRT11 | MRT21 | MRT11 | MRF44 | MRF25 | MRT31 | MRT11 | MRF44 | MRT42 | MRC15 | |
| MRT32 | MRT52 | MRF35 | MRT41 | MRT44 | MRF35 | MRF65 | MRT51 | MRF14 | MRT24 | MRT31 | MRT44 | |
| MRT42 | MRF25 | MRT31 | MRT53 | MRT22 | MRF25 | MRT51 | MRT42 | MRT32 | MLO42 | MRT22 | MRF25 | |
| Evaluation function | 96 | 98.25 | 98.75 | 98.75 | 97.5 | 88 | 74 | 77.25 | 77.25 | 86.25 | 77.5 | 67.2 |
Table 2: LRS channel selection (BP) and (SVM)
As can be seen from Table 2, most of the selected channels are located in the temporal lobe region, which indicates that the channels in the temporal lobe region may carry more differential information. In addition, the evaluation function values of the 6th order AR coefficients were relatively high, and the highest classification accuracy could reach 98.75 %. Twelve channels, MRF25, MRC15, MRF65, MLO42, MRF44, MRT31, MRF14, MRT11, MLO41, MRT2 2, MRT53 and MRF35, which appear at least nine times in the 12 columns screened by BP, are selected as the final result of LRS algorithm based on SVM classifier. Similarly, 13 channels, MLO41, MRT 24, MLC 42, MRF 14, MRT 11, MRF 65, MRT 31, MRT 44, MRF 44, MRT 51, MRT 32, MRT 21 and MRF 25, which appear at least nine times in 12 columns of SVM screening channels, were selected as the final results of the BP neural network-based LRS algorithm. After using LRS method to select channels based on BP neural network classifier, there were 144-dimensional (12-channel×12 features) features, and 156-dimensional (13 channels×12 features) features based on SVM classifier selected. Proper feature selection can effectively remove irrelevant and redundant features and improve the learning efficiency of classifiers.
The 80-dimensional features were obtained by combining genetic algorithm with BP neural network. After using genetic algorithm and SVM to select features, the number of features was 75 dimensions, which is nearly half of the number of features reduced compared with 144 dimensions and 156 dimensions before feature selection. The features selected by genetic algorithm were used as training and testing data of classifier. The classification results of MEG signals are shown in Table 3. The final classification accuracy of BP neural network and SVM was 98.5 and 99.75 %, respectively. Comparing the classification results before and after feature selection, it was found that the true positive rate, the true negative rate and the classification accuracy rate were improved after feature selection by genetic algorithm, and the true negative rate of SVM was 100 %. In addition, the modelling time of BP neural network and SVM was greatly reduced after feature selection, and the running speed of classifier was significantly improved. By comparing BP neural network with SVM classifier, it was found that the classification result of SVM is better than that of BP neural network, and the modelling time was shorter, so in general, the performance of SVM was better than that of BP neural network.
| Items | Before feature selection | After feature selection | ||
|---|---|---|---|---|
| BP | SVM | BP | SVM | |
| Feature dimension | 144 | 156 | 80 | 75 |
| True positive rate (%) | 97.5 | 99 | 98.5 | 99.5 |
| True negative rate (%) | 95.5 | 98.5 | 98.5 | 100 |
| Classification accuracy (%) | 96.25 | 98.75 | 98.5 | 99.75 |
| Modeling time (s) | 2.64 | 2.34 | 0.7 | 0.44 |
Table 3: Classification results
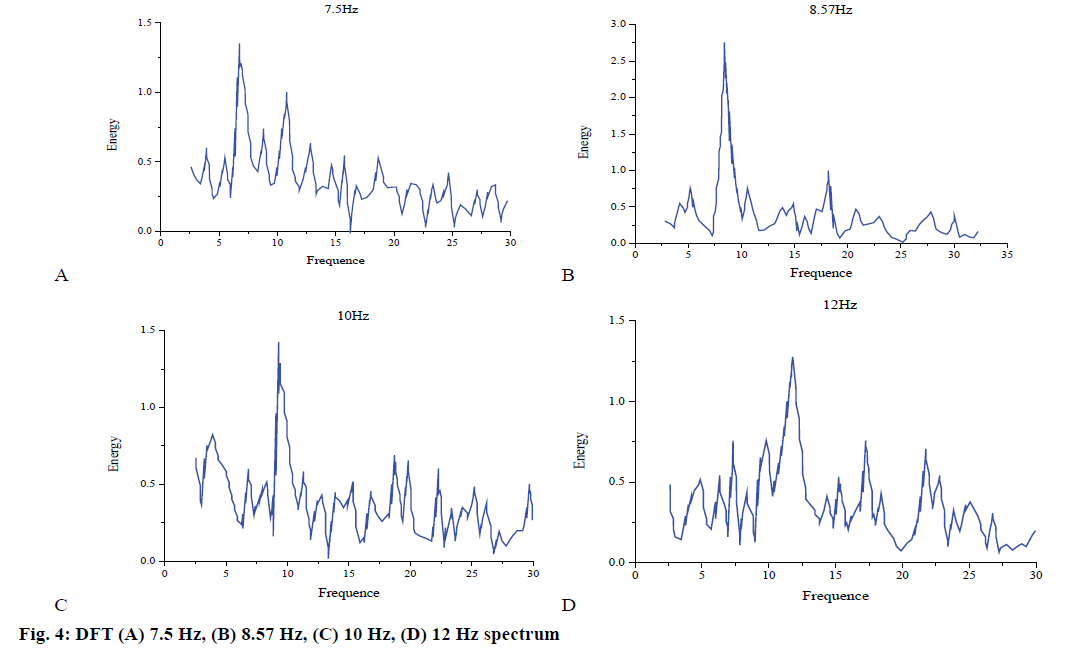
SSVEP signals were generated by periodic visual stimuli of a certain frequency. In addition to the main fundamental component, they usually contain harmonic components. In DFT analysis, the results are shown in fig. 4A-D. It is obvious that the peak energy of the signal appears at the target stimulus frequency.
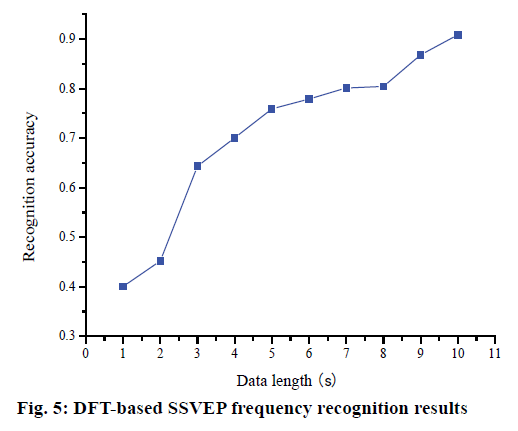
The data of three subjects were divided into overlapping segments with multiple time windows. The data after segmentation were carried out with DFT and the energy at all four stimulation frequencies was calculated. The frequency corresponding to the maximum energy was used as the target frequency recognized. The results of SSVEP frequency recognition based on DFT method are shown in fig. 5. With the increase of data length, the recognition accuracy was improved.
A multi-dimensional complexity-based method for the analysis of magnetoencephalographic signals in schizophrenia was proposed. The method of genetic algorithm combined with BP neural network and SVM was used and the classification accuracy of magnetoencephalographic signals in schizophrenia and normal people was 98.5 and 99.75 %, respectively. At the same time, EEG experiments based on SSVEP were designed and EEG data of many subjects were successfully collected. Spectrum analysis of SSVEP signals was carried out by DFT method. It was found that the energy of signals was the largest at the target stimulus frequency, and the recognition accuracy was increased with the increase of data length. It is helpful to further understand the basic pathogenesis of brain diseases and provide reference for clinical diagnosis of brain diseases.
References
- Iu S, Cai W, Liu S, Zhang F, Fulham M, Feng D, et al. Multimodal neuroimaging computing: a review of the applications in neuropsychiatric disorders. Brain Informatics 2015;2(3):167.
- Mousas A, Simos PG, Rezaie R, Papanicolaou AC. Estimation of regional activation maps and interdependencies from minimum norm estimates of magnetoencephalography (MEG) data. In: Sakkalis V. Modern Electroencephalographic Assessment Techniques. New York: Humana Press; 2014. P. 267-89.
- Knuesel I, Chicha L, Britschgi M, Schobel SA, Bodmer M, Hellings JA. Maternal immune activation and abnormal brain development across CNS disorders. Nat Rev Neurol 2014;10(11):643.
- Huang LY, Zou J, Ma HJ, Zhao J, Shi JG. Brain functional network based on mutual information analysis of eegs and its application to schizophrenia. Adv Mater Res 2013;6:718-20.
- Senkowski D, Gallinat J. Dysfunctional prefrontal gamma-band oscillations reflect working memory and other cognitive deficits in schizophrenia. Biol Psychiatry 2015;77(12):1010-9.
- Akar SA, Kara S, Latifoğlu F, Bilgiç V. Analysis of the complexity measures in the eeg of schizophrenia patients. Int J Neural System 2016;26(02):13.
- Nugent AC, Robinson SE, Coppola R, Furey ML, Zarate CA. Group differences in meg-ica derived resting state networks: application to major depressive disorder. Neuroimage 2015;118:1-12.
 Normal person,
  patient