- *Corresponding Author:
- J. Rajput
Pharmaceutical Quality Assurance Laboratory, Pharmacy Department, Faculty of Technology and Engineering, the M. S. University of Baroda, Kalabhavan, Vadodara-390 001, India.
E-mail: sjrajput@rediffmail.com
| Date of Submission | 16 August 2005 |
| Date of Revision | 19 April 2006 |
| Date of Acceptance | 8 February 2007 |
| Indian J Pharm Sci 2007, 69 (1): 114-115 |
Abstract
A simple analytical method for the estimation of tegaserod maleate has been developed to analyze the drug in bulk and in tablet formulation. The method is based on difference spectroscopy and is quite simple, rapid, inexpensive and sensitive. The Beer's law range was followed in the concentration range of 1-30 µg/ml of tegaserod maleate. The molar absorptivity was 1.7920×10 4 l/mole/ cm. The method does not require any separation of soluble excipients as they do not interfere in the estimation.
Tegaserod maleate (TM), 3-(5-methoxy-1H-indol-3ylmethylene)-N-pentylcarbazimidamic hydrogen maleate [1]. It is a selective 5HT4 receptor partial agonist with promotile activity in the gastrointestinal tract and is used in irritable bowel syndrome. TM is not official in any pharmacopoeia and only HPLC [2] and LC-MS [3] methods are reported in literature for its determination.
A Shimadzu U-1601 UV/Vis spectrophotometer with matched 1 cm quartz cells was used for all the spectral measurements. The solutions of 0.1 N HCl and 0.1 N NaOH were prepared in double distilled water as per IP’96 procedure. Stock solution of TM was prepared in methanol as 100 μg/ml solution. Standard solutions of TM were prepared by diluting aliquots (0.1 to 2.2 ml) of standard solution to 10 ml with 0.1 N NaOH and 0.1 N HCl separately.
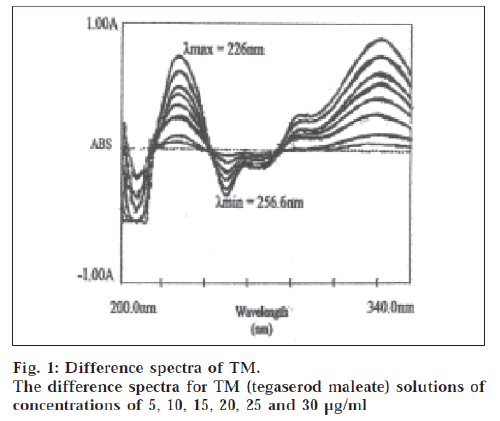
The difference spectrum was obtained by treating the acidic TM solution as blank and the basic TM solution as the sample and scanning in the wavelength range of 200 nm to 330 nm. The maxima and minima were obtained at 226 nm and 256.6 nm, respectively. The amplitude was linear in the concentration range of 1-30 μg/ml.
TM tablets (Tegib-6 of Torrent Pharmaceuticals) containing 6 mg of TM were analyzed by the proposed method. Ten tablets were powdered to a fine powder and powder equivalent to 8 mg of the drug was taken in a beaker. This was mixed with 15 ml of methanol and stirred using magnetic stirrer for about 15 min. Then the solution was filtered through Whatman filter paper no. 42 in to a 25 ml volumetric flask. Filter paper was rinsed thrice with 2 ml of methanol and volume was made up to 25 ml with methanol. Suitable aliquots from this stock solution were diluted with 0.1N HCl and 0.1N NaOH to get working sample solutions. The absorbance of the solutions was measured and the amount of TM was computed from the calibration curve.
The ionized and unionized forms of TM show different spectral characteristic making it possible to get a difference spectrum. The difference spectrum of TM is shown in fig. 1. The spectra showed λmax at 226 nm and λmin at 256.6 nm. The calibration curve was plotted as amplitude against concentration. The calibration curve was linear in the concentration range of 1-30 μg/ml for TM. The molar absorptivity was 1.792×10⁴ l/mol.cm. The slope, intercept and correlation coefficient were obtained by linear least square treatment of the results and these values were 0.0415, 0.0175 and 0.9999 respectively. The method was used to analyze the commercial formulation. The results showed the TM concentration as 100.24% of the labeled value. The standard deviation values were also within acceptable limits. Recovery experiments were carried out by standard addition method at three levels with known quantities of standard solution, the results showed 100.32% recovery indicating reliability and accuracy of the method. The proposed methods are simple, selective and precise and can be used for the determination of TM in bulk drug and in its dosage formulation.
Acknowledgements
The authors thank M/s. Torrent Pharmaceuticals Ltd., Chatral for their generous gift of TM sample. Thanks are also due to Dr. A. N. Mishra, Head, Pharmacy Department, and M. S. University of Baroda for providing the necessary facilities to carry out the research work.
References
- Budavari, S., Eds., In, The Merck Index, 13th Edn., Merck & Co., Inc., Whitehouse station., NJ, 2001,1496.
- Buchheit, K.H., Games, R., Hoye, D., Klein, F., Kloppner, E. Pfannkuche, H.J. and Mattes, H., J. Med. Chem., 1995, 38, 2331.
- Zhou, H., Khaliliesh, S., Campestrine, J., Appel-dingemanse, S. Lachman, L. and McLeod, J., Gastroenterology., 2000, 118 A, 1206.


