- *Corresponding Author:
- Z. H. Lin
Department of Pharmacy and Bioengineering, Chongqing University of Technology, Chongqing, 400054, P. R. China
E-mail: zhlin@cqut.edu.cn
| Date of Submission | 09 November 2016 |
| Date of Revision | 06 April 2017 |
| Date of Acceptance | 14 November 2017 |
| Indian J Pharm Sci 2018;80(1):65-78 |
This is an open access article distributed under the terms of the Creative Commons Attribution-NonCommercial-ShareAlike 3.0 License, which allows others to remix, tweak, and build upon the work non-commercially, as long as the author is credited and the new creations are licensed under the identical terms
Abstract
Mechanistic target of rapamycin is involved in the formation of tumor microvasculature was an ideal target for computer-aided drug design. The predictive study of quantitative structure-activity relationship and molecular docking can shorten the cycle and reduce the cost of designing the higher activity mTOR inhibitors. In this article, comparative molecular field analysis and comparative molecular similarity indices analysis fields were used to analyze three-dimensional quantitative structure-activity relationship model. The model (comparative molecular similarity indices analysis with q2=0.607, r2=0.909; comparative molecular similarity indices analysis with q2=0.703, r2=0.935) has a good predictability. Three-dimensional quantitative structure-activity relationship model contour maps indicate the electrostatic, hydrophobic and hydrogen bond donor fields have crucial effects to derivatives biological activity. Molecular docking was employed to explore the conformations of 55 compounds with key amino acid residues. Finally, combining contour maps with molecular docking results, ten derivatives as potential mechanistic target of rapamycin inhibitors were designed to further verify established three-dimensional quantitative structure-activity relationship models. These data provide significant theoretical foundation for designing better activity mechanistic target of rapamycin inhibitors.
Keywords
mTOR, 3D-QSAR, CoMFA, CoMSIA, molecular docking
The mechanistic target of rapamycin (mTOR), a serine/ threonine protein kinase, has been demonstrated as a significant target for cancer [1,2]. It plays an important role on regulating all kinds of fundamental cellular processes, such as growth, nutrition and proliferation [3]. There are two different mTOR proteins in cells namely mTORC1 and mTORC2. mTORC1 protein complex is responsible for regulating protein synthesis and cell cycle progressing [4,5], mTORC2 protein complex can participate in cell cytoskeleton formation and survival [6,7]. Research shows that mTOR signal transduction pathway was activated abnormally in the tumor. When the tumor occurred, the PI3K and Akt, in the mTOR upstream, were overexpressed, and the eIF4E with S6K1 proteins, in the mTOR downstream, is also overexpressed. Thus promote the mTOR signal transduction pathway was constantly activated, thereby promoting the growth of tumor cells, inhibition of PI3K/Akt/mTOR pathway can effectively block a variety of abnormal growth factor signal activation and transduction, thus inhibiting tumor genesis and development [8,9]. Rapamycin and its analogs, such as everolimus (RAD001) and temsirolimus (CCI- 779) allosteric inhibitors that specifically inhibit the mTORC1, have been shown to ordinarily do not inhibit mTORC2 complex [10,11]. Though the analogues have achieved some clinical success, however, it still has some side effects: mainly in the lower stability, poorer bioavailability and lower water solubility [12]. The latest study found that some small molecule inhibitors of mTOR kinase could inhibit both mTORC1 and mTORC2, such as PP242, a kind of selection mTORC1/C2 inhibitor, can block the Akt kinase by phosphorylating at Ser473 [13-15]. Perhaps, the dual inhibitors of mTOR kinase and PI3K are the most effective antitumor inhibitors. NVP-BEZ235 is a class of PI3K superfamily inhibitors, which can inhibit all PI3K isoforms, mTORC1 and mTORC2 [16,17], while it also actives the PI3K/Akt pathway during the testing. Therefore, the study of novel mTOR inhibitors should be paid more attention to, which has a bright future in the tumor therapy.
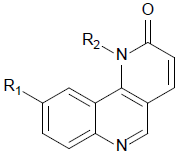
In recent years, three-dimensional quantitative structure-activity relationship (3D-QSAR) study, which is a kind of statistical method combined with 3D structural information, physicochemical properties and activity relationship of the molecular, has a widely application in the development of various types of drugs [18-20]. For nearly a decade, the QSAR and molecular docking study of PI3K/Akt/mTOR pathway small molecule inhibitors have made great progress in drugs development, many novel mTOR inhibitors were used in clinical treatment [21,22]. In the study, to acquire highly predictive model of benzo[h] [1,6] naphthyridin- 2(1H)-one analogs on the inhibition of mTOR kinase, the comparative molecular field analysis (CoMFA) and comparative molecular similarity indices analysis (CoMSIA) methods were used to establish the 3D-QSAR model, and then the conformations of binding model were analysed by molecular docking. The QSAR and molecular docking models could provide insights into the interrelation between the chemical structure information of the small molecule and mTOR protein receptor, which can offer information for us to transform these compounds.
Materials and Methods
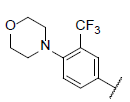
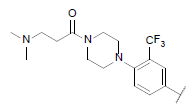
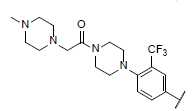
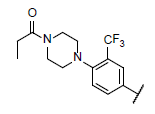
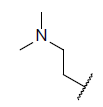
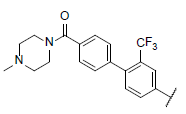
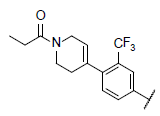
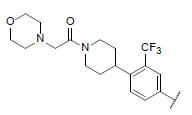
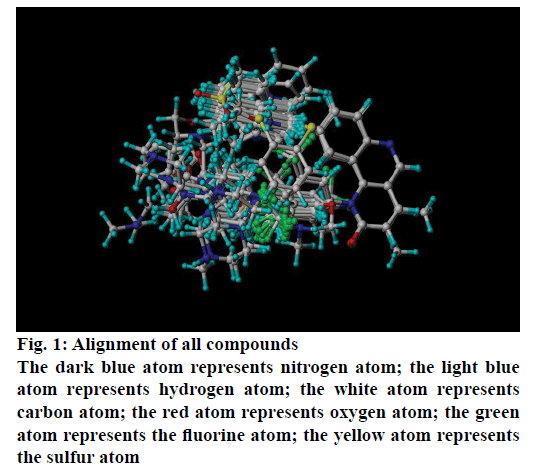
Fifty five benzo[h] [1,6] naphthyridin-2(1H)-one analogs of mTOR protein inhibitors came from the literature [23,24]. The total set was divided into training set (contain 40 compounds) and testing set (contain 15 compounds), the testing set compounds were marked with an asterisk. The biological data was represented as pIC50, which is shown in Table 1 and 2. The structures of all 55 molecules were built in the Sybyl-X2.1, the Tripos force field and Gasteiger-Huckel charges will be taken to make energy minimization for all compounds [25], and the largest repetitions is 1000 times, energy convergence condition is 0.005 kcal/mol, the rest of the parameters using the default values [26]. The molecular alignment will select the highest activity compound 45 as an alignment template, and the alignment of all compounds is shown in Figure 1.
 |
|||||
| S. No. | Structure(R) | pIC50 | Predicted value | ||
| R1 | R2 | CoMFA | CoMSIA | ||
| 1 |  |
 |
7.159 | 7.269 | 7.158 |
| 2 |  |
 |
8.537 | 8.223 | 8.410 |
| 3 |  |
 |
7.785 | 7.789 | 7.805 |
| 4 |  |
 |
7.119 | 7.376 | 7.143 |
| 5 |  |
 |
7.818 | 7.652 | 7.780 |
| 6 |  |
 |
7.449 | 7.564 | 7.550 |
| 7 |  |
 |
8.154 | 7.770 | 7.984 |
| 8 |  |
 |
7.225 | 7.081 | 7.089 |
| 9* |  |
 |
7.109 | 7.733 | 7.348 |
| 10 |  |
 |
6.519 | 6.778 | 6.527 |
| 11* |  |
 |
7.431 | 7.860 | 7.763 |
| 12 |  |
 |
7.367 | 7.390 | 7.326 |
| 13 |  |
 |
8.657 | 8.879 | 8.676 |
| 14 |  |
 |
7.573 | 7.684 | 7.567 |
| 15 |  |
 |
7.101 | 7.179 | 7.098 |
| 16 |  |
 |
8.853 | 8.901 | 8.915 |
| 17* |  |
 |
8.602 | 8.482 | 8.364 |
| 18 |  |
 |
7.612 | 7.596 | 7.984 |
| 19 |  |
 |
7.724 | 7.713 | 7.594 |
| 20 |  |
 |
7.074 | 7.190 | 7.125 |
| 21* |  |
 |
8.319 | 8.021 | 8.407 |
| 22* |  |
 |
6.969 | 7.659 | 7.722 |
| 23 |  |
 |
7.716 | 7.740 | 7.702 |
| 24 |  |
 |
8.677 | 8.219 | 8.421 |
| 25 |  |
 |
8.337 | 8.318 | 8.510 |
| 26 |  |
 |
8.267 | 8.347 | 8.297 |
| 27 |  |
 |
7.869 | 7.878 | 7.832 |
| 28* |  |
 |
7.103 | 7.336 | 6.812 |
| 29* |  |
 |
7.028 | 7.350 | 7.567 |
| 30 |  |
 |
6.463 | 6.419 | 6.448 |
| 31 |  |
 |
7.479 | 7.429 | 7.451 |
| 32* |  |
 |
6.179 | 6.583 | 6.415 |
| 33 |  |
 |
6.671 | 6.920 | 6.643 |
| 34* |  |
 |
7.177 | 7.427 | 6.898 |
| 35 |  |
 |
7.083 | 7.459 | 7.129 |
| 36 |  |
 |
7.338 | 7.329 | 7.393 |
| 37 |  |
 |
6.669 | 6.598 | 6.673 |
| 38 |  |
 |
7.588 | 7.396 | 7.564 |
| 39 |  |
 |
6.622 | 6.654 | 6.704 |
| 40 |  |
 |
7.023 | 7.181 | 6.999 |
| 41 |  |
 |
7.181 | 7.091 | 7.246 |
| 42* |  |
 |
8.164 | 7.792 | 7.906 |
| 43 |  |
 |
8.443 | 8.708 | 8.438 |
| 44* |  |
 |
9.244 | 8.952 | 8.700 |
| 45* |  |
 |
9.537 | 9.420 | 9.309 |
| 46 |  |
 |
6.411 | 6.129 | 6.468 |
| 47 |  |
 |
8.896 | 8.952 | 8.910 |
| 48* |  |
 |
7.669 | 7.246 | 7.174 |
| 49 |  |
 |
8.372 | 8.204 | 8.351 |
Table 1: Structure and Activity Data of 49 Compounds
| S. No. | Structure(R) | pIC50 | Predicted value | |
|---|---|---|---|---|
| CoMFA | CoMSIA | |||
| 50* | 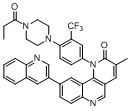 |
7.575 | 7.652 | 7.954 |
| 51* | 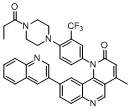 |
7.284 | 7.697 | 7.545 |
| 52 | 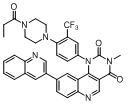 |
6.639 | 6.646 | 6.625 |
| 53 | 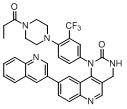 |
6.402 | 6.515 | 6.380 |
| 54 | 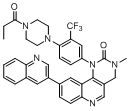 |
6.542 | 6.539 | 6.538 |
| 55 | 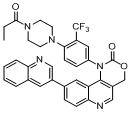 |
6.474 | 6.396 | 6.444 |
Table 2: Structure and Activity Data of 6 Compounds
3D-QSAR modelling
In this article, 3D-QSAR study was constructed by using CoMFA and CoMSIA models. The electrostatic filed and steric field were performed to analyse CoMFA model, and the electrostatic, steric, hydrophobic, hydrogen bond acceptor and hydrogen bond donor fields were performed to analyse CoMSIA model [27,28]. Then taking the grid size 2Å and SP3 hybridized carbon atom as a probe to analyse each field, partial least squares (PLS) method was used for linear correlation analysis, the method leave one out was used to determine the cross-validated correlation coefficient (q2) and the optimal principal component (n). The QSAR models predict ability was determined by the following parameters: the optimal principal component (n), the cross-validated correlation coefficient (q2), non-crossvalidated correlation coefficient (r2), F statistic value and the standard error of estimate (SEE).
Molecular docking
Molecular docking studies were performed using the Surflex-Docking module of Sybyl-X2.1 and Ligand Fit module of Discovery Studio (DS) software, the mTOR protein crystal structure (PDB code: 5FLC) was obtained from the PDB database. To getting the docking simulations and binding pocket, the structural water molecules and natural ligands have been removed from mTOR protein crystal structure [29,30]. The conformation of docking model and the binding sites between the protein receptor and ligand molecular were analysed by the established molecular docking model.
Results and Discussion
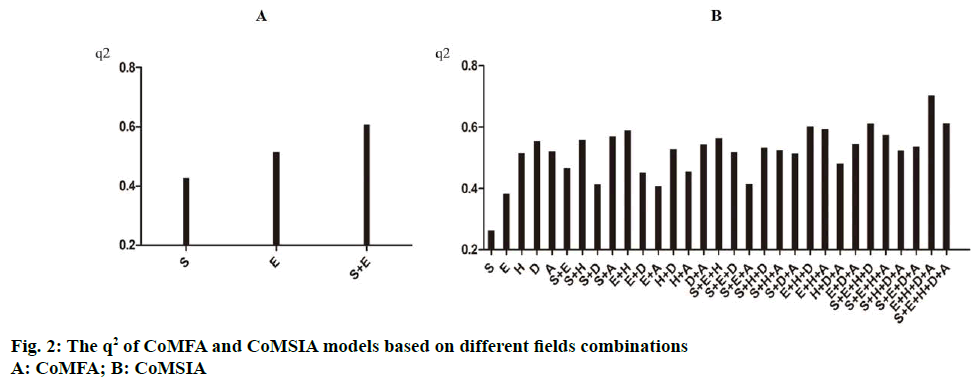
CoMFA and CoMSIA models were based on different field combinations and the results were shown in Table 3 and Figure 2. The steric and electrostatic fields were used together to obtain a better CoMFA model, then the following parameters have been obtained: the cross-validated correlation coefficient (q2) is 0.607, the optimal principal components (n) is 4, the noncross- validated correlation coefficient (r2) is 0.909, and the SEE is 0.238. The proportion of the steric and electrostatic fields in the model is 50.3 and 49.7 %, respectively. In CoMSIA model, five different fields: steric (S), electrostatic (E), hydrophobic (H), hydrogen bond acceptor (A) and donor field (D) were used, the results shows the best field combination is E+H+D+A, and the q2=0.703, n=5, R2=0.935, SEE=0.112, the model contribution values of electrostatic, hydrophobic, hydrogen bond donor and acceptor fields were 39.8, 29.0, 19.8 and 11.4 % separately, which shows the electrostatic field and hydrophobic field occupy the leading role in CoMSIA model. The q2 of the CoMFA and CoMSIA models are greater than 0.5, which reveal the models’ results are reasonable. According to the CoMFA and CoMSIA models, the observed pIC50 and predicted pIC50 of the 55 compounds were shown in Table 1 and 2.
| CoMFA | n | q2 | SEE | r2 | F | S | E | H | D | A |
|---|---|---|---|---|---|---|---|---|---|---|
| S | 3 | 0.427 | 0.314 | 0.838 | 62.024 | 1 | - | - | - | - |
| E | 2 | 0.514 | 0.631 | 0.826 | 8.964 | - | 1 | - | - | - |
| S+E | 4 | 0.607 | 0.238 | 0.909 | 87.677 | 0.503 | 0497 | - | - | - |
| CoMSIA | ||||||||||
| S | 6 | 0.263 | 0.370 | 0.793 | 21.123 | 1 | - | - | - | - |
| E | 5 | 0.383 | 0.269 | 0.887 | 53.554 | - | 1 | - | - | - |
| H | 6 | 0.515 | 0.241 | 0.912 | 57.140 | - | - | 1 | - | - |
| D | 6 | 0.554 | 0.673 | 0.817 | 2.551 | - | - | - | 1 | - |
| A | 2 | 0.521 | 0.582 | 0.728 | 13.829 | - | - | - | - | 1 |
| S+E | 9 | 0.466 | 0.133 | 0.976 | 135.132 | 0.243 | 0.757 | - | - | - |
| S+H | 7 | 0.558 | 0.215 | 0.932 | 63.151 | 0.303 | - | 0.697 | - | - |
| S+D | 9 | 0.413 | 0.298 | 0.878 | 24.044 | 0.537 | - | - | 0.463 | - |
| S+A | 2 | 0.571 | 0.511 | 0.859 | 23.409 | 0.399 | - | - | - | 0.601 |
| E+H | 6 | 0.588 | 0.171 | 0.956 | 119.044 | - | 0.543 | 0.457 | - | - |
| E+D | 9 | 0.452 | 0.158 | 0.966 | 94.607 | - | 0.756 | - | 0.244 | - |
| E+A | 6 | 0.408 | 0.247 | 0.908 | 54.486 | - | 0.787 | - | - | 0.213 |
| H+D | 10 | 0.527 | 0.181 | 0.957 | 63.921 | - | - | 0.702 | 0.298 | - |
| H+A | 2 | 0.454 | 0.410 | 0.716 | 46.752 | - | - | 0.604 | - | 0.396 |
| D+A | 3 | 0.544 | 0.506 | 0.879 | 16.479 | - | - | - | 0.544 | 0.456 |
| S+E+H | 5 | 0.564 | 0.195 | 0.941 | 108.270 | 0.132 | 0.472 | 0.396 | - | - |
| S+E+D | 8 | 0.517 | 0.143 | 0.971 | 130.354 | 0.199 | 0.532 | - | 0.268 | - |
| S+E+A | 5 | 0.414 | 0.242 | 0.909 | 67.835 | 0.235 | 0.579 | - | - | 0.186 |
| S+H+D | 7 | 0.534 | 0.225 | 0.926 | 57.045 | 0.219 | - | 0.447 | 0.334 | - |
| S+H+A | 9 | 0.525 | 0.169 | 0.961 | 81.837 | 0.228 | - | 0.553 | - | 0.219 |
| S+D+A | 3 | 0.514 | 0.458 | 0.655 | 22.779 | 0.213 | - | - | 0.475 | 0.312 |
| E+H+D | 9 | 0.602 | 0.115 | 0.982 | 180.518 | - | 0.461 | 0.338 | 0.201 | - |
| E+H+A | 5 | 0.594 | 0.200 | 0.938 | 102.479 | - | 0.437 | 0.383 | - | 0.180 |
| H+D+A | 6 | 0.581 | 0.265 | 0.894 | 46.536 | - | - | 0.418 | 0.350 | 0.232 |
| E+D+A | 6 | 0.545 | 0.257 | 0.900 | 49.617 | - | 0.482 | - | 0.319 | 0.199 |
| S+E+H+D | 8 | 0.611 | 0.121 | 0.979 | 182.349 | 0.111 | 0.396 | 0.272 | 0.221 | - |
| S+E+H+A | 5 | 0.575 | 0.205 | 0.935 | 97.022 | 0.106 | 0.397 | 0.336 | - | 0.161 |
| S+H+D+A | 6 | 0.524 | 0.250 | 0.905 | 52.664 | 0.151 | - | 0.357 | 0.315 | 0.177 |
| S+E+D+A | 10 | 0.536 | 0.217 | 0.923 | 167.53 | 0.164 | 0.477 | - | 0.237 | 0.122 |
| E+H+D+A | 5 | 0.703 | 0.112 | 0.935 | 172.135 | - | 0.398 | 0.290 | 0.198 | 0.114 |
| S+E+H+D+A | 6 | 0.613 | 0.168 | 0.958 | 124.108 | 0.092 | 0.315 | 0.241 | 0.237 | 0.115 |
Table 3: Combination Field of CoMFA and CoMSIA Models
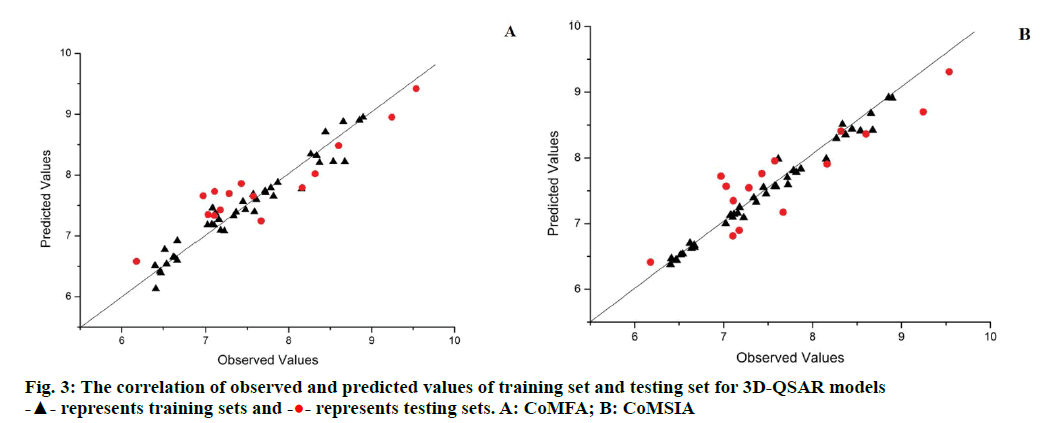
The training set (contain 40 compounds) of CoMFA and CoMSIA models were used to predicting the activity of the testing set (contain 15 compounds), and the prediction correlation of the molecule were presented in Figure 3. Most of the molecule situated on or near the regression line that indicates the 3D-QSAR models are reasonability.
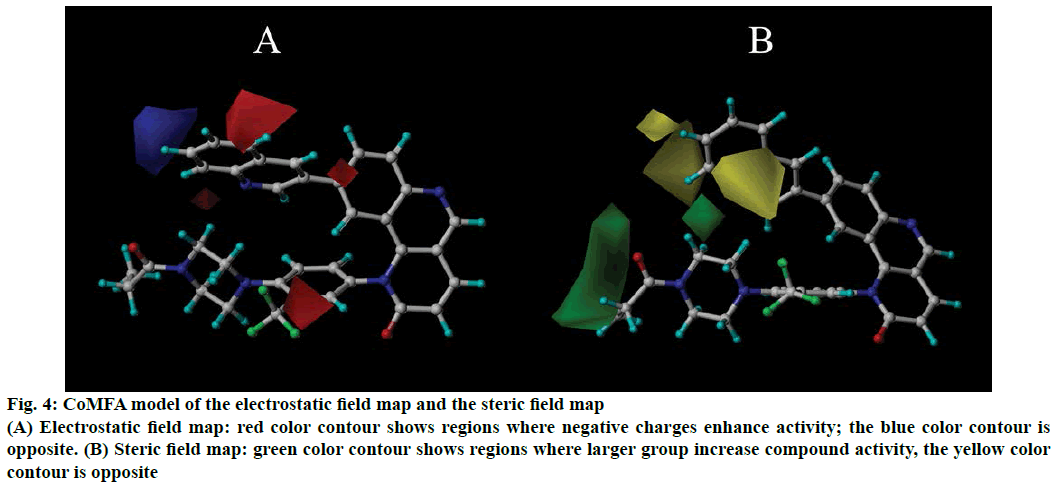
The 3D isopotential map of distinct field’s contribution of CoMFA and CoMSIA models were exemplified with the highest activity compound 45. In CoMFA model, the electrostatic field map (Figure 4A) and steric field map (Figure 4B) were shown in Figure 4. In Figure 4A, the red colour contour shows that add negative charge could enhance the compounds activity, the blue colour contour represents augment a positive group could increase activity of the compounds. According to the electrostatic contour map, a larger red colour contour in the position of quinoline ring in R1 substituent and the group “–CF3” in the R2 substituent that shows add negative charge will increase activity, such as compound 47 containing group “–CF3” and carbonyl, this has a higher activity than compound 46. In the steric field map (Figure 4B), the yellow colour contour indicates the regions where larger group decrease compounds activity, the green colour contour is opposite. From Figure 4B a larger green area at the carbonyl and ethyl groups of R2 substituent, which indicates there should be replace a larger group to increase activity, such as compounds 43 and 44 have a higher biological activity than compound 27. The R1 substituent of compound 30 is larger than compound 35 and 36, which make the compound 30 have a lower activity.
Figure 4: CoMFA model of the electrostatic field map and the steric field map
(A) Electrostatic field map: red color contour shows regions where negative charges enhance activity; the blue color contour is opposite. (B) Steric field map: green color contour shows regions where larger group increase compound activity, the yellow color contour is opposite
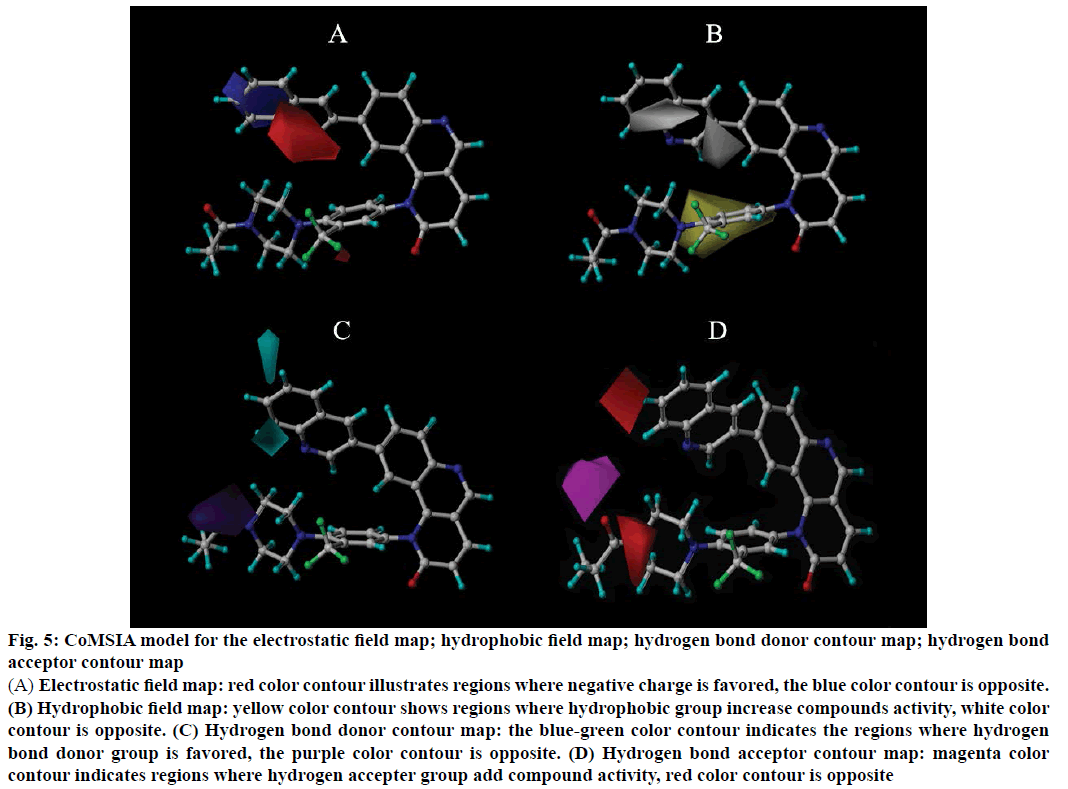
In CoMSIA model, four different fields named as electrostatic, hydrophobic, hydrogen bond acceptor and donor fields were analysed, and the four contour maps were displayed in Figure 5, Figure 5A is the electrostatic contour map, the blue colour contour indicates the regions where negatively charged group is disfavoured, while the red colour contour is opposite. There is a larger blue colour contour in the benzene of R1 position, that shows add positively charged group could increase compounds activity. Figure 5B is the hydrophobic contour map. The yellow colour contour represents regions where hydrophobic group is favoured, white colour contour refer to regions where hydrophobic group is disfavoured. From Figure 5B a larger yellow colour contour abound in the R2 position, which indicates add hydrophobic group could increase compounds activity, such as compound 43 has more hydrophobic group than the compound 39, thus result in compound 43 has a higher activity. There is a white group at R1 position, it shows incorporated hydrophilic groups can increase the compound activity, the compounds 2 and 3 contains “–NH2” group, which have a higher activity relatively.
The hydrogen bond donor contour map was shown in Figure 5C. The blue-green colour contour illustrates the regions where hydrogen bond donor group is favoured, while the purple colour contour is opposite. In the quinoline ring of R1 position has a large bluegreen colour contour, that shows introduce hydrogen bond donor could enhance compound activity, such as compound 17 contains a hydrogen bond donor “–NH2” group, which has a higher activity than compound 14. Figure 5D is the hydrogen bond acceptor contour map, the red colour contour shows the hydrogen bond acceptor is the disfavoured areas, however, the magenta colour contour is the favoured areas. From the Figure 5D, a magenta colour contour near the carbonyl of the R2 position, that reveals introduce hydrogen bond acceptor could beneficial to the compounds activity, The compound 44 has a higher activity than compound 42, because of compound 44 contains more hydrogen bond acceptor than the compound 42. A larger red colour contour on the quinoline ring of R1 position that indicates a hydrogen bond acceptor shouldn’t introduce in this position.
Figure 5: CoMSIA model for the electrostatic field map; hydrophobic field map; hydrogen bond donor contour map; hydrogen bond acceptor contour map
(A) Electrostatic field map: red color contour illustrates regions where negative charge is favored, the blue color contour is opposite. (B) Hydrophobic field map: yellow color contour shows regions where hydrophobic group increase compounds activity, white color contour is opposite. (C) Hydrogen bond donor contour map: the blue-green color contour indicates the regions where hydrogen bond donor group is favored, the purple color contour is opposite. (D) Hydrogen bond acceptor contour map: magenta color contour indicates regions where hydrogen accepter group add compound activity, red color contour is opposite
Based on the above analysis, the beneficial transformation sites of these compounds have been obtained. In the R1 position, small groups, hydrophilic groups such as amido, hydroxy and hydrogen bond donor groups should be introduced, which will enhances the compounds activity. In the R2 position, the electronegative substituent “N”, “O” and “F” groups should be introduced, the hydrophobic groups such as methyl, ethyl and phenyl were advantageous to compounds activity.
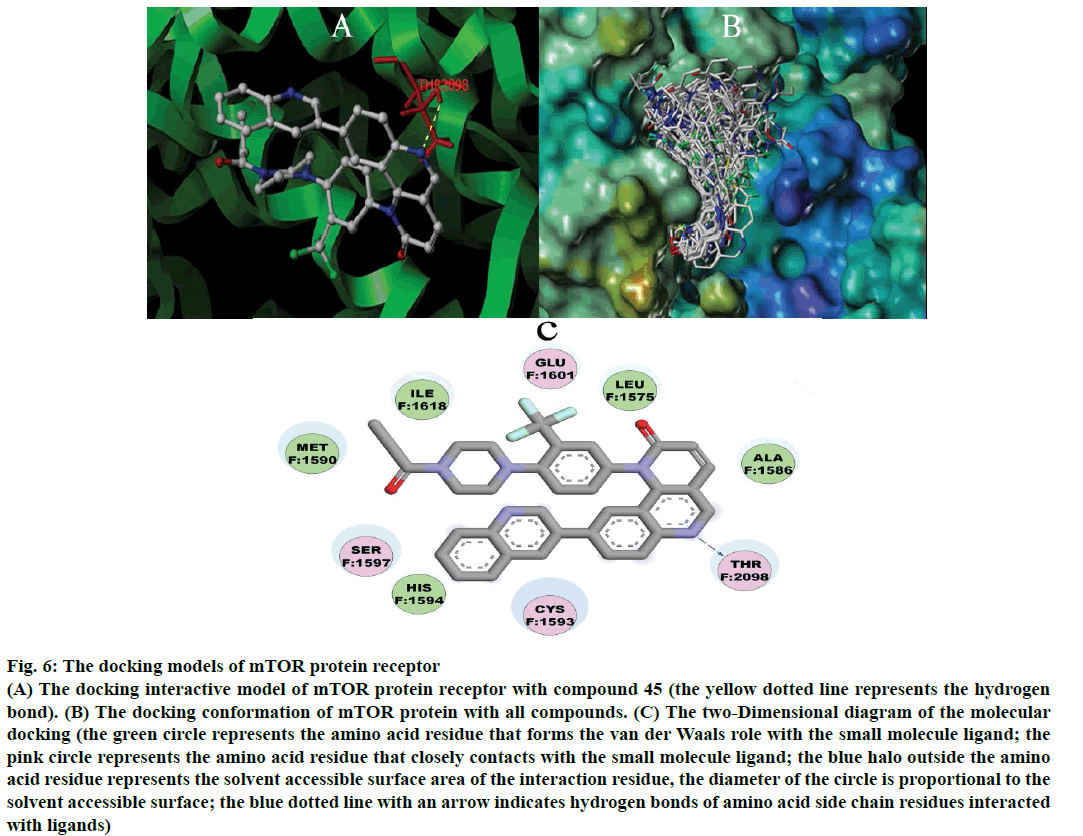
Molecular docking results were shown in Figure 6. Figure 6A is the highest activity molecule (compound 45) combined with the mTOR protein receptor (PDB: 5FLC) at the site of THR2098 (threonine) with hydrogen bond (the yellow dotted lines represent hydrogen bonds), which make the receptor and ligand combines more steadily. Molecular docking alignment was shown in Figure 6B, All 55 compounds were docked into the active pocket of mTOR. 55 compounds could be overlap together, which laid the structural foundation for the compounds inhibit mTOR. Figure 6C is the two-dimensional (2D) diagram of the molecular docking. It shows the interactions between the receptor (mTOR protein) and the ligand (compound 45), from the Figure 6C, the hydrogen bond of the compound 45 and mTOR protein receptor at site of THR2098. There are some hydrophilic amino acid residues such as SER1597 (serine), HIS1594 (histidine) and CYS1593 (cysteine) in the R1 position, and some hydrophobic amino acid residues MET1590 (methionine), ILE1618 (isoleucine), GLU1601 (glutamic acid), LEU1575 (leucine), in the R2 position, which shows introducing hydrophilic group at R1 position and hydrophobic group at R2 position are favoured for the binding between the receptor and ligand. These molecular docking results are well consistent with 3D-QSAR studies.
Figure 6: The docking models of mTOR protein receptor
(A) The docking interactive model of mTOR protein receptor with compound 45 (the yellow dotted line represents the hydrogen bond). (B) The docking conformation of mTOR protein with all compounds. (C) The two-Dimensional diagram of the molecular docking (the green circle represents the amino acid residue that forms the van der Waals role with the small molecule ligand; the pink circle represents the amino acid residue that closely contacts with the small molecule ligand; the blue halo outside the amino acid residue represents the solvent accessible surface area of the interaction residue, the diameter of the circle is proportional to the solvent accessible surface; the blue dotted line with an arrow indicates hydrogen bonds of amino acid side chain residues interacted with ligands)
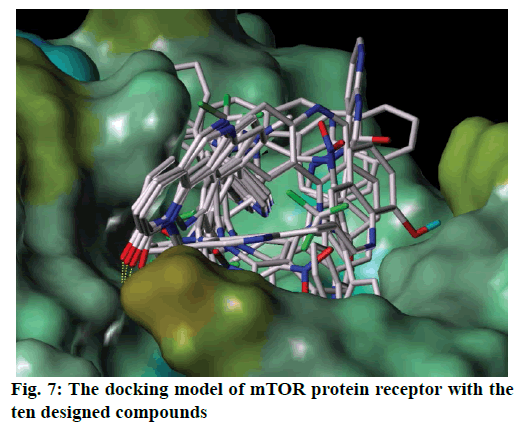
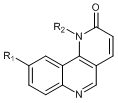
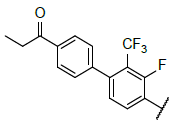
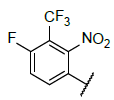
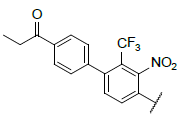
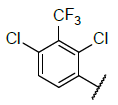
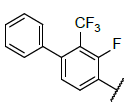
According to the 3D-QSAR, molecular docking and contour maps analysis, ten molecules which could have the ability to against mTOR were designed. The predicted activities of all designed molecules were shown in Table 4. Some designed molecules have higher inhibiting activity than 45 against mTOR, which would further verify the superiority of the 3D-QSAR models. Figure 7 is the molecular alignment of the ten designed compounds, ten compounds were docked into the active pocket of mTOR protein receptor. The binding mode shows the designed compounds have a good effect with the mTOR receptor.
 |
||||
| S. No. | Structure (R) | Predicted Value | ||
| R1 | R2 | CoMFA | CoMSIA | |
| 1 |  |
 |
9.046 | 9.319 |
| 2 |  |
 |
9.501 | 9.441 |
| 3 |  |
 |
9.155 | 8.954 |
| 4 | 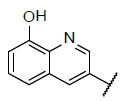 |
 |
9.381 | 9.176 |
| 5 |  |
 |
9.233 | 9.347 |
| 6 |  |
 |
9.639 | 9.509 |
| 7 | 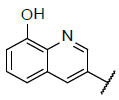 |
 |
9.217 | 9.671 |
| 8 |  |
 |
8.924 | 9.099 |
| 9 |  |
 |
8.976 | 8.902 |
| 10 |  |
 |
9.146 | 9.185 |
Table 4: Designed Molecules and Predicted Active Values
In this work, the study of benzo[h] [1,6] naphthyridin- 2(1H)-one analogues compounds of mTOR inhibitors based on 3D-QSAR and molecular docking model have been analysed in detail. The combined fields of CoMFA and CoMSIA were be used to analyse the structure-activity relationship of these compounds and then getting a stable and direct model. By analysing the interaction of each field of the three-dimensional contour maps, the beneficial transformation sites of these compounds have been obtained. From the molecular docking analysis, that provided a further insight into ligand-receptor interaction, and the results of molecular docking matched with 3D-QSAR. Based on a detailed analysis of QSAR and molecular docking, ten novel mTOR inhibitors were designed, and then the activity of these compounds were predicted. Together with the 3D-QSAR and molecular docking study, more information about the transformation of the benzo[h] [1,6] naphthyridin-2(1H)-one scaffold compounds could be provided, these studies offer guidelines for designing higher activity mTOR inhibitors with novel structures.
Acknowledgements
The authors are grateful to the Key Project of Natural Science Foundation of Chong Qing for financial support (No. cstc2015jcyjBX0080).
Conflicts of interest
There are no conflicts of interest.
Financial support and sponsorship
Nil.
References
- Foster KG, Fingar DC. Mammalian target of rapamycin (mTOR): conducting the cellular signaling symphony. J BiolChem 2010;285:14071-7.
- Yang H, Rudge D G, Koos J D, Vaidialingam B, Yang HJ, Pavletich NP. mTOR kinase structure, mechanism and regulation by the rapamycin-binding domain. Nature 2013;497(7448):217-23.
- Kim YC, Guan KL. mTOR: a pharmacologic target for autophagy regulation. J Clin Invest 2015;125:25-32.
- Tao ZH, Barker J, Shi SD, Gehring M, Sun SX. Steady-state kinetic and inhibition studies of the mammalian target of rapamycin (mTOR) kinase domain and mTOR complexes. Biochemistry 2010;49:8488-98.
- Aylett CH, Sauer E, Imseng S, Boehringer D, Hall MN, Ban N, Maier T. Architecture of human mTOR complex 1. Science 2015;351(6268):48-52.
- Dehnhardt CM, Venkatesan AM, Santos ED, Chen ZC, Santos O, Ayral-Kaloustian S, et al. Lead optimization of N-3-substituted 7-morpholinotriazolopyrimidines as dual phosphoinositide 3-kinase/mammalian target of rapamycin inhibitors: discovery of PKI-402. J Med Chem 2010;53:798-810.
- Laplante M, Sabatini DM. mTORsignaling in growth control and disease. Cell 2012;149:74-93.
- Poulsen A, Nagaraj H, Lee A, Blanchard S, Soh CK, Chen DZ, et al. Structure and ligand-based design of mTOR and PI3-kinase inhibitors leading to the clinical candidates VS-5584 (SB2343) and SB2602. J ChemInf Model 2014;54:3238-50.
- Shaw RJ, Cantley LC. Ras, PI(3)K and mTOR signalling controls tumour cell growth. Nature 2006;441(7092):424-30.
- Fan QW, Weiss WA. Inhibition of PI3K-Akt-mTOR signaling in glioblastoma by mTORC1/C2 inhibitors. Methods MolBiol 2012;821:349-59.
- Zeng ZH, Sarbassov DD, Samudio IJ, Yee KW, Munsell MF, Jackson CE, et al. Rapamycin derivatives reduce mTORC2 signaling and inhibit AKT activation in AML. Blood 2007;109:3509-12.
- Nguyen SA, Walker D, Gillespie MB, Gutkind JS, Day TA. mTOR Inhibitors and its role in the treatment of head and neck squamous cell carcinoma. Curr Treat Option Oncol 2012;13:71-81.
- Korets SB, Musa F, Curtin J, Blank SV, Schneider RJ. Dual mTORC1/2 inhibition in a preclinical xenografttumor model of endometrial cancer. GynecolOncol2014;132:468-73.
- Haagensen EJ, Kyle S, Beale GS, Maxwell RJ, Newell DR. The synergistic interaction of MEK and PI3K inhibitors is modulated by mTOR inhibition. Br J Cancer 2012;106:1386-94.
- Nasr AB, Ponnala D, Sagurthi SR, Kattamuri RK, Marri VK, Gudala S, et al. Molecular docking studies of FKBP12-mTOR inhibitors using binding predictions. Bioinformation 2015;11:307-15.
- Serra V, Markman B, Scaltriti M, Eichhorn PJ, Valero V, Guzman M, et al. NVP-BEZ235, a dual PI3K/mTOR inhibitor, prevents PI3K signaling and inhibits the growth of cancer cells with activating PI3K mutations. Cancer Res 2008;68:8022-30.
- Liu TJ, Koul D, LaFortune T, Tiao NY, Shen RJ, Maira SM, et al. NVP-BEZ235, A novel dual PI3K/mTOR inhibitor, elicits multifaceted antitumor activities in human gliomas. Mol Cancer Ther 2009;8:2204-10.
- Hansch C, Hoekman D, Gao H. Comparative QSAR: toward a deeper understanding of chemicobiological interactions. Chem Rev 1996;96:1045-76.
- Bhadoriya KS, Sharma MC, Jain SV, Raut GS, Rananaware JR. Three-dimensional quantitative structure–activity relationship (3D-QSAR) analysis and molecular docking-based combined in silicorational approach to design potent and novel TRPV1 antagonists. Med Chem Res 2013;22:2312-27.
- Kumari M, Chandra S, Tiwari N, Subbarao N. 3D QSAR, pharmacophore and molecular docking studies of known inhibitors and designing of novel inhibitors for M18 aspartylaminopeptidase of Plasmodium falciparum. BMC StructBiol 2016;16:1-11.
- Lopiccolo J, Blumenthal GM, Bernstein WB, Dennis PA. Targeting the PI3K/Akt/mTOR pathway: effective combinations and clinical considerations. Drug Resist Updat 2008;11:32-50.
- Mortensen DS, Perrin-Ninkovic SM, Shevlin G, Elsner J, Zhao JJ, Whitefield B, et al. Optimization of a series of triazole containing mammalian target of rapamycin (mTOR) kinase inhibitors and the discovery of CC-115. J Med Chem 2015;58:5599-608.
- Liu QS, Chang JW, Wang JH, Kang SA, Thoreen CC, Markhard A, et al. Discovery of 1-(4-(4-Propionyl-piperazin-1-yl)-3-(trifluoromethyl)phenyl)-9-(quinolin-3-yl)benzo[h][1,6]naphthyridin-2(1H)-one as a highly potent, selective mammalian target of rapamycin (mTOR) inhibitor for the treatment of cancer. J Med Chem 2010;53:7146-55.
- Liu QS, Wang JH, Kang SA, Thoreen CC, Hur W, Ahmed T, et al. Discovery of 9-(6-Aminopyridin-3-yl)-1-(3-(trifluoromethyl)-phenyl)benzo[h][1,6]naphthyridin-2(1H)-one(Torin2) as a potent, selective, and orally available mammalian target of rapamycin (mTOR) inhibitor for treatment of cancer. J Med Chem 2011;54:1473-80.
- Khanfar MA, Youssef DT, El Sayed KA. 3D-QSAR studies of Latrunculin based actin polymerization inhibitors using CoMFA and CoMSIA approaches. Eur J Med Chem 2010;45:3662-8.
- Sun J, Dahan A, Amidon GL. Enhancing the intestinal absorption of molecules containing the polar guanidino functionality: a double-targeted prodrug approach. J Med Chem 2010;53:624-32.
- Ran T, Lu T, Yuan HL, Liu HC, Wang J, Zhang WW, et al. A selectivity study on mTOR/PI3Kα inhibitors by homology modeling and 3D-QSAR. J Mol Model 2012;18:171-86.
- Sridhar J, Foroozesh M, Klein Stevens CL. QSAR models of cytochrome P450 enzyme 1A2 inhibitors using CoMFA, CoMSIA and HQSAR. SAR QSAR Environ Res 2011;22:681-97.
- Tanneeru K, Reddy BM, Guruprasad L. Three-dimensional quantitative structure–activity relationship (3D-QSAR) analysis and molecular docking of ATP-competitive triazineanalogs of human mTOR inhibitors. Med Chem Res 2012;21:1207-17.
- Luo XY, Shu M, Wang YQ, Liu J, Yang WJ, Lin ZH. 3D-QSAR studies of dihydropyrazole and dihydropyrrole derivatives as inhibitors of human mitotic kinesin Eg5 based on molecular docking. Molecules 2012;17:2015-29.
 represents testing sets. A: CoMFA; B: CoMSIA