- *Corresponding Author:
- M. Senthilraja
Department of Pharmaceutical Analysis, J. K. K. Nataraja College of Pharmacy, Salem Main Road, Komarapalayam-638 183, India
E-mail: rajdanish2 k@gmail.com
| Date of Submission | 8 July 2011 |
| Date of Revision | 1 July 2011 |
| Date of Acceptance | 23 April 2010 |
| Indian J Pharm Sci, 2011, 73 (4): 436-438 |
Abstract
Rapid determination of the absorptivity for a recombinant IgG monoclonal antibody using the Beckman equipped with both Raleigh interference and UV absorbance optical systems. The analytical ultracentrifuge data for determining spectrophotometric absorptivities is compared to experimental data from quantitative amino acid analysis and an enzymatic digestion method.
Keywords
Antibody, absorptivity, spectrophotometer, ultracentrifugation, UV absorbance
Spectrophotometric determination of protein concentrations is an important analytical tool for nearly all phases of protein drug development and manufacturing. Determinations of absorptivities (A 0.1%) and molar extinction coefficients for protein solutions require at least one initial, accurate measurement of protein concentration. Traditionally, this crucial concentration has been determined by dry weight analysis, total nitrogen analysis, or quantitative amino acid analysis. Unfortunately, these techniques are labor intensive, may require relatively large sample size and can give unreliable results. It has been suggested that the refractive increment of a protein is relatively insensitive to its amino acid composition and therefore may be used universally to determine protein concentration [1,2]. An analytical ultracentrifuge equipped with interference optics has been used previously to determine protein concentration [2]. This publication describes the rapid determination of the absorptivity for a recombinant IgG monoclonal antibody using the Beckman equipped with both Raleigh interference and UV absorbance optical systems. The analytical ultracentrifuge data for determining spectrophotometric absorptivities is compared to experimental data from quantitative amino acid analysis and an enzymatic digestion method.
The monoclonal antibody was supplied by Protein Recovery Sciences, Genentech, Inc. The sample was dialyzed to equilibrium in a suitable formulation buffer and diluted with the solvent to an optical density range of 0.8-1.2 at a wavelength of 280 nm.
Quantitative amino acid analysis was used in conjunction with the theoretical amino acid composition (based on expected composition from cDNA) to determine the antibody concentration. This concentration was then used to calculate the absorptivity. Samples were analyzed on two different days, and triplicates were run on each sample.
A modification of the method of Bewley [3] was also used for determining protein concentration. Absorption spectra of the protein in formulation buffer were measured on an AVIV 14DS UV/ Vis spectrophotometer. Four matched 1-cm cells were used. The reference cell contained 1ml of placebo, while the three sample cells contained 1ml of monoclonal antibody solution. The protein concentration (unknown) was adjusted with buffer to produce an absorbance between 0.8-1.2 absorbance units. Initially, the absorption spectrum of native antibody was obtained from the difference between reference and sample spectra. In the next step, each of the antibody samples was digested in the sample cell by acidification with 0.06 M HCl and addition of Aspergillus acid proteinase and pepsin. The reference cell was treated identically. Spectra were measured after complete digestion at room temperature (4- 12 h). All absorption spectra were corrected for light scattering by a log-log procedure [4]. Second-order spectra were obtained from the zero-order data with software provided by AVIV Associates. Rapid and Sequential Measurement of Absorption and Refractive Increment: Absorption spectra and an interference fringe pattern of the native antibody were measured on an Optima XL-I analytical ultracentrifuge with integrated absorbance and Raleigh interference optics. The reference (400°) and antibody (190°) were placed in a synthetic boundary cell with a 1.2-cm path. All measurements of absorption and fringe displacement were done in the same cell in approximately 10 min with a rotor speed of 3000 rpm/min at 20°. The detection wavelength was 280 nm and 670 nm for absorption and fringe displacement, respectively. (Note: We used a prototype instrument for our analyses; the final version has 675 nm detection, not 670 nm).
Table 1 shows the intra-assay and inter-assay variability that may occur when using quantitative amino acid analysis for protein concentration determination. The two monoclonal antibody absorptivity values obtained by this procedure were 1.71 ± 0.03 and 1.17 ± 0.22 ml/mg/cm. In addition to such variable results, the time for digestion and analysis requires a turnaround time of at least 24 h.
| Number of assay | Protein concentration (mg/ml)* | A 0.1% (ml/mg/cm)* |
|---|---|---|
| Assay # 1 | 0.97 | 1.68 |
| 0.94 | 1.73 | |
| 0.95 | 1.72 | |
| Mean (n=3) | 0.950 ± 0.02 | 1.71 ± 0.03 |
| Assay # 2 | 1.12 | 1.38 |
| 1.46 | 1.10 | |
| 1.58 | 1.08 | |
| Mean (n=3) | 1.39 ± 0.25 | 1.14 ± 0.27 |
Table 1: Absorptivity determined by Quantitative amino acid analysis of Monoclonal antibody
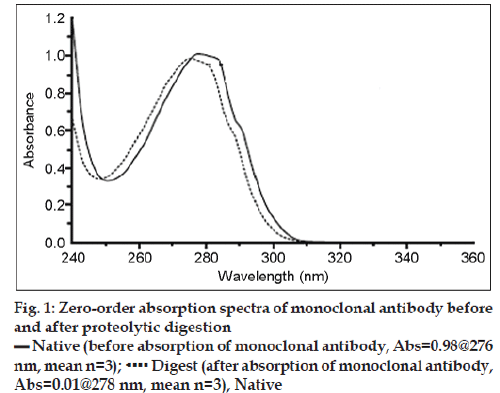
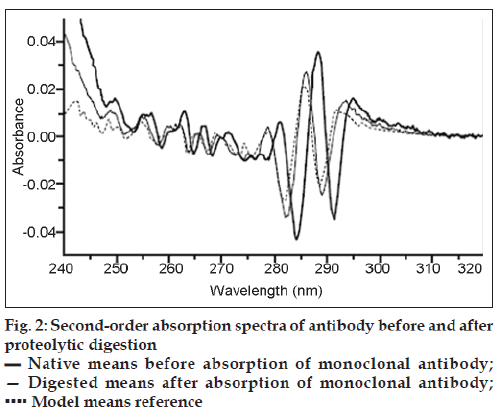
The enzymatic digestion procedure is based on the classic hyperchromic effect of polypeptide folding on the UV absorption spectra of a protein. The absorption spectra of antibody before and after proteolytic digestion are shown in fig. 1. Upon destruction of the protein conformation, the spectrum undergoes the well-known denaturation “blue shift,” including a loss in absorbance. A model UV spectrum, which represents the protein’s absorptivity in the absence of any conformational effects, was obtained from the amino acid composition of the monoclonal antibody. This model spectrum is a linear combination of experimentally determined spectra of the model compounds N-acetyl-L-Trp-amide, N-acetyl-LTyramide, N-acetyl-L-Phe-ethyl ester, and glutathione. The second derivative of a UV spectrum provides additional information of absorbance inflections as a function of wavelength. The second derivative spectrum of proteolitically digested antibody is almost identical to that of the model UV spectrum fig. 2. This strongly suggests that the proteolytic digestion was sufficient to eliminate any effect of protein structure on the protein UV absorption spectrum, and the computed model absorptivity of 1.509 at 275.7 nm should be equivalent to the digested sample. The absorptivity of a 0.1% solution of the native folded protein at the wavelength of maximum absorbance can be related to the model absorptivity and the absorbance before and after digestion. The absorptivity of native rhuMAbE25 at 278.4 nm was determined for triplicate samples by this method to be 1.543 ± 0.004 (mg/ml)-1 cm-1.
A rapid method for determining absorptivity utilizes the analytical ultracentrifuge equipped with two optical systems, one spectrophotometric and the other interferometric. The absorbance of monoclonal antibody was determined by subtracting the mean value of the baseline from the plateau. No further correction of light scattering has been applied to this absorption value. The fringe displacement (dJ) of 3.32 ± 0.035 fringes for the antibody was determined by subtracting the mean value of the baseline from the plateau. The concentration (C) of protein is related to the measured fringe displacement by the following equation [5]. C=DJ/k…(1) Where DJ is the fringe displacements k is the specific fringe displacement constant for a cell optical pathlength (L) defined by: k=(dn/dc)/L… (2). The specific refractive increment dn/dc for human γ-globulin was estimated to be 0.187 (g/ml)-1 (6) at 670 nm, the wavelength of the laser light source used in the Optima XL-I refractive optical system, at 20-25°. These values result in a computed value for k of 3.31 (mg/ml)-1 that is used to convert the measured fringe displacement J into a concentration value. The determined concentration together with the measured absorbance at 280 nm of 1.89 resulted in an absorptivity of 1.57 (mg/ ml)-1 cm-1, in good agreements with the value determined by enzymatic digestion. The molecular weight of 148 kDa determined from sedimentation equilibrium (data not shown) results in a molar extinction coefficient of 2.32 ± 105 M-1 cm-1.
This publication demonstrates the feasibility of rapid and accurate determination of absorptivity and molar extinction coefficients using the integrated UV and interferometric optical systems of the Optima XL-I analytical ultracentrifuge. The entire procedure took less than 10 min and resulted in a determined absorptivity that was in excellent agreement with the value determined by the enzymatic digestion procedure. The values determined by the more traditional quantitative amino acid analysis were variable, ranging from 1.01 to 1.73 (mg/ml)-1 cm-1. The values lower than the predicted model value of 1.509 (mg/ml)-1 cm-1 are likely incorrect since the model value is that expected for a completely unfolded protein. The use of an immunoglobulin for this demonstration was predicated on the fact that dn/dc values reported for γ-globulins from different laboratories are consistent once corrected for wavelength dependence by the method of Pearlmann and Longsworth [6]. A critical assumption in this methodology is that the specific refractive increment for proteins is nearly independent of amino acid composition. An inspection of refractive increment tables shows that although this is generally correct, there can be substantial variability. Some of this variability may be due to errors in protein concentration determination, and some may be due to contributions from carbohydrate. A systematic study of the effect of carbohydrate and amino acid composition on dn/dc may eventually make the analytical ultracentrifuge the method of choice for rapid and accurate determination of protein absorptivity and molar extinction values. Alternatively, it should be possible to compute refractive increment. It has been demonstrated that refractive index can be calculated from amino acid composition, partial specific volume, and refraction per gram amino acid residue. As previously suggested this methodology needs to be extended to contributions from prosthetic groups such as heme as well as carbohydrate [3-8].
References
- Babul J, Stellwagen E. Measurement of protein concentration with interference optics. Anal Biochem 1969;28:216-21.
- Schachman HK. Is there a future for the ultracentrifuge? In: Harding SE, Rowe AJ Horton JC, editors. Analytical Ultracentrifugation in Biochemistry and Polymer Science. Cambridge: Royal Society Chemistry; 1992. p. 3-15.
- Bewley TA. A novel procedure for determining protein concentrations from absorption spectra of enzyme digests: Anal Biochem 1982;123:55-65.
- Winder AF, Gent WLG. Correction of light-scattering errors in spectrophotometric protein determinations. Biopolymers 1971;10:1243-51.
- Fasman GD. CRC Handbook of Biochemistry and Molecular Biology. 3rd ed. Cleveland (Ohio): CRC Press; 1976.
- Pearlmann GE, Longsworth LG. The specific refractive increment of some purified proteins. J Am Chem Soc 1948;70:2719-21.
- Van Holde KE. Physical Biochemistry. 2nd ed. Englewood Cliffs (NJ): Prentice Hall Inc: 1971.
- McMeekin TL, Wilensky M, Groves ML. Refractive indices of proteins in relation to amino acid composition and specific volume. Biochem Biophys Res Commun 1962;7:151-6.


