- *Corresponding Author:
- V. S. Mannur
Department of Pharmaceutical Quality Assurance
KLE College of Pharmacy
KLE Academy of Higher Education and Research
Belagavi-590010, India
E-mail: drvsmannur@gmail.com
| Date of Received | 22 December 2019 |
| Date of Revision | 05 June 2020 |
| Date of Acceptance | 30 June 2020 |
| Indian J Pharm Sci 2020;82(4):640-649 |
This is an open access article distributed under the terms of the Creative Commons Attribution-NonCommercial-ShareAlike 3.0 License, which allows others to remix, tweak, and build upon the work non-commercially, as long as the author is credited and the new creations are licensed under the identical terms
Abstract
The present study aims to develop Herbal Antioxidant Supplement by using Quality by Design approach. Quality target product profile for Herbal Antioxidant Supplement was defined and critical quality attributes were identified. Initial Risk assessments of critical materials were done by employing Risk Priority Number. The effects of critical parameters (concentration of starch and croscarmellose sodium) were investigated by executing design of experimentation using Central Composite Design. The optimized formulation was evaluated for Antioxidant activity by in-vitro model like free radical scavenging by 2, 2-Diphenyl-1- picrylhydrazyl method. It was observed that formulation variables X1: Starch and X2: Croscarmellose sodium showed significant effect on the response Y1: Disintegration time (min) and response Y2: Friability (%). The Formulation comprising starch-30 mg/tab and Croscarmellose sodium-30mg/tab fulfils the criteria of quality target product profile and Certified Quality Auditor for Herbal Antioxidant Supplement. In-vitro antioxidant screening revealed that the developed Herbal Antioxidant Supplement has proved to show pronounced antioxidant activity. This study confirmed that quality by design is an effective approach for understanding the quality parameters for optimizing Herbal Supplement.
Keywords
Quality by Design (QbD), Herbal supplement, Quality target product profile (QTPP), Critical quality Attributes (CQA), and Central composite design
Herbal medicinal system is old and is practiced from the beginning of mankind [1]. Since ancient times herbal drugs have been used as medicines for the treatment of a wide range of diseases. Herbal supplements have played an important role in world health and make an important contribution to health care in spite of the great advances observed in modern medicine in recent decades [2].
According to an estimate of the World Health Organization (WHO), about 80 % of the world population uses herbs and other traditional medicines. They are known for their safety, efficacy, cultural acceptability and lesser side effects. This has led to phenomenal increase in the demand for herbal supplements in the last two decades and a need has been felt for ensuring the quality, safety and efficacy of herbal drugs [3].
Since Quality and safety is considered to be a major issue with the use of herbal supplements, it becomes imperative, that appropriate quality assessment measures should be put in place to protect public health by ensuring that all herbal medicines are safe and of suitable quality [4]. The need of the h is to evolve a systematic approach and to develop well-designed methodologies for the development herbal products.
The quality by design (QbD) is defined as “A systematic approach to development that begins with predefined objectives and emphasizes product and process understanding and process control, based on sound science and quality risk management” [5].
The QbD concept was first coined by Joseph M. Juran in 1992 in order to manage the quality control issues involved in the manufacturing processes. The motive behind the philosophy of QbD was to aim that the quality should be built into the product from the onset [6].
Recently, the US Food and Drug Administration introduced QbD as a fundamental pharmaceutical quality model to be considered in the development of pharmaceutical products and processes [7]. According to Zhang et al., 2013 in spite of the extensive usage of herbal drugs, QbD implementation cases in the manufacture of herbal drugs have been rarely reported. Taking into account the fact that experience-based methods are dominantly used during the manufacture of herbal drug products, which fail to improve process understanding due to the complex chemical constitution and multiple process variables, it is therefore significant to develop manufacturing process under the framework of QbD, which aims to move the formulation process away from empirical trial-and-error approaches and to orient the processes into predictable and precisely controlled environments to ensure product quality within the life cycle [8].
It is therefore important that a QbD model should be implemented for the development of herbal medicines in order to achieve a significant level of safety, efficacy, and quality for commercial herbal products [6].
Antioxidants or oxidation inhibitors are moieties which prevent or retard the oxidation and in general prolong the life of the oxidizable matter. Antioxidants of natural origin have the potential to protect cells from oxidative stress via a number of pathways. Since oxidative stress is main reason for a variety of degenerative diseases such as cancer, atherosclerosis, cardiovascular diseases, ageing and inflammatory diseases. These natural antioxidants can thus contribute significantly towards human welfare [9,10]. Based on the evidences from the previous literature Camelia sinensis (green tea), Curcuma longa (turmeric), Emblica officinalis (amla) and Piper nigrum (black pepper) are reported to have potent antioxidant activity. Hence this paper attempts to develop an antioxidants rich herbal supplement by implementation of QbD approach.
Materials and Methods
Herbal extracts of Curcuma longa (turmeric) and Emblica officinalis (amla) was received as a gift sample from Natural remedies Pvt. Ltd. Bangalore. Extracts of Camelia sinensis (green tea) and Piper nigrum (black pepper) was provided by Pukhraj herbals, Mandsaur (M.P.) India. Starch (binder) was obtained from Colorcon Pvt. Ltd. India. Croscarmellose sodium (disintegrating agent) was obtained from M/s Ozone® International, Mumbai. Lactose anhydrous (bulking agent), talc (glidant) and magnesium stearate (lubricant) were procured from M/s Hi Media Laboratories Pvt. Ltd. India. All other chemicals and reagents were of analytical grade.
Quality Target Product Profile (QTPP) for Herbal antioxidant supplement:
The Quality Target Product Profile (QTPP) as described in International Council for Harmonisation (ICH) Q8 is an essential element of a qbD approach. The QTPP includes all product attributes that are needed to ensure equivalent safety and efficacy [5]. QTPP for herbal antioxidant supplements has been developed by taking into account the important drug product quality attributes specifications.
Critical Quality Attributes (CQA):
Critical quality attribute (CQA) is “a physical, chemical, biological, or microbiological property or characteristic that should be within an appropriate limit, range, or distribution to ensure the desired product quality [5]. The initial CQA’s were defined from QTPP to identify satisfactory quality of the product. The potential CQAs of excipients required for development of Polyherbal formulation were identified to have minimum disintegration with maximum hardness at friability not greater than 1 %.
Risk assessment:
To identify all the potential high risk factors for further study, risk assessment was conducted. In the risk assessment process, Risk Priority Numbers (RPN) was mapped onto three categories (high, medium and low). The initial risk assessment for critical input material and formulation components and their impact on the product quality was determined [11].
Design of experiments (DoE):
A structured, organized method for determining the relationship between factors affecting a process and the output of that process. Also known as “Design of Experiments” [8].
A central composite design (CCD) was employed for the development and optimization of Herbal antioxidant tablets. In the design, two factors each were evaluated at three levels and experimental trials were performed. Two independent variables i.e., amount of Starch (Binder X1) and amount of Croscarmellose Sodium (Disintegrant X2) were varied at three different levels that were coded for low, medium and high (-1, 0, +1 respectively). The response variables i.e. Disintegration Time (Y1) and % Friability (Y2) were selected for present study. The experiments were designed by using Design Expert software version 11.0, (Stat-Ease Inc., Minneapolis, MN, USA). A total of 9 formulations were designed and developed using the software as shown in (Table 1). The DoE software was used to gain the information on the critical values required to achieve the desired response of the selected independent variables.
| Code | Coded levels | Actual values (mg) | ||
|---|---|---|---|---|
| X1 | X2 | X1 | X2 | |
| F1 | -1 | -1 | 30 | 20 |
| F2 | -1 | 0 | 30 | 25 |
| F3 | +1 | 0 | 40 | 25 |
| F4 | +1 | -1 | 40 | 20 |
| F5 | -1 | +1 | 30 | 30 |
| F6 | 0 | -1 | 35 | 20 |
| F7 | 0 | +1 | 35 | 30 |
| F8 | +1 | +1 | 40 | 30 |
| F9 | 0 | 0 | 35 | 25 |
X1 is concentration of Starch, X2 is concentration of Croscarmellose Sodium
Table 1: Selected Factor Combinations as per 32 Full Factorial Design
Preparation of Herbal antioxidant tablet supplement:
The Wet Granulation technique was used for the formulation of Herbal antioxidant tablet supplement. Based on the literature review the herbal tablets were developed, (Table 2) lists the formulation trial batches of Herbal antioxidant tablet supplement.
| Ingredients | F1 | F2 | F3 | F4 | F5 | F6 | F7 | F8 | F9 |
|---|---|---|---|---|---|---|---|---|---|
| Turmeric Extract | 200 | 200 | 200 | 200 | 200 | 200 | 200 | 200 | 200 |
| Green tea Extract | 200 | 200 | 200 | 200 | 200 | 200 | 200 | 200 | 200 |
| Amla Extract | 100 | 100 | 100 | 100 | 100 | 100 | 100 | 100 | 100 |
| Black pepper Extract | 10 | 10 | 10 | 10 | 10 | 10 | 10 | 10 | 10 |
| Starch | 30 | 30 | 40 | 40 | 30 | 35 | 35 | 40 | 35 |
| Croscarmellose Sodium | 20 | 25 | 25 | 20 | 30 | 20 | 30 | 30 | 25 |
| Lactose | 31 | 26 | 16 | 21 | 21 | 26 | 16 | 11 | 21 |
| Talc | 06 | 06 | 06 | 06 | 06 | 06 | 06 | 06 | 06 |
| Magnesium stearate | 03 | 03 | 03 | 03 | 03 | 03 | 03 | 03 | 03 |
F1-F9 represents total 9 formulation trial batches, concentration of each ingredient is expressed in milligram per tablet
Table 2: Formulation Trial Batches of Herbal Antioxidant Tablets
All the herbal ingredients i.e., turmeric, green tea, amla and black pepper extract were accurately weighed and passed through sieve no.200 separately. Due to hygroscopicity of Amla extract; Amla extract was triturated with accurately weighed quantity of anhydrous lactose (dry mixture). Starch was weighed and made into translucent granulating paste with required quantity of water. The remaining herbal ingredients i.e., Turmeric extract, Green tea and Black pepper extract along with Croscarmellose sodium were mixed with this granulating paste until a wet coherent mass was formed. The resulting wet coherent mass was then passed through sieve 10 to form granules. The granules were kept in oven at 40-45° until the granules were properly dried. After proper drying the granules were passed through sieve no. 22 mesh superimposed on sieve no. 44 mesh to separate granules from fines. The granules were then mixed thoroughly with the dry mixture of Amla extract and accurately weighed quantity of talc and magnesium stearate. The resulting granule mix were checked for Micromeritics properties such as angle of repose, bulk density, tap density, Hausner ratio and compressibility index. Finally the Round and biconvex shaped tablets, with average weight of 600 mg were compressed by using Rimek10 station single rotary tablet press with a die size of 12 mm.
Physical characterization of the tablets:
The compressed tablets were evaluated for various physical characteristics like weight variation, friability, thickness, hardness and disintegration time using pharmacopoeia methods [12]. Moisture content of the tablet were performed by thermo-gravimetric method i.e. by loss on drying method [13].
Statistical optimization:
The evaluation of the quality of fit of the model was performed by using analysis of variance (ANOVA) technique. Based on comparison of several statistical parameters the best fit model was selected, the statistical parameters included the R2-coefficient of determination; Adjusted R2, SS-Sum of squares, MS-Mean of square, DF-Degrees of freedom, F-value- Fischer’s ratio and p-probability provided by DOE software. The relationship between the dependent and independent variables was demonstrated using response surface plots i.e. Contour and 3-D surface plots. These plots were used to study the effect of various factors on the response at a given time. Finally, a numerical optimization technique (desirability approach) and a graphical optimization technique (overlay plots) were used to identify the optimized Formulation [14].
Validation of the optimized formulation:
The optimized formulations of herbal antioxidant tablet supplements with the predicted levels were prepared to confirm the validity of the optimization procedure. To validate the chosen experimental design, the responses of experimental values were quantitatively compared with responses of predicted values [15].
Control strategy:
A control strategy is designed to ensure that a product of required quality will be produced consistently. The control strategy is an integrated overview of how quality is assured based on current process and product knowledge. Control strategy include parameters and attributes related to drug substance and drug product materials and components, and the associated methods and frequency of monitoring and control [5].
Stability study:
Stability studies were carried out for statistically optimized formulation according to the International Council for Harmonization (ICH) Q1A (R2) guidelines. [16] The samples were stored in closed high density polyethylene (HDPE) bottle which was maintained at room temperature 27°±2°/ RH 65±5 % and Accelerated conditions 40°±2°/ RH 75±5 % for 45 d. The tablets were withdrawn after a period of 15 d, 30 d and 45 d and evaluated for weight variation, hardness, disintegration and friability.
In-vitro Antioxidant activity:
Antioxidant activity of optimized formulation was assessed by using the free radical generator DPPH (2,2-diphenyl-1- picrylhydrazyl). Different concentrations of herbal antioxidant tablet were prepared in methanol ranging from 20 μg/ml to 100 μg/ml. Standard DPPH solution containing 400 μmol DPPH was prepared in methanol. Standard DPPH solution was then mixed with test drug dilution at a ratio 1:2 i.e.,1ml of test extract was mixed with 2ml of Standard DPPH solution in different properly closed containers. The mixtures were kept in the dark at a room temperature for 30 min. [17] Control was prepared by adding methanol. Absorbance of resulting solution was measured using U.V. Spectrophotometer at 517 nm (Shimadzu UV-1800, Japan).
Scavenging activity was calculated by using equation:
Scavenging activity (%) = Abs of control-Abs of sample Abs of control / Abs of control×100
The antioxidant activity is expressed as IC50. The IC50 value is the measure of concentration in μg/ml of extract that inhibits 50 % of DPPH radicals. IC50 value was statistically determined by using Graph Pad Prism version 7 to express antioxidant activity.
Results and Discussion
QTPP serves as a summary of quality attributes of a drug product that need to be achieved to ensure its safety and efficacy. The QTPP for Herbal Antioxidant tablet supplement shown in (Table 3) consist of information regarding dosage form, dosage design, route of administration, dosage strength, drug product quality attributes, container closer system and storage conditions.
| QTPP Elements | Target | Justification |
|---|---|---|
| Dosage form | Tablet | For patient acceptability |
| Dosage design | Conventional release tablet | Patient acceptability & compliance |
| Route of Administration | Oral | Dosage form designed to be administered orally |
| Dosage strength | 510 mg | Therapeutic Dose |
| Drug product Quality Attributes | ||
| Appearance | Tablet confirming to description shape and size | Patient acceptability & compliance |
| Hardness | 3-5 kg | As per Pharmacopoeial specifications |
| Friability | NMT 1.0 % | |
| Disintegration | NMT 15 min | |
| Container closer system | Container closure system qualified as suitable for this drug product | Needed to achieve the target shelf-life & to ensure tablet integrity during storage |
| Storage condition | Store in air-tight container in a cool place. | To maintain product integrity and quality upon storage |
| Critical Quality Attributes | ||
| Disintegration time | NMT 15 min | Failure to meet the disintegration time can impact on efficacy |
| Friability | NMT 1.0 % | In order to meet Pharmacopoeial specification |
QTPP stands foe Quality Target Product Profile; CQA stands for Critical Quality Attributes
Table 3: QTPP and CQA’s for Herbal Antioxidant Tablet Supplement
The initial CQA’s were defined from QTPP to identify satisfactory quality of the product. Table 3 summarizes the critical quality attributes (CQAs) of polyherbal tablet formulation along with justification for criticality of these selected quality attributes. Disintegration time (min) (Y1) and friability (%) (Y2) were considered as CQAs of polyherbal tablet formulation (Table 3).
Based on prior scientific knowledge and data an Initial Risk Assessment of Drug Substance (Herbal Extracts) and formulation variables (Excipients) was carried out to meet the quality target product profile (QTPP). All the four plant extracts were subjected to initial risk assessment. Amongst them Amla extract was found to be critical input material. The initial risk assessment for this material input is summarized in (Table 4) summarizes Initial risk assessment for formulation variables and its justification is summarized in (Table 5).
| Drug Product CQA | Amla Extract | Excipients | |||||||
|---|---|---|---|---|---|---|---|---|---|
| Moisture Content | Hygroscopicity | Flow properties | Impurity | Residual solvent | Starch level | CCS level | Lactose level | Talc level | |
| Disintegration | Low | High | Low | Low | Low | High | High | Low | Low |
| Friability | Low | Low | Low | Low | Low | High | Medium | low | low |
CMA is Critical Material Attributes, green color indicates broadly acceptable risk which does not require further investigation, yellow indicates acceptable risk which require further investigation to reduce the risk, red indicates unacceptable risk which require further investigation to reduce the risk
Table 4: Initial Risk Assessment for CMA
| Formulation Variables | Drug Product CQA | Justification |
|---|---|---|
| Starch level | Disintegration | Starch is used as binder, increase or decrease starch level can have high impact on disintegration time via tablet hardness. Risk is high |
| Friability | Since starch is used as binder, increase or decrease in starch level can have impact on friability. Risk is high | |
| CCS Level | Disintegration | Since CCS is used as disintegrant increase or decrease in CCS level can have high impact on disintegration time. Risk is High |
| Friability | Higher level of CCS can increase friability of tablet, but this can be overcome by increasing tablet hardness during compression. Risk is Medium. | |
| Lactose level | Disintegration | Since lactose is used as filler, it usually has no impact on disintegration as well as friability. |
| Friability | ||
| Talc level | Disintegration | Talc has less impact on disintegration. The low level of talc used in the formulation is not expected to impact disintegration. The risk is low. |
| Friability | Talc has no impact on tablet friability. Risk is Low | |
| Magnesium stearate level | Disintegration | Since Magnesium stearate is used in very low concentration, it has no impact on disintegration time and friability. |
| Friability |
Formulation variables represents the level of each excipient used, CQA represents the selected quality criteria’s
Table 5: Justification for the Initial Risk Assessment of the Formulation Variables
From the initial risk assessment study, the formulation attributes which had high impact on the CQA were studied in detail and further subjected to design of experiments. The critical materials of the drug substance (Amla extract) were further subjected to control strategy.
The two major formulation parameters whose variations considered being the most hazardous for the quality profile of the final product were included in DoE. These parameters were ranked as high risk according to their Risk Priority Number (RPN) values. Concentration of starch (mg) (X1) and concentration of croscarmellose sodium (mg) (X2) were considered as the major formulation parameters for design of experimentation. A randomized 32 central composite design was employed for development and optimization of polyherbal tablets. The experimental runs, with independent variables and measured responses for the developed polyherbal formulation are shown in (Table 6).
| Std | Run | Factor 1 | Factor 2 | Response 1 | Response 2 |
|---|---|---|---|---|---|
| A:conc. of starch | B:conc. of CCS | Disintegration time | Friability | ||
| mg | mg | Min. sec | % | ||
| 1 | 1 | 30 | 20 | 17.5 | 0.61 |
| 5 | 2 | 30 | 25 | 14.28 | 0.62 |
| 6 | 3 | 40 | 25 | 20.17 | 0.53 |
| 2 | 4 | 40 | 20 | 19.26 | 0.49 |
| 3 | 5 | 30 | 30 | 13.47 | 0.65 |
| 7 | 6 | 35 | 20 | 18.35 | 0.57 |
| 8 | 7 | 35 | 30 | 15.02 | 0.63 |
| 4 | 8 | 40 | 30 | 18.52 | 0.67 |
| 9 | 9 | 35 | 25 | 16.37 | 0.57 |
Factors represents the independent variables, responses represents the dependent variables
Table 6: Composition of Herbal Antioxidant Tablet - Variables and Responses as per Design Expert
The micromeritics properties of the granules from each formulation batch are summarized in (Table 7). The granules from each formulation batch (F1 to F9) showed the angle of repose between 27.05°- 31.88°. The loose bulk density and tapped density of all the formulation batches varied from 0.523-0.571 g/cm3 and 0.607-0.661 g/cm3 respectively. Compressibility index was found to be in the range of 13.17-16.49. Hausner’s ratio was found to be within 1.151-1.188. The Overall the flow properties of the granules were within the acceptable limits.
| Formulation Batch | Angle of Repose (ɵ) |
Loose Bulk Density (g/cm3) |
Tapped Bulk Density (g/cm3) |
Compressibility Index |
Hausner’s Ratio |
|---|---|---|---|---|---|
| F1 | 28.61±0.25 | 0.546±0.02 | 0.641±0.02 | 14.81±0.12 | 1.174±0.001 |
| F2 | 27.51±0.27 | 0.545±0.02 | 0.632±0.03 | 13.76±0.26 | 1.159±0.004 |
| F3 | 31.48±0.19 | 0.523±0.01 | 0.621±0.01 | 16.33±0.32 | 1.185±0.008 |
| F4 | 28.43±0.28 | 0.571±0.02 | 0.627±0.03 | 15.00±0.27 | 1.176±0.003 |
| F5 | 27.05±0.21 | 0.527±0.01 | 0.607±0.01 | 13.17±0.19 | 1.151±0.002 |
| F6 | 31.60±0.25 | 0.558±0.02 | 0.651±0.02 | 14.28±0.45 | 1.166±0.014 |
| F7 | 31.88±0.13 | 0.532±0.01 | 0.638±0.01 | 16.49±0.26 | 1.197±0.003 |
| F8 | 29.60±0.25 | 0.556±0.02 | 0.661±0.03 | 15.88±0.58 | 1.188±0.011 |
| F9 | 29.17±0.50 | 0.526±0.01 | 0.624±0.02 | 15.70±0.29 | 1.186±0.005 |
Data are expressed as mean±SD (n=3), Mean ±SD represents Standard deviation for n=3 observations
Table 7: Micromeritics Study Result for Granules
The formulation batches F1-F9 were subjected for physical characterization; all physical parameters were found to be satisfactory. Various physical parameters of prepared tablets are given in (Table 8). The hardness of the tablets was found to be within 3.3- 3.7 kg/cm2. The average weight of the tablets prepared was in the range of 600±2.5 to 605±2.6 mg. The friability of the tables was found to be 0.49- 0.67 % and disintegration time was within the range of 13.47 min to 20.17 min. The moisture content in terms of percentage loss on drying was found to be between the range of 2.33 % to 3.77 %.
| Formulation Batch | Thickness (mm) |
Hardness (kg/cm2) |
Friability (%) | Weight variation (%) |
Disintegration time (min. sec) |
Moisture Content (%) |
|---|---|---|---|---|---|---|
| F1 | 6.0±0.08 | 3.3±0.08 | 0.61±0.02 | 601±2.3 | 17.50±0.04 | 2.57±0.20 |
| F2 | 6.1±0.03 | 3.4±0.03 | 0.62±0.02 | 603±1.8 | 14.28±0.04 | 2.48±0.28 |
| F3 | 6.0±0.08 | 3.6±0.05 | 0.53±0.01 | 600±2.5 | 20.17±0.07 | 3.56±0.19 |
| F4 | 6.2±0.05 | 3.7±0.06 | 0.49±0.01 | 601±3.7 | 19.26±0.04 | 3.77±0.20 |
| F5 | 6.2±0.1 | 3.5±0.08 | 0.65±0.03 | 605±2.6 | 13.47±0.03 | 2.33±0.30 |
| F6 | 6.2±0.05 | 3.4±0.08 | 0.57±0.03 | 603±1.5 | 18.35±0.06 | 3.04±0.11 |
| F7 | 6.0±0.08 | 3.5±0.03 | 0.63±0.02 | 602±2.8 | 15.02±0.14 | 3.06±0.13 |
| F8 | 6.2±0.03 | 3.3±0.08 | 0.67±0.02 | 603±2.8 | 18.52±0.02 | 3.76±0.29 |
| F9 | 6.1±0.03 | 3.5±0.06 | 0.57±0.03 | 604±1.4 | 16.37±0.04 | 3.07±0.12 |
Data are expressed as mean±SD
Thickness is expressed in millimetre, hardness in kilogram per centimetre square, friability and weight variation in percentage and
disintegration time in minutes. Mean ±SD represents Standard deviation for n=3 observations
Table 8: Physical Characterization of Herbal Antioxidant Tablet Batches
Statistical optimization of Herbal antioxidant tablet was performed by comparison of several statistical parameters, provided by Design-Expert® Software, Version 11. The statistical data of the applied design is summarized in (Table 9). The independent variables and response were related using polynomial equations with statistical analysis through Design-Expert® Software. Table 12 shows the regression results of the measured responses. The values of the coefficients X1, X2, their interaction and quadratic-terms are related to the effect of these variables on the response. A positive sign of coefficient indicates a synergistic effect while a negative term indicates an antagonistic effect upon the response. The larger coefficient means that the independent variable has a more potent influence on the response [18]. To demonstrate graphically the influence of each factor on responses, the response surface plots and Contour plots were generated (fig. 1-4).
| Response | SS | MS | DF | F-value | P-value | R2 | Adjusted R2 | Model Significance |
|---|---|---|---|---|---|---|---|---|
| Y1 | 37.82 | 18.91 | 2 | 19.23 | 0.0025 | 0.8651 | 0.8201 | Significant |
| Y2 | 0.0240 | 0.0080 | 3 | 12.43 | 0.0094 | 0.8817 | 0.8108 | Significant |
SS-sum of squares, MS-mean of squares, DF-degree of freedom, F value-fischer’s ratio, P value- probability, R2- coefficient of regression.
Table 9: Summary of Statistical Parameters – Analysis of Variance Test (ANOVA)

Figure 1: Contour plot for Response Y1 Disintegration Time

Figure 2: Response Surface Plot for Response Y1 Disintegration Time

Figure 3: Contour Plot for Response Y2 Friability

Figure 4: Response Surface Plot for Response Y2 Friability
Response Y1 Disintegration Time: Based on the regression co efficient found from the ANOVA study as shown in Table 10 it was found that, independent variable X1 is showing positive sign indicating its synergistic effect upon the response Y1. The coefficient of X2 variable shows a negative sign which is indicating its antagonistic effect on the response. From the regression equation it was suggested that variable X1 was more significant for the response as compared to variable X2, because negative coefficient was found for variable X2 by ANOVA.
| Response | Regression equation |
|---|---|
| Disintegration Time (Y1) | 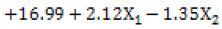 |
| Friability (Y2) | |
X1 is concentration of Starch, X2 is concentration of Croscarmellose Sodium, Y1 is Disintegration Time, Y2 is Friability
Table 10: Regression Equation (Polynomial Equation)
From Graphical demonstration i.e., from the Response Surface Plot and Contour Plot it is observed that by increasing the level of variable X1, the value of response Y1 increases; whereas by increasing the level of variable X2 the value of response Y1 decreases. In other words, as the concentration of starch increases the disintegration time increases and as the concentration of croscarmellose sodium increases the disintegration time decreases. From fig. No. 1&2 it is found that variable X1 has more significant effect for response Y1 as compared to variable X2.
Response Y2 Friability: For Response Y2, Based on the regression coefficient found from the ANOVA study as shown in Table 10 it was found that, independent variable X1 is showing negative sign indicating its antagonistic effect on the response, whereas variable X2 is found to have synergistic effect on the response, due to its positive coefficient. It is also observed that a synergistic effect can be observed when both the variables X1 and X2 are used in combination.
From graphical demonstration i.e., from the Response Surface Plot and Contour Plot it is observed that as the level of variable X1 increases the value of response Y2 decreases i.e., as the concentration of starch increases the % Friability decreases (fig. 3 and fig. 4).
The friability is not affected much by the concentration of croscarmellose sodium. Hence it can be concluded that variable X1 has significant impact on response Y2.
The design space for polyherbal tablet formulation was established. Based on the requirement of product quality, the criteria considered for establishment of design space were disintegration time not more than 15 min and % Friability not more than 1 %. These criteria lead to the design space from multidimensional combination of excipients which further lead to the selection of acceptable operating ranges for formulating Herbal antioxidant tablets with respect to target product profile. Design space (Overlay plot) shown in fig. 5 had shaded region with yellow colour which indicates the region of successful operating ranges.

Figure 5: Overlay plot showing design space
Indicating formulation F2 (Starch-30mg and CCS-25mg) and
F5 (Starch-30mg and CCS-30mg) falling in design space.
From the Design Space; formulation batch F2 and F5 falls under the region of successful operating ranges. Hence formulation F2 (Starch-30mg and CCS-25mg) and F5 (Starch-30mg and CCS-30mg) fulfils the criteria of QTPP and CQA for Herbal antioxidant tablet supplement. Therefore F2 and F5 were selected as optimized formulation.
Two optimized formulations (F2 & F5) of Herbal antioxidant tablets with the predicted levels of independent variables were prepared to confirm the validity of the optimization procedure. The predicted and experimental values of the two optimized formulations are given in Table 11. The predicted and experimental values of CQAs of the optimized formulation are nearly similar. A good concordance is obtained between the model prediction and experimental observation. This indicates statistical equivalence between experimental and predicted values. This also demonstrates the validity of the selected formulation variables, their levels and applied 32 Central Composite Design to conduct design of experimentation.
| Responses | OF2 | OF5 | ||
|---|---|---|---|---|
| Predicted | Experimental | Predicted | Experimental | |
| Disintegration Time (Min) | 14.87 | 15.01 | 13.52 | 13.27 |
| Friability (%) | 0.62 | 0.63 | 0.63 | 0.64 |
OF2 represents Optimized Formulation 2, Optimized Formulation 5
Table 11: Comparison of Predicted and Experimental Values for of2 and of5
Among the two Optimized formulations the formulation with minimum disintegration time (OF5) was selected for further studies such as Accelerated Stability study and In-vitro Antioxidant Activity.
A control strategy has been designed to ensure that a product of required quality will be produced consistently. The variables ranked as high risk in the initial risk assessment and needed to be controlled in their acceptable ranges were included in the control strategy. The Critical Material Attributes of drug substance i.e., plant extracts and steps taken to minimize the risk related to these CMA are included in the Control Strategy of Polyherbal tablet formulation.
The Hygroscopic nature of Amla Extract was identified as drug substance critical material attributes (CMA’s). In order to consistently produce tablets of required quality the granulation technique was altered to overcome the problems related the above input materials.
Stability study on the optimised batch (OF5) was carried out as per ICH stability guidelines and the results are depicted in Table 12. The formulation batch OF5 showed no significant change in the physical parameters. There was a marginal change in hardness, friability and disintegration time. But these changes were within the specified limits. The studies indicated that, the optimized formulation is stable for 45 d.
| Evaluation Parameters | Optimized formulation F5 | ||||||
|---|---|---|---|---|---|---|---|
| Initial | 15 days | 30 days | 45 days | ||||
| RT/ 65 %RH | 40°/ 75 %RH |
RT/ 65 %RH | 40°/ 75 %RH |
RT/ 65 %RH | 40°/ 75 %RH |
||
| Hardness (kg/cm2) | 3.5 | 3.5 | 3.5 | 3.5 | 3.5 | 3.4 | 3.4 |
| Friability (%) |
0.65 | 0.65 | 0.65 | 0.65 | 0.67 | 0.67 | 0.67 |
| Disintegration (min) |
13.47 | 13.46 | 13.46 | 13.46 | 13.44 | 13.46 | 13.44 |
RT is Room temperature, RH is Relative Humidity
Table 12: Stability Study Data of the Optimized Formulation of5
The total antioxidant capacity of optimized formulation batch (OF5) was evaluated by DPPH radical scavenging test. The IC50 value for polyherbal tablet formulation was found to be 39.84 and that for Ascorbic acid (standard) was found to be 38.79 μg as shown in Table 13. The results obtained demonstrated that Polyherbal tablet formulation has good antioxidant activity (fig. 6).
| Conc (µg/ml) | % Inhibition sample (Polyherbal tablets) |
% Inhibition Standard (Ascorbic acid) |
IC50 µg/ml (Sample) |
IC50 µg/ml (Standard) |
|---|---|---|---|---|
| 20 | 35.59 | 35.45 | 39.84 | 38.79 |
| 40 | 44.10 | 51.13 | ||
| 60 | 61.40 | 57.83 | ||
| 80 | 68.10 | 65.94 | ||
| 100 | 77.40 | 73.08 |
The concentration of extract is taken in Microgram per millilitre, IC50 stands for half maximal Inhibitory concentration.
Table 13: Quantitative Antioxidant Activity

Figure 6: Comparison of % Inhibition of Standard and Sample
obtained by DPPH method
Indicates % inhibition of free radical bye plotting concentration
of standard and sample on X-axis and % inhibition on Y-axis.
The present research work has demonstrated the successful implementation of QbD approach for the development of polyherbal tablet formulation. The desired QTPP and CQA’s were predefined in order to obtain the final product with desired quality. From the experiments, it can be concluded that if formulation parameters were operated within the proposed design space, high risk can be converted to low level of risk. Further it can also be concluded that formulation prepared within the design space will be able to accomplish CQAs in the drug product which further results into the product with desired QTPP.
References
- Kesarwani K, Gupta R. Bioavailability enhancers of herbal origin: An overview. Asian Pac J Trop Biomed 2013;3:253-66.
- Calixto JB. Efficacy, safety, quality control, marketing and regulatory guidelines for herbal medicines (phytotherapeutic agents). Braz J Med Biol Res 2000;33:179-89.
- Kamboj VP. Herbal medicine. Curr Sci 2000;78:35-9.
- Warude D, Patwardhan B. Botanical: quality and regulatory issues. J Sci Ind Res India 2005;64:83-92.
- ICH, Q8 (R2), Harmonised tripartite guideline, Pharmaceutical development. August 2009:9-24.
- Khan IA, Smillie T. Implementing a “Quality by Design” approach to assure the safety and integrity of botanical dietary supplements. J Nat Prod 2012;75:1665-73.
- Orlandini S, Pinzauti S, Furlanetto S. Application of quality by design to the development of analytical separation methods. Anal Bioanal Chem 2013;405:443-50.
- Zhang L, Yan B, Gong X, Lawrence XY, Qu H. Application of quality by design to the process development of botanical drug products: a case study. AAPS Pharmscitech 2013;14:277-86.
- Panchawat S, Rathore KS, Sisodia SS. A review on herbal antioxidants. Intern J Pharm Tech Res 2010;2:232-9.
- Badhani B, Sharma N, Kakkar R. Gallic acid: a versatile antioxidant with promising therapeutic and industrial applications. RSC Adv 2015;5:27540-57.
- US Food and Drug Administration. Quality by design for ANDAs: an example for immediate-release dosage forms. HHS 2012.
- Indian Pharmacopoiea, Controller of Publication, Govt. of India, Ministry of Health and Family Welfare, New Delhi 2007;1:177-83.
- World Health Organization. Quality control methods for medicinal plant materials, Geneva 1998.
- Narendar D, Arjun N, Someshwar K, Rao YM. Quality by design approach for development and optimization of Quetiapine Fumarate effervescent floating matrix tablets for improved oral bioavailability. J Pharm Investig 2016;46:253-63.
- Madgulkar AR, Bhalekar MR, Kolhe VJ, Kenjale YD. Formulation and optimization of sustained release tablets of venlafaxine resinates using response surface methodology. Indian J Pharm Sci 2009;71:387.
- ICH Q1A (R2), Stability testing of new drug substances and products. International conference on harmonisation 2003.
- Koleva II, Van Beek TA, Linssen JP, Groot AD, Evstatieva LN. Screening of plant extracts for antioxidant activity: a comparative study on three testing methods. Phytochem Anal: An International Journal of Plant Chemical and Biochemical Techniques 2002;13:8-17.
- El-Nabarawi MA, El-Miligi MF, Khalil IA, El-Nabarawy NA. Applying QBD approach to develop ODTs containing aceclofenac solid dispersion with ranitidine HCl using direct compression technique, then pharmaceutically evaluating and pharmacologically confirming the therapeutic actions. Int J Pharm Pharm Sci 2013;5:577-93.


