- *Corresponding Author:
- Y. S. Li
Department of Intensive Care Medicine,
Tongji Hospital,
Tongji Medical College,
Huazhong University of Science and Technology,
Hankou,
Wuhan 430030,
China
E-mail: zzyxyongshengli@163.com
| This article was originally published in a special issue, “Trending Topics in Biomedical Research and Pharmaceutical Sciences” |
| Indian J Pharm Sci 2022:84(1) Spl Issue “156-167” |
This is an open access article distributed under the terms of the Creative Commons Attribution-NonCommercial-ShareAlike 3.0 License, which allows others to remix, tweak, and build upon the work non-commercially, as long as the author is credited and the new creations are licensed under the identical terms
Abstract
Necroptosis is a form of cell death, this study aimed to explore and verify the relationship between clear cell renal cell carcinoma and necroptosis, and to construct a necroptosis-related prognostic signature for diagnosis and treatment of clear cell renal cell carcinoma. 159 necroptosis-related genes were screened from the Kyoto encyclopedia of genes and genomes database of which 51 were differentially expressed in clear cell renal cell carcinoma, which included 16 prognosis-associated genes. Enrichment analysis showed that most of the 16 genes were related to necroptosis, autophagy and the Wingless-related integration site signaling pathway. From the 16 genes, 11 independent necroptosis-related genes associated with clear cell renal cell carcinoma prognosis were screened by least absolute shrinkage and selection operator regression and multivariate Cox regression. These genes (BH3 interacting domain death agonist, Janus kinase 3, RANBP2-type and C3HC4- type zinc finger containing 1, solute carrier family 25 member 4, interferon gamma receptor 2, phospholipase A2 group IVD, toll-like receptor 3, H2A clustered histone 7, interferon regulatory factor 9, phospholipase A2 group IVB and H2A clustered histone 17) were used to construct a prognostic signature which was assessed by multivariate Cox regression analysis. Also, the relationship between the risk score and the stage and grade was determined. Receiver operating characteristic analysis and the decision curve analysis demonstrated the validity and clinical value of the prediction model which was internally validated. In this study, we explored the potential link between clear cell renal cell carcinoma and necroptosis to establish and validate an 11 gene prognostic signature that can effectively predict clear cell renal cell carcinoma prognosis.
Keywords
Joint representation learning, necroptosis, clear cell renal cell carcinoma, multivariate Cox regression, nomogram
Renal Cell Carcinoma (RCC) is a common malignancy of the urinary system that accounts for 2 %-3 % of adult tumors[1]. The most common histological type of RCC is clear cell Renal Cell Carcinoma (ccRCC)[2] and the 5 y survival rate of non-metastatic RCC is 55 %, whilst the 5 y survival rate of patients with metastatic RCC is 10 %[3]. So, there is an urgent need for the development of improved methods for the screening and early diagnosis of RCC.
Classically, surgery has been adopted as the main treatment for ccRCC treatment. However, progress in the development of targeted therapies has enabled better treatments for ccRCC including new chemotherapy drugs targeting Hypoxia-Inducible Factor 2 (HIF-2) and autophagy genes[4]. Further complexity exists as existing therapeutic targets are prone to drug resistance and novel drug targets and biomarkers are needed to improve the prognosis for patients with ccRCC. As a result, there is currently major interest in identifying the molecular pathways involved in ccRCC of which necroptosis has been reported[5]. A better understanding of the role of necroptosis in the pathogenesis of ccRCC and establishing a prognostic signature is of great significance towards improving the early diagnosis and development of new treatments for ccRCC.
Apoptosis is a common mechanism of cell death. Traditional chemotherapy drugs inhibit tumor growth by inducing apoptosis in tumor cells[6], however, tumor cells can develop drug resistance through modulation of the apoptotic mechanisms. Degterev et al.[7] reported a unique cell death mechanism in vertebrates termed necroptosis. Classical apoptosis depends on the activation of caspases. Caspases inhibition sequesters the apoptotic pathway and is one of the mechanisms of drug resistance in tumors[8]. In contrast, necroptosis is a caspase-independent process and is a higher likely to inflammatory response compared to apoptosis[9]. The phosphorylation signaling pathway mediated by Receptor-Interacting Serine/Threonine-Protein Kinase 1 (RIPK1)/Receptor-Interacting Serine/Threonine- Protein Kinase 3 (RIPK3) (RIPK1/RIPK3) activates the Mixed Lineage Kinase Domain like Pseudokinase/ Phosphorylated Mixed Lineage Kinase Domain like Pseudokinase (MLKL/pMLKL) resulting in cell size enlargement, organelle swelling, cell collapse after membrane perforation and the release of cellular contents. Consequently, the immune response is triggered and necrotic cells are eliminated by macropinocytosis corpuscles. When the classical apoptotic pathway is inhibited due to caspase inactivation, necroptosis is activated and so it is believed that tumor cells that are resistant to apoptosis may be sensitive to cell death via activation of the necroptosis pathway[9]. These findings suggest that necroptosis and its regulatory mechanisms may be a potential target for cancer therapy.
Previously studies have developed prognosis-related models for ccRCC[10]. However, there few studies have reported the relationship between necroptosis and ccRCC and to date no prognostic models have been developed in this area. In this study, we investigated the relationship between ccRCC and necroptosis using The Cancer Genome Atlas (TCGA) database. We established a necroptosis-related gene prognostic signature and examined its clinical value to demonstrate its potential use in supporting the diagnosis and treatment of ccRCC.
Materials and Methods
Data collection and processing:
From the Kidney Renal Clear Cell Carcinoma (KIRC) queue of TCGA/National Cancer Institute Genomic Data Commons (GDC) (https://portal.gdc.cancer.gov/) [11], we downloaded ccRCC Fragments Per Kilobase Million (FPKM) standardized Ribonucleic Acid (RNA)- seq data and the remaining clinical data after excluding patients lost at follow-up. Necroptosis-Related Genes (NRGs) were retrieved from Kyoto Encyclopedia of Genes and Genomes (KEGG) (https://www.kegg.jp/) database[12].
Differential expression analysis:
Based on gene expression in ccRCC tissues, we performed differential expression analysis using the “DESeq2” package. With log2|fc|>1 and p-value adjusted (Padj)<0.01 as the standards, we determined the Differentially Expressed Genes (DEGs) in the tumor tissues and constructed volcano plots. The Differentially Expressed Necroptosis Genes (DENGs) were sorted and plotted using Venn diagrams. Univariate Cox regression was used to screen out prognosisrelated genes that intersected with the DENGs. A Venn diagram was plotted again to obtain the DENGs related to prognosis. The data were visualized by constructing heat maps and box plots of differential expression. This process used the “grammar of graphics plot 2 (ggplot2) [13]”, “Cairo” and “ggrepel” packages in the R software.
Gene Ontology (GO) functional enrichment and KEGG pathway enrichment:
GO functional enrichment and KEGG pathway enrichment analyses were performed using the GO (http://geneontology.org) and KEGG (http://www. genome.jp/keg/) databases. The selected NGRs were enriched and combined with the log Fold Change (logFC) values. The results of the GO and KEGG enrichment analyzed were in different graphical formats. In this process, the ggplot2, GOplot[14], clusterProfiler[15] and the org.Hs.eg.db packages were used.
Gene Set Enrichment Analysis (GSEA):
The logFC values of the selected DEGs were used as a molecular ranking to evaluate if the genes were significantly enriched in the gene set in the Molecular Signatures Database (MSigDB) (https://www.gseamsigdb. org/gsea/msigdb/index.jsp). These data were used to assess the phenotypic correlation of these genes.
Establishment of a Necroptosis Risk Scoring Signature (NRSS):
After identifying the DENGs, Least Absolute Shrinkage and Selection Operator (LASSO) regression analysis was used to eliminate collinearity between the independent variables to further screen DENGs and draw the LASSO variable trajectory diagram[16]. The independent prognostic genes were then screened by multivariate Cox regression and the regression coefficient beta (β) value was calculated to construct NRSS.
Risk scoring was performed for ccRCC patients according to scoring criteria. The patients were then divided into high and low-risk groups with the median of the risk score used as the threshold. These data were used to construct a risk factor graph. The Kaplan- Meier method was used to plot survival curves for the high and low-risk groups and the screened genes were divided into high and low expression groups. The risk scores and other clinical information including age, gender and stage were incorporated into observational indicators for univariate and multivariate Cox analysis. The independent prognostic factors of ccRCC were determined and the forest plot was plotted based on the results. Finally, the relationships between each clinical parameter and the risk score were analyzed using the “glmnet” and “survival” packages respectively in R.
Validation of the NRSS:
Receiver Operating Characteristic (ROC) curves was used to evaluate the predictive accuracy of the model. Decision Curve Analysis (DCA)[17] was used to evaluate the clinical utility of NRSS. The nomogram and the risk score Cox models were constructed to enable 1 y, 3 y and 5 y DCA analyses. A calibration graph was drawn to determine the probability of ccRCC patients and the probability of model prediction. These data were used to determine the evaluation effect of NRSS on the actual prediction results.
Next, the ccRCC patients were divided into a training set (n=269) and a validation set (n=270) using the random number method. The risk score for each patient was calculated based on the NRSS. Based on the median risk score, patients in the training and validation sets were divided into high and low-risk groups for validation. These procedures were performed using the “survival”, “stdca” and “pROC” packages in R.
Results and Discussion
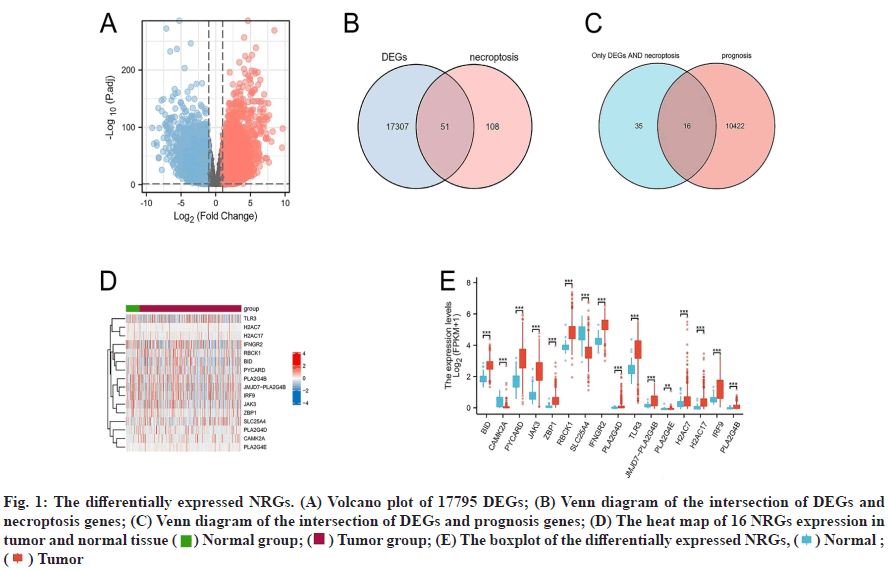
Differential expression analysis results were discussed below. The gene expression profiles of 539 tumor samples and 72 tumor-adjacent tissue specimens of ccRCC were analyzed and the clinical and survival data of the patients after downloaded from TCGA/ GDC. 159 NRGs were retrieved from KEGG. Genes with log2|fc|>1 and Padj<0.01 were used as standards and 17795 DEGs were screened out and shown in a volcano plot (fig. 1A). 51 DENGs (fig. 1B) were found amongst the DEGs. Univariate Cox analysis showed that 16 DENGs correlated with prognosis (fig. 1C) of which 2 genes were down-regulated (Calcium/ Calmodulin Dependent Protein Kinase II Alpha (CAMK2A) and Solute Carrier Family 25 Member 4 (SLC25A4)) and 14 genes were up-regulated (BH3 Interacting Domain Death Agonist (BID), PYD and CARD Domain Containing (PYCARD), Janus Kinase 3 (JAK3), Z-DNA Binding Protein 1 (ZBP1), RANBP2- Type and C3HC4-Type Zinc Finger Containing 1 (RBCK1), Interferon Gamma Receptor 2 (IFNGR2), Phospholipase A2 Group IVD (PLA2G4D), JMJD7- PLA2G4B Readthrough (JMJD7-PLA2G4B), Toll- Like Receptor 3 (TLR3), Phospholipase A2 Group IVE (PLA2G4E), H2A Clustered Histone 7 (H2AC7), Interferon Regulatory Factor 9 (IRF9), Phospholipase A2 Group IVB (PLA2G4B) and H2A Clustered Histone 17 (H2AC17)). Heat maps were drawn based on the expression of these genes in 611 specimens (fig. 1D). Grouped boxplots were drawn to show the differences in expression differences of the 16 DENGs between the tumor and tumor-adjacent tissues (fig. 1E).
Fig. 1: The differentially expressed NRGs. (A) Volcano plot of 17795 DEGs; (B) Venn diagram of the intersection of DEGs and necroptosis genes; (C) Venn diagram of the intersection of DEGs and prognosis genes; (D) The heat map of 16 NRGs expression in tumor and normal tissue ( ) Normal group; (
 ) Tumor group; (E) The boxplot of the differentially expressed NRGs, (
 ) Normal ; (
 ) Tumor
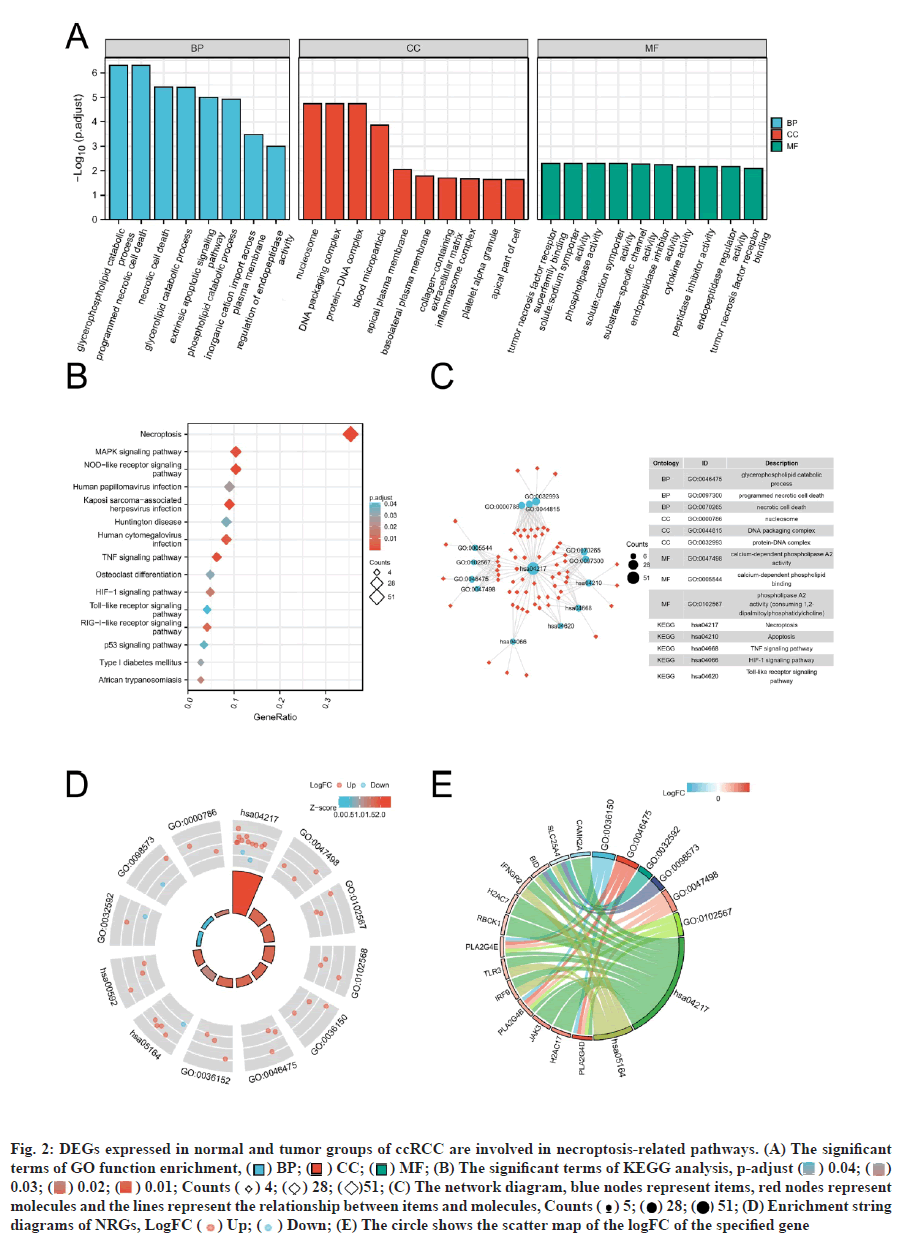
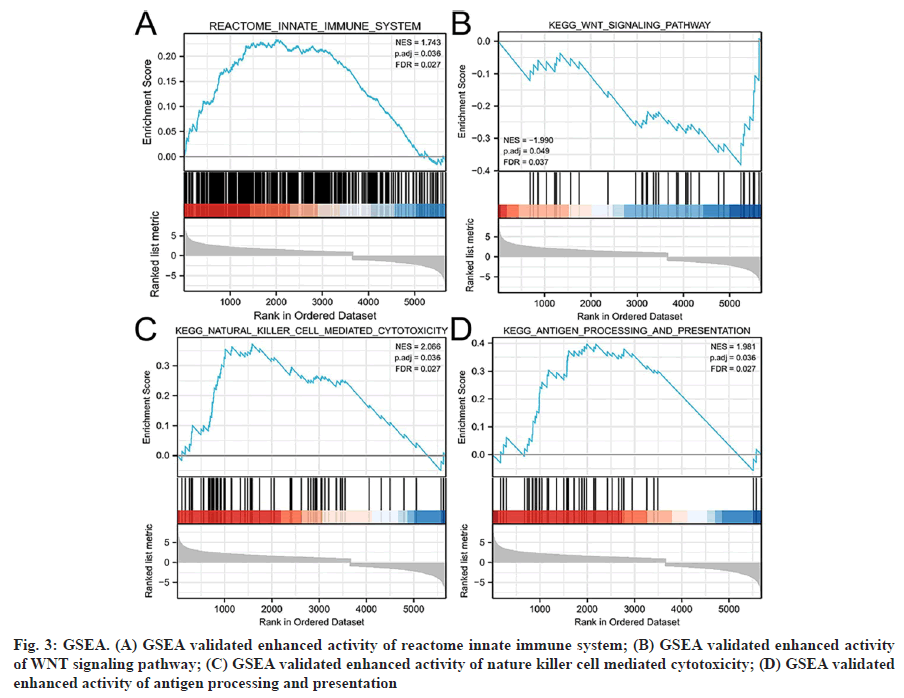
Functional enrichment analysis was performed on the DEGs to provide a further biological understanding of the genes. The results from the enrichment analyses were combined with the Z-score to evaluate the role of NRGs in these pathways. The GO term functional enrichment and the KEGG pathway enrichment analyses of these genes are summarized in (fig. 2). The top enriched terms in the biological processes were glycerophospholipid catabolic processes, necrotic cell death, necroptosis and the TLR signaling pathway. Also, we collected logFC values of the DEGs for GSEA and found that these genes were significantly enriched in the innate immune system, Wingless-Related Integration Site (WNT) signaling pathway, natural killer cell-mediated cytotoxicity and antigen processing and presentation (fig. 3). These findings suggested that the occurrence of ccRCC was associated with the expression of genes that regulate cell death processes such as necroptosis.
Fig. 2: DEGs expressed in normal and tumor groups of ccRCC are involved in necroptosis-related pathways. (A) The significant terms of GO function enrichment, ( ) BP; (
 ) CC; (
 ) MF; (B) The significant terms of KEGG analysis, p-adjust (
 ) 0.04; (
 ) 0.03; (
 ) 0.02; (
 ) 0.01; Counts (
 ) 4; (
 ) 28; (
 )51; (C) The network diagram, blue nodes represent items, red nodes represent molecules and the lines represent the relationship between items and molecules, Counts (
 ) 5; (
 ) 28; (
 ) 51; (D) Enrichment string diagrams of NRGs, LogFC (
 ) Up; (
 ) Down; (E) The circle shows the scatter map of the logFC of the specified gene
Fig. 3: GSEA. (A) GSEA validated enhanced activity of reactome innate immune system; (B) GSEA validated enhanced activity of WNT signaling pathway; (C) GSEA validated enhanced activity of nature killer cell mediated cytotoxicity; (D) GSEA validated enhanced activity of antigen processing and presentation
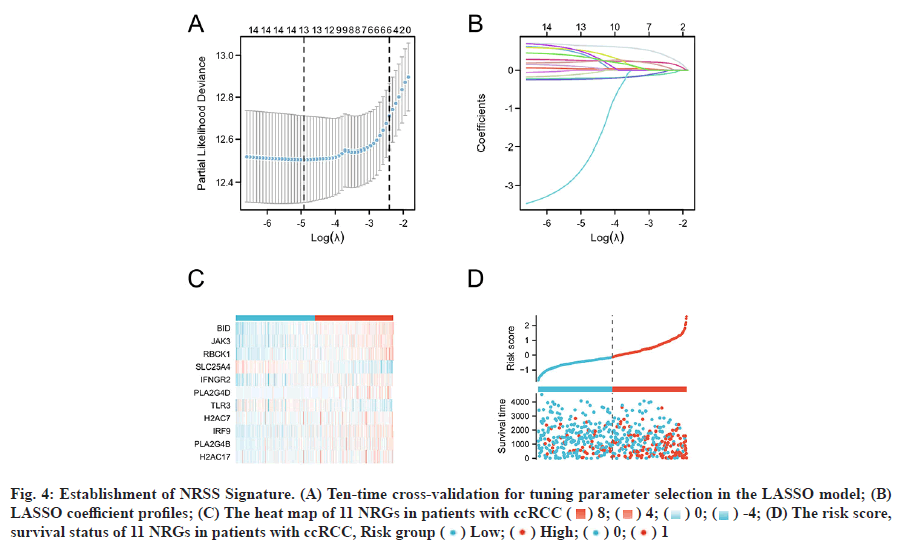
Based on the LASSO regression analysis of 16 DENGs and the results shown in fig. 4A and fig. 4B, the optimal penalty coefficient of the model was 13 and 13 NRGs were screened out (BID, CAMK2A, JAK3, RBCK1, SLC25A4, IFNGR2, PLA2G4D, TLR3, PLA2G4E, H2AC7, IRF9, PLA2G4B and H2AC17). Multivariate Cox regression analysis was performed on the 13 genes, 11 of which could be used as independent predictors (BID, JAK3, RBCK1, SLC25A4, IFNGR2, PLA2G4D, TLR3, H2AC7, IRF9, PLA2G4B and H2AC17. The intercept of the regression analysis was -2.435 and the regression coefficient β of the 11 genes were 0.679, 0.024, 0.232, -0.235, 0.118, 0.526, -0.266, -0.221, 0.314, 0.147, 0.483, respectively. According to the above formula and the β value of the multivariate Cox regression, the NRSS was finally determined as follows; NRSS=(0.679* expression level of BID)+(0.024* expression level of JAK3)+(0.232* expression level of RBCK1)- (0.235* expression level of SLC25A4)+(0.118* expression level of IFNGR2)+(0.526* expression level of PLA2G4D)-(0.266* expression level of TLR3)-(0.221*expression level of H2AC7)+(0.314* expression level of IRF9)+( 0.147* expression level of PLA2G4B)+(0.483* expression level of H2AC17)- 2.435.
Fig. 4: Establishment of NRSS Signature. (A) Ten-time cross-validation for tuning parameter selection in the LASSO model; (B) LASSO coefficient profiles; (C) The heat map of 11 NRGs in patients with ccRCC ( ) 8; (
 ) 4; (
 ) 0; (
 ) -4; (D) The risk score, survival status of 11 NRGs in patients with ccRCC, Risk group (
 ) Low; (
 ) High; (
 ) 0; (
 ) 1
) 1
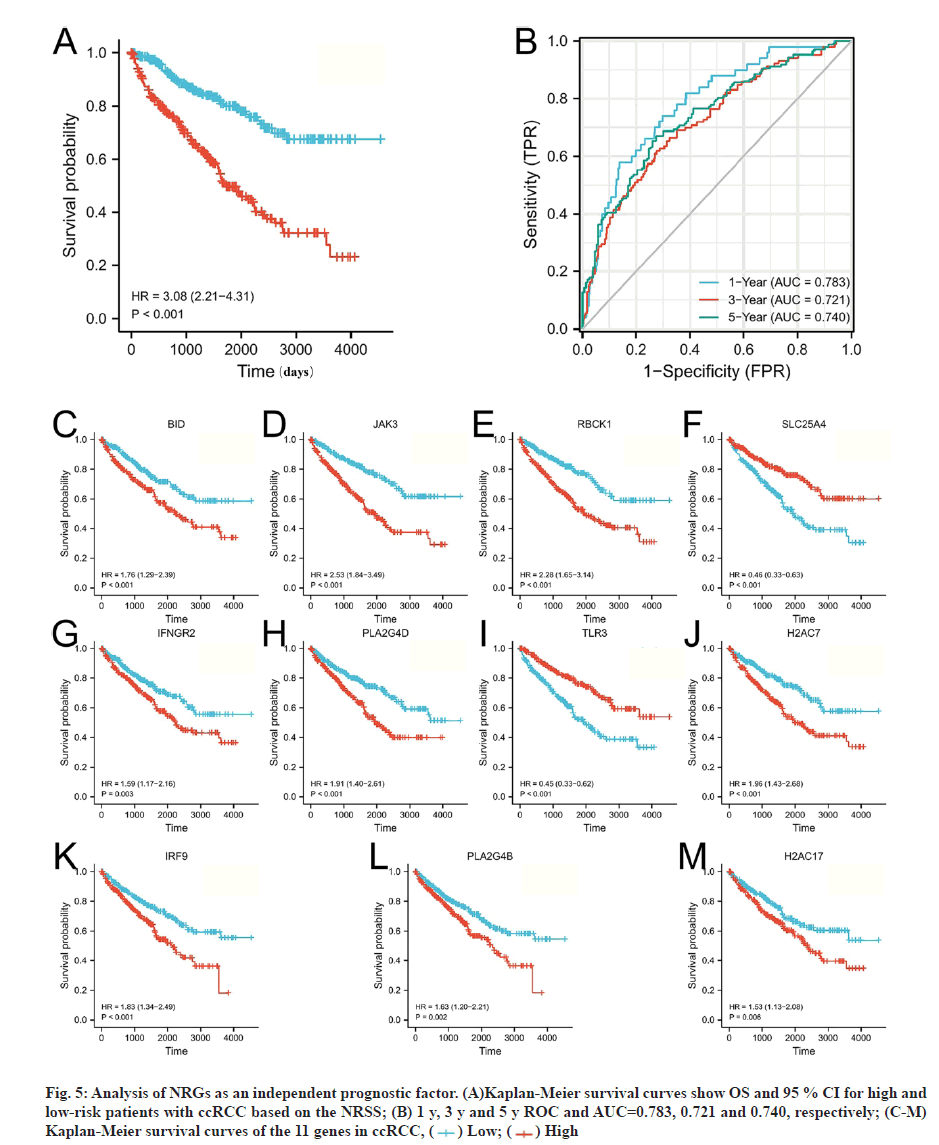
The risk scores for each patient were calculated and the patients were divided into high (n=270) and lowrisk groups (n=269) based on the median risk value as a cut-off point. Heat map, risk score and survival outcomes plots are present in fig. 4C and fig. 4D. It can be seen that the mortality rate was significantly higher with increasing risk score. To determine the ability of the NRSS to predict the prognosis of ccRCC patients, Kaplan-Meier analysis of Overall Survival (OS) was performed. The OS in the high-risk group was significantly lower than in the low-risk group (Hazard Ratio (HR)=3.08, 95 % Confidence Interval (CI)=2.21- 4.31, p<0.001, fig. 5A). ROC curve analysis was used to evaluate the accuracy of the NRSS. As shown in fig. 5B, the Area Under the Curve (AUC) values for survival at 1 y, 3 y and 5 y were 0.783, 0.721 and 0.740, respectively. These data indicated the robustness and high accuracy of the model in predicting patient prognosis. The median expression values were used as cut-off points to evaluate the impact of 11 prognostic genes on the OS of patients (fig. 5C-fig. 5M).
Fig. 5: Analysis of NRGs as an independent prognostic factor. (A)Kaplan-Meier survival curves show OS and 95 % CI for high and low-risk patients with ccRCC based on the NRSS; (B) 1 y, 3 y and 5 y ROC and AUC=0.783, 0.721 and 0.740, respectively; (C-M) Kaplan-Meier survival curves of the 11 genes in ccRCC, ( ) Low; (
 ) High
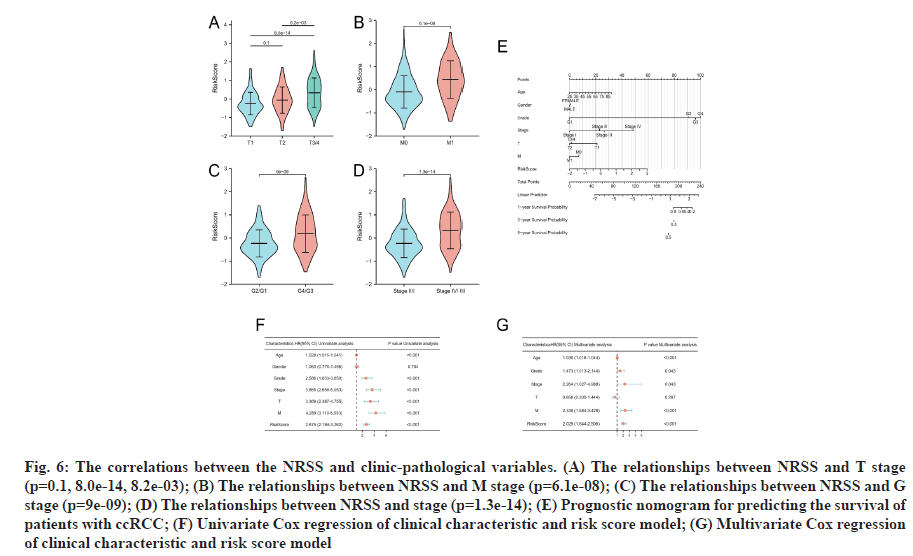
To determine if the NRSS affects the progression of ccRCC, we analyzed the correlations between the NRSS and clinic-pathological variables. The risk score of G3/4 disease was higher than that for G1/2 cancers (p=9e-09, fig. 6A). The risk score for M1 disease was higher than M0 stage disease (p=6.1e-06, fig. 6B). The risk score for T3/4 disease was higher than T2 and T1 stage disease (p=8.2e-03, 8.0E-14, fig. 6C) and also the risk score for stage ?/? disease was higher than that of stage I/?I disease (p=1.3e-14, fig. 6D).
Fig. 6: The correlations between the NRSS and clinic-pathological variables. (A) The relationships between NRSS and T stage (p=0.1, 8.0e-14, 8.2e-03); (B) The relationships between NRSS and M stage (p=6.1e-08); (C) The relationships between NRSS and G stage (p=9e-09); (D) The relationships between NRSS and stage (p=1.3e-14); (E) Prognostic nomogram for predicting the survival of patients with ccRCC; (F) Univariate Cox regression of clinical characteristic and risk score model; (G) Multivariate Cox regression of clinical characteristic and risk score model
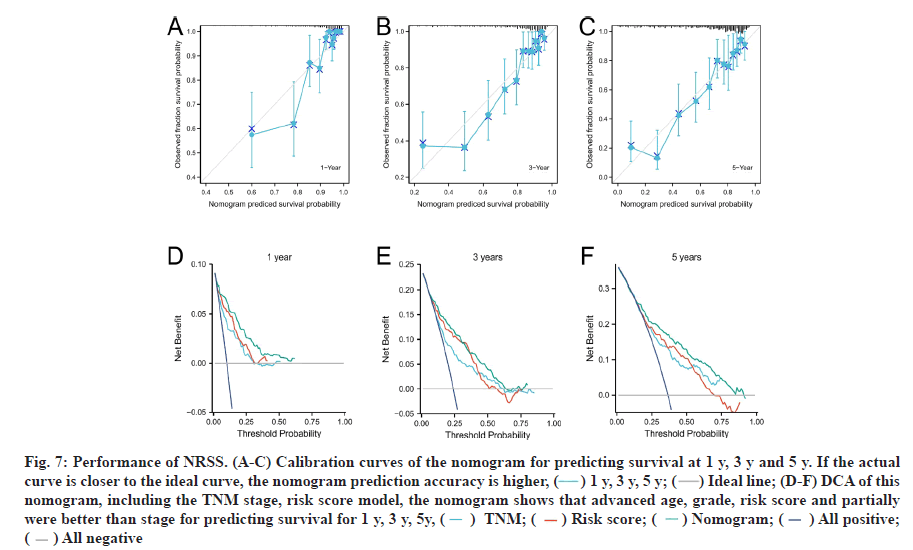
Univariate and multivariate Cox regression analyses were performed. To accurately assess patient prognosis, we established a nomograph (fig. 6E) that consisted of a variety of clinical and pathological features. Multivariate Cox regression analysis showed that age, grade, stage, M-stage and risk factors were independent predictors (fig. 6F). Univariate Cox regression analysis showed that age, grade, stage, T stage, M stage and risk factors were prognostic predictors of ccRCC (fig. 6G). These results suggested that the NRSS can be used as a novel prognostic biomarker. The score of each variable was calculated and used to comprehensively predict the prognosis of patients. The C-index of the established nomogram, risk signature and Tumor, Nodes and Metastases (TNM) stage were 0.765, 0.700 and 0.694, respectively (Table 1). In summary, the predictive ability of the NRSS was higher than the traditional TNM-staging system, however, the nomogram that integrated multiple clinical parameters had the highest accuracy (fig. 7). The calibration curve results also confirmed a good agreement between the actual and predicted probabilities (fig. 7A-fig. 7C). Consistent with the above data, the DCA results shown in fig. 7D-fig. 7F also showed that the nomogram combined with various clinical features was more valuable for clinical applications.
| Cohorts | Variables | C-index (95 % CI) |
|---|---|---|
| ccRCC | TNM-stage | 0.700 (0.679-0.721) |
| NRSS | 0.751 (0.733-0.770) | |
| Nomogram | 0.787 (0.770-0.804) |
Table 1: The C-Index of TNM Stage, NRSS and Nomogram
Fig. 7: Performance of NRSS. (A-C) Calibration curves of the nomogram for predicting survival at 1 y, 3 y and 5 y. If the actual curve is closer to the ideal curve, the nomogram prediction accuracy is higher, ( ) 1 y, 3 y, 5 y; (
 ) Ideal line; (D-F) DCA of this nomogram, including the TNM stage, risk score model, the nomogram shows that advanced age, grade, risk score and partially were better than stage for predicting survival for 1 y, 3 y, 5y, (
 ) TNM; (
 ) Risk score; (
 ) Nomogram; (
 ) All positive; (
 ) All negative
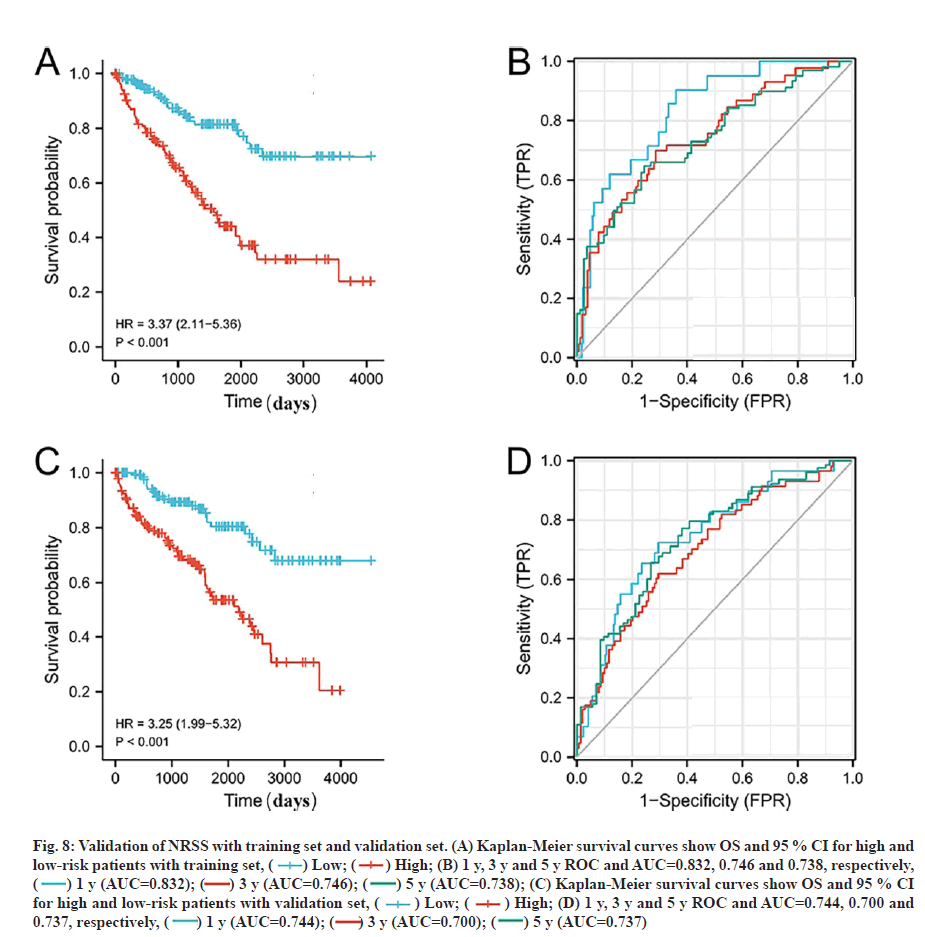
Validation of the prognostic signature based on the prognostic NRGs for OS is shown below. To verify the applicability of the NRSS, we randomly divided the 539 ccRCC patients in the entire dataset into training (n=269) and validation sets (n=270). The risk scores were calculated for each patient and used to stratify the patients in training and validation sets, and high and low-risk groups according to the median risk score. Consistent with the results from the whole dataset, the OS rate of patients in the high-risk group in the training and validation sets was lower than in the low-risk group (p<0.01, fig. 8A and fig. 8C). Also, the ROC curves of the two sets showed good performance. The AUCs for the 1 y, 3 y and 5 y OS of the training set were 0.832, 0.746 and 0.738 respectively (fig. 8B), and the AUCs for the 1 y, 3 y and 5 y OS of the validation set were 0.744, 0.700 and 0.737, respectively (fig. 8D).
Fig. 8: Validation of NRSS with training set and validation set. (A) Kaplan-Meier survival curves show OS and 95 % CI for high and low-risk patients with training set, ( ) Low; (
 ) High; (B) 1 y, 3 y and 5 y ROC and AUC=0.832, 0.746 and 0.738, respectively, (
 ) 1 y (AUC=0.832); (
 ) 3 y (AUC=0.746); (
 ) 5 y (AUC=0.738); (C) Kaplan-Meier survival curves show OS and 95 % CI for high and low-risk patients with validation set, (
 ) Low; (
 ) High; (D) 1 y, 3 y and 5 y ROC and AUC=0.744, 0.700 and 0.737, respectively, (
 ) 1 y (AUC=0.744); (
 ) 3 y (AUC=0.700); (
 ) 5 y (AUC=0.737)
ccRCC is the most common subtype of RCC that accounts for more than 70 % of all cases worldwide[18]. ccRCC originates from the renal tubular epithelial cells which overexpress the Multidrug Resistance (MDR) protein and P-glycoprotein resulting in resistance to most chemotherapy regimens and radiotherapy[19]. Currently, only 5-Fluorouracil (5-FU) combined with immunotherapy drugs has efficacy in the treatment of ccRCC. However, it has been shown that Interferon alpha (IFN-α) alone has the same effect as when combined Interleukin-2 (IL-2) and 5-FU[20], so chemotherapy as a monotherapy is not recommended in the treatment of ccRCC. Developments have been made in the area of targeted therapies such as sorafenib, sunitinib and axitinib that target the Vascular Endothelial Growth Factor (VEGF) axis. However, existing therapeutic targets are prone to the development of drug resistance and there is an urgent need for novel therapies and a better understanding of the mechanisms of resistance to therapy.
Necroptosis is a novel mechanism of cell death that has been recently identified[7]. Necroptosis shares characteristics of both necrosis and apoptosis, and is jointly regulated by RIPK1, RIPK3 and MLKL[21]. Necroptosis is a double-edged sword in cancer progression[22] and its effects are dependent on tumor type and stage of development. For example, most tumor cells are resistant to necroptosis and promote tumor growth due to low expression levels of RIPK3 and MLKL[23,24]. Conversely, tumor cells can activate death receptor 6 of the death receptor family to induce necroptosis in endothelial cells[25] and promote tumor cell extravasation and metastasis[26,27]. Given the broad roles of necroptosis in cancer, a better understanding of the relationship between necroptosis and ccRCC may facilitate the development of novel treatments for ccRCC.
Data from TCGA-KIRC was selected for analysis. Variation analysis was performed to identify gene expression differences between the normal and the tumor group and to obtain gene annotation information. We then conducted GO and KEGG enrichment analyses for the DEGs. The results showed, revealed that necroptosis and tumor-related signal pathways were significantly enriched indicating that necroptosis was closely related to the occurrence of ccRCC[28]. We then explored the potential role of DEGs in tumor prognosis. We identified necroptosis related genes (DENGs) in the DEGs and showed that 11 independent necroptosis genes were associated with prognosis based on Cox and LASSO regression analyses. We then constructed a NRSS to effectively predict the prognosis. Amongst these genes, BID encodes death agonists that can heterodimerize with B-Cell Lymphoma 2 (BCL2) or Bcl-2 Associated X-Protein (BAX). Also, BID regulates Apoptosis Inducing Factor (AIF)-mediated caspaseindependent necroptosis by promoting BAX activation [29]. The protein encoded by JAK3 is a member of the JAK tyrosine kinase family that is mainly expressed in immune cells and transduces signals through tyrosine phosphorylation of interleukin receptors. Studies have shown that JAK3 can mediate autophagy and regulate necroptosis through caspases and other cysteine proteases[30].
The protein encoded by TLR3 is a member of the TLR family and plays a fundamental role in pathogen recognition and activation of the innate immune response. This occurs through Pathogen-Associated Molecular Patterns (PAMPs) that are expressed on infectious factors and mediate the production of cytokines required for effective immune development. TLR3 can also activate the Receptor-Interacting Protein 1 (RIP1)/Receptor-Interacting Protein 3 (RIP3)/MLKLsignaling pathway by combining with members of the Tumor Necrosis Factor Receptor (TNFR) superfamily and the TLR4 signal mediate necroptosis[31].
IRF9 encodes a member of the IRF family which is a group of transcription factors with a variety of functions including virus-mediated activation of interferon and regulation of cell growth, differentiation, apoptosis and immune system activity. Interferon beta (IFN-β) has been shown to induce continuous expression of Signal Transducer and Activator of Transcription (STAT) 1, STAT2 and IRF9 leading to the necroptosis of macrophages[32]. Also, GSEA has shown that the WNT pathway is significantly correlated with DEGs. Liu et al.[33] found that the downstream effector of the WNT/β-catenin pathway, Lymphoid Enhancer- Binding Factor 1 (LEF1), is a transcriptional inhibitor of Chronic Lymphocytic Leukemia (CLL) and that down-regulation of LEF1 sensitizes CLL cells to Tumor Necrosis Factor alpha (TNFα)/zVAD-induced necroptosis. These findings suggest that ccRCC is associated with the expression levels of many genes that have known roles in regulating cell death processes including necroptosis.
In this study, Kaplan-Meier analysis demonstrated the effectiveness of the NRSS in predicting the prognosis of ccRCC. There was a significant difference in OS between the high and low-risk groups suggesting that the high-risk group was associated with adverse outcomes. The survival ROC and calibration curve results also showed that the predictive effect of the model agreed with the actual results. Multivariate Cox analysis also showed that the NRSS was a strong independent predictor of prognosis. To comprehensively evaluate prognosis, we established a nomograph to score the survival probability of each patient by combining various clinical data. The prediction results of the DCA and C-index also showed that the prediction accuracy of the NRSS was higher than traditional TNM staging.
Compared with previous prognostic signature[34], we add internal validation to our work, which improves the reliability of the prediction ability of the model. Secondly, gene set enrichment analysis was used to further explain the phenotypic enrichment of ccRCC differential genes, providing a new perspective for further understanding the physiological process of ccRCC. Finally, we discussed the relationship between necrosis and ccRCC, in order to establish a new model for patient individualized diagnosis and treatment, and possibly provide new therapeutic targets.
The NRSS was internally validated which supported its strong predictive accuracy. However, our study has several limitations. Firstly, the mechanism of necroptosis in ccRCC requires further validation in vivo and secondly, we only used data from TCGA for analysis. Although internal validation was performed, external validation is required in other patient cohorts to confirm our findings.
In conclusion, we developed a necroptosis related gene prognostic model. In this process, we used LASSO regression to improve the accuracy and interpretability of the model and eliminate collinearity amongst the independent variables. The model was verified using DCA. The ROC curves were used to evaluate the quality of the model. Our data showed that the model had high sensitivity and specificity and should be considered clinical applications to analyze the prognosis of ccRCC patients. Our study provided new insights into the role of necroptosis in the management of ccRCC. It may play a role in the early diagnosis of ccRCC and the discovery of new therapeutic targets. The prediction results of the DCA and C-index also showed that the prediction accuracy of the NRSS was higher than traditional TNM staging, but further validation of our model is required in larger prospective studies to verify our findings.
Author’s contributions:
Yiming Tao contributed in conceiving designing and editing the manuscript. Yiming Tao, Hui Zhao, Wenpei Dang worked in manuscript writing. Xinxin Xu, Lijuan Zou, Yongsheng Li worked on contribution of logical interpretation and presentation of the results.
Acknowledgements:
The authors gratefully acknowledge the KEGG and TCGA database, which made the data available.
Conflict of interests:
The authors declare that they have no conflict of interests.
References
- Weissinger D, Tagscherer KE, Macher-Göppinger S, Haferkamp A, Wagener N, Roth W. The soluble Decoy Receptor 3 is regulated by a PI3K-dependent mechanism and promotes migration and invasion in renal cell carcinoma. Mol Cancer 2013;12(1):1-5.
[Crossref] [Google Scholar] [PubMed]
- Schöffski P, Guillem V, Garcia M, Rivera F, Tabernero J, Cullell M, et al. Phase II randomized study of Plitidepsin (Aplidin), alone or in association with L-carnitine, in patients with unresectable advanced renal cell carcinoma. Mar Drugs 2009;7(1):57-70.
[Crossref] [Google Scholar] [PubMed]
- Li JK, Chen C, Liu JY, Shi JZ, Liu SP, Liu B, et al. Long noncoding RNA MRCCAT1 promotes metastasis of clear cell renal cell carcinoma via inhibiting NPR3 and activating p38-MAPK signaling. Mol Cancer 2017;16(1):1-4.
[Crossref] [Google Scholar] [PubMed]
- Hasanov E, Jonasch E. MK-6482 as a potential treatment for von Hippel-Lindau disease-associated clear cell renal cell carcinoma. Expert Opin Investig Drugs 2021;30(5):495-504.
[Crossref] [Google Scholar] [PubMed]
- Wang R, Li H, Wu J, Cai ZY, Li B, Ni H, et al. Gut stem cell necroptosis by genome instability triggers bowel inflammation. Nature 2020;580(7803):386-90.
- Vo TT, Ryan J, Carrasco R, Neuberg D, Rossi DJ, Stone RM, et al. Relative mitochondrial priming of myeloblasts and normal HSCs determines chemotherapeutic success in AML. Cell 2012;151(2):344-55.
- Degterev A, Huang Z, Boyce M, Li Y, Jagtap P, Mizushima N, et al. Chemical inhibitor of nonapoptotic cell death with therapeutic potential for ischemic brain injury. Nat Chem Biol 2005;1(2):112-9.
[Crossref] [Google Scholar] [PubMed]
- Chen W, Hill H, Christie A, Kim MS, Holloman E, Pavia-Jimenez A, et al. Targeting renal cell carcinoma with a HIF-2 antagonist. Nature 2016;539(7627):112-7.
[Crossref] [Google Scholar] [PubMed]
- Pikarsky E. Neighbourhood deaths cause a switch in cancer subtype. Nature 2018;562:45-6.
[Crossref] [Google Scholar] [PubMed]
- Chen M, Zhang S, Nie Z, Wen X, Gao Y. Identification of an autophagy-related prognostic signature for clear cell renal cell carcinoma. Front Oncol 2020;10:873.
[Crossref] [Google Scholar] [PubMed]
- Chandran UR, Medvedeva OP, Barmada MM, Blood PD, Chakka A, Luthra S, et al. TCGA expedition: A data acquisition and management system for TCGA data. PLoS One 2016;11(10):e0165395.
[Crossref] [Google Scholar] [PubMed]
- Ogata H, Goto S, Sato K, Fujibuchi W, Bono H, Kanehisa M. KEGG: Kyoto encyclopedia of genes and genomes. Nucleic Acids Res 1999;27(1):29-34.
- Maag JL. gganatogram: An R package for modular visualisation of anatograms and tissues based on ggplot2. F1000Res 2018;7:1576.
[Crossref] [Google Scholar] [PubMed]
- Walter W, Sánchez-Cabo F, Ricote M. GOplot: An R package for visually combining expression data with functional analysis. Bioinformatics 2015;31(17):2912-4.
[Crossref] [Google Scholar] [PubMed]
- Yu G, Wang LG, Han Y, He QY. clusterProfiler: An R package for comparing biological themes among gene clusters. OMICS 2012;16(5):284-7.
[Crossref] [Google Scholar] [PubMed]
- Alhamzawi R, Ali HT. The Bayesian adaptive lasso regression. Math Biosci 2018;303:75-82.
[Crossref] [Google Scholar] [PubMed]
- Talluri R, Shete S. Using the weighted area under the net benefit curve for decision curve analysis. BMC Med Inform Decis Mak 2016;16(1):1-9.
- Zheng Y, Wen Y, Cao H, Gu Y, Yan L, Wang Y, et al. Global characterization of immune infiltration in clear cell renal cell carcinoma. Onco Targets Ther 2021;14:2085-100.
[Crossref] [Google Scholar] [PubMed]
- Wang KJ, Meng XY, Chen JF, Wang KY, Zhou C, Yu R, et al. Emodin induced necroptosis and inhibited glycolysis in the renal cancer cells by enhancing ROS. Oxid Med Cell Longev 2021;2021.
[Crossref] [Google Scholar] [PubMed]
- Zheng W, Zhou CY, Zhu XQ, Wang XJ, Li ZY, Chen XC, et al. Oridonin enhances the cytotoxicity of 5-FU in renal carcinoma cells by inducting necroptotic death. Biomed Pharmacother 2018;106:175-82.
[Crossref] [Google Scholar] [PubMed]
- Sarhan J, Liu BC, Muendlein HI, Li P, Nilson R, Tang AY, et al. Caspase-8 induces cleavage of gasdermin D to elicit pyroptosis during Yersinia infection. Proc Natl Acad Sci USA 2018;115(46):E10888-97.
- Wang Z, Guo LM, Zhou HK, Qu HK, Wang SC, Liu FX, et al. Using drugs to target necroptosis: Dual roles in disease therapy. Histol Histopathol 2018;33(8):773-89.
[Crossref] [Google Scholar] [PubMed]
- Davies KA, Tanzer MC, Griffin MD, Mok YF, Young SN, Qin R, et al. The brace helices of MLKL mediate interdomain communication and oligomerisation to regulate cell death by necroptosis. Cell Death Differ 2018;25(9):1567-80.
[Crossref] [Google Scholar] [PubMed]
- Nugues AL, El Bouazzati H, Hetuin D, Berthon C, Loyens A, Bertrand E, et al. RIP3 is downregulated in human myeloid leukemia cells and modulates apoptosis and caspase-mediated p65/RelA cleavage. Cell Death Dis 2014;5(8):e1384.
[Crossref] [Google Scholar] [PubMed]
- Strilic B, Yang L, Albarrán-Juárez J, Wachsmuth L, Han K, Müller UC, et al. Tumour-cell-induced endothelial cell necroptosis via death receptor 6 promotes metastasis. Nature 2016;536(7615):215-8.
[Crossref] [Google Scholar] [PubMed]
- Jiao D, Cai Z, Choksi S, Ma D, Choe M, Kwon HJ, et al. Necroptosis of tumor cells leads to tumor necrosis and promotes tumor metastasis. Cell Res 2018;28(8):868-70.
[Crossref] [Google Scholar] [PubMed]
- Seifert L, Werba G, Tiwari S, Ly NN, Alothman S, Alqunaibit D, et al. The necrosome promotes pancreatic oncogenesis via CXCL1 and Mincle-induced immune suppression. Nature 2016;532(7598):245-9.
[Crossref] [Google Scholar] [PubMed]
- Zhao C, Zhou Y, Ran Q, Yao Y, Zhang H, Ju J, et al. MicroRNA-381-3p functions as a dual suppressor of apoptosis and necroptosis and promotes proliferation of renal cancer cells. Front Cell Dev Biol 2020;8:290.
[Crossref] [Google Scholar] [PubMed]
- Cabon L, Galan-Malo P, Bouharrour A, Delavallée L, Brunelle-Navas MN, Lorenzo HK, et al. BID regulates AIF-mediated caspase-independent necroptosis by promoting BAX activation. Cell Death Differ 2012;19(2):245-56.
[Crossref] [Google Scholar] [PubMed]
- Farkas T, Daugaard M, Jäättelä M. Identification of small molecule inhibitors of phosphatidylinositol 3-kinase and autophagy. J Biol Chem 2011;286(45):38904-12.
[Crossref] [Google Scholar] [PubMed]
- Yang ZH, Wu XN, He P, Wang X, Wu J, Ai T, et al. A non-canonical PDK1-RSK signal diminishes pro-caspase-8-mediated necroptosis blockade. Mol Cell 2020;80(2):296-310.
[Crossref] [Google Scholar] [PubMed]
- McComb S, Cessford E, Alturki NA, Joseph J, Shutinoski B, Startek JB, et al. Type-I interferon signaling through ISGF3 complex is required for sustained Rip3 activation and necroptosis in macrophages. Proc Natl Acad Sci USA 2014;111(31):E3206-13.
[Crossref] [Google Scholar] [PubMed]
- Liu P, Xu B, Shen W, Zhu H, Wu W, Fu Y, et al. Dysregulation of TNF?-induced necroptotic signaling in chronic lymphocytic leukemia: Suppression of CYLD gene by LEF1. Leukemia 2012;26(6):1293-300.
- Zhao GJ, Wu Z, Ge L, Yang F, Hong K, Zhang S, et al. Ferroptosis-related gene-based prognostic model and immune infiltration in clear cell renal cell carcinoma. Front Genet 2021;12.
[Crossref] [Google Scholar] [PubMed]
