- *Corresponding Author:
- C. J. Kapadia
Departments of Pharmaceutics,Mumbai–400 098, India
E-mail: drcjkapadia@gmail.com
| Date of Submission | 15 November 2010 |
| Date of Revision | 10 January 2012 |
| Date of Acceptance | 27 January 2012 |
| Indian J Pharm Sci, 2012, 74 (1): 36-40 |
Abstract
A simple, precise, accurate and rapid high performance thin layer chromatographic method has been developed and validated for the estimation of tenoxicam in the microemulsion gels. Tenoxicam was chromatographed on silica gel 60 F254 TLC plate, as a stationary phase. The mobile phase was toluene: ethyl acetate: formic acid (6:4:0.3 v/v/v), which gave a dense and compact spot of tenoxicam with a Rf value of 0.38±0.03. The quantification was carried out at 379 nm. The method was validated in terms of linearity, accuracy, precision and specificity. To justify the suitability, accuracy and precision of the proposed method, recovery studies were performed at three concentration levels. Statistical analysis proved that the proposed method is accurate and reproducible with linearity in the range of 100 to 400 ng. The limit of detection and limit of quantification for tenoxicam were 25 and 50 μg/spot, respectively. The proposed method can be employed for the routine analysis of tenoxicam as well as in pharmaceutical formulations.
Keywords
Gel, HPTLC-desitometry, microemulsion, tenoxicam, validationResearch
Introduction
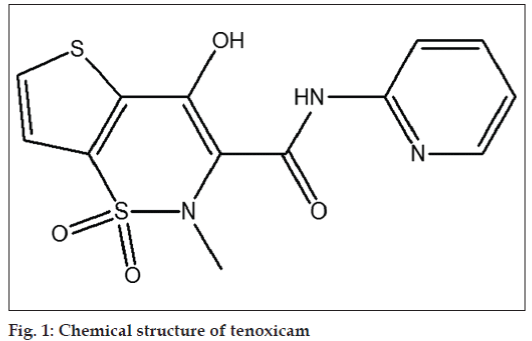
Tenoxicam, 4-Hydroxy-2-methyl-N-2-pyridinyl-2H-thienol [2,3e]-1,2-thiazine-3- carboxamide-1,1-dioxide (fig. 1), is a non-steroidal antiinflammatory drug (NSAID) of oxicam group, used in the treatment of rheumatoid arthritis, osteoarthritis, ankylosing spondylitis and gout [1]. Its primary mode of action is the inhibition of cyclooxygenase and subsequent prostaglandin formation [2]. Tenoxicam inhibits number of leucocyte functions, including phagocytosis and histamine release, which may contribute to its antiinflammatory activity.
Tenoxicam has been determined by a variety of methods and liquid chromatography is the most commonly used method of analysis for determination of tenoxicam [3-5]. Spectrophotometric [6-9], coulometric [10], potentiometric [11], polarographic [12] and spectroflurimetric [13,14] methods are also available. However; they are highly sophisticated, costly and time consuming.
Nowadays, high performance thin layer chromatography (HPTLC) has become a routine analytical technique due to its advantages of reliability in quantitation, analysis at microgram and even in nanogram levels and cost effectiveness. This method is advantageous since large number of samples can be simultaneously subjected to analysis. The amount of solvent required in comparison to HPLC is very less. This reduces the time and cost of analysis and possibilities of pollution of the environment. HPTLC also facilitates repeated detection (scanning) of the chromatogram with same or different parameters. Simultaneous assay of several components in a multicomponent formulation is also possible [15,16]. Hence, the present investigation was undertaken to develop and validate a simple, rapid,accurate, precise and specific HPTLC method for determination of tenoxicam.
Materials and Methods
Tenoxicam was procured as a gift sample from Ranbaxy Pharmaceuticals Ltd., Devas (M.P.), India. Silica gel 60F254 TLC plates (20×20 cm, layer thickness 0.2 mm, E. Merck, Darmstadt, Germany) were purchased from Merck Ltd India, Mumbai and used as stationary phase. Analytical grade acetonitrile, methanol, chloroform, toluene, formic acid, ethyl acetate, hexane (60-80°), acetone and glacial acetic acid were all obtained from Qualigens Fine Chemicals, Mumbai, India.
HPTLC Instrumentation
Thin layer chromatography was performed on 10×10 cm aluminium backed TLC plates coated with 250 mm layer of silica gel 60F254 (E. Merck, Darmstadt, Germany). The plates were prewashed by methanol and activated at 105-110° for 15 min prior to use for chromatography. The samples in methanol were spotted as 6 mm wide bands at a distance of 10 mm from the bottom and 20 mm from the sides of the plate, under continuous flow of nitrogen by means of a Camag Linomat 5 sample applicator (Camag, Muttenz, Switzerland) fitted with a 100 μl syringe. A constant application rate of 150 nl/s was employed and the distance between adjacent bands was 9 mm. The plates were then conditioned for 20 min in a pre-saturated twin-trough chamber (Camag, Muttenz, Switzerland, 10×10 cm2) with the mobile phase, toluene:ethyl acetate:formic acid (6:4:0.3 v/v/v), in one trough and the plate in the other trough. The plate was then placed in the mobile phase and ascending development was performed upto a distance of 80 mm from application position at ambient temperature. After development, plates were air dried and densitometric scanning was performed at a wavelength of 379 nm with Camag TLC scanner III operated in the reflectance-absorbance mode and controlled by WinCATS software (V1.2.1). The slit dimension was kept at 5×0.45 mm and scanning speed employed was 20 mm s-1. Evaluation was done using linear regression versus peak areas.
Preparation of standard tenoxicam solution and samples
A fresh stock solution of tenoxicam was prepared in acetonitrile (1000 mg/ml). Standard solutions were prepared by dilution of the stock solution with acetonitrile to give solutions containing of 100, 150, 200, 250, 300, 350 and 400 mg/ml. One microlitre from each standard solution was spotted on the TLC plate to obtain a final concentration range of 100-400 ng per spot. The standard curve was replicated six times on different plates.
Sensitivity
In order to estimate the limit of detection (LOD) and limit of quantification (LOQ), blank acetonitrile was spotted six times following the same method as explained above. Solutions containing 5–100 ng of tenoxicam were spotted on TLC plate. The signal to noise ratio was determined. An LOD was considered as 3:1 and LOQ as 10:1.
Selectivity
The selectivity of the assay was determined in relation to interferences from three different microemulsion gels containing isopropyl myristate, oleic acid, brij 96, transcutol, tween 80.
Recovery study
In order to determine the recovery, known quantities of a previously analysed reference standard corresponding to 50, 100 and 150 percent of the label claim were spiked during the extraction procedure, i.e. to 1 g of gel (label claim 5 mg/g of gel), 2.5, 5, 7.5 mg of tenoxicam was added. Then drug was extracted by employing acetonitrile as a solvent for extraction and analyzed as described above. The recovery was calculated by comparing the resultant peak areas with those obtained from pure standards in acetonitrile at the same concentrations
Precision
Repeatability of sample application and measurement of peak area were carried out using six replicates of the same spot (250 ng per spot of tenoxicam). The intra-day and inter-day precision for the determination of tenoxicam was carried out at three different concentration levels of 100, 250 and 400 ng per spot.
Analysis of formulation
The developed method can be applied in determination of tenoxicam in microemulsion gel formulations. The drug from the microemulsion gels was extracted with acetonitrile in a 50 ml volumetric flask. The resulting solution was suitably diluted at desired concentration (200 ng/10 μl). Ten microlitres of the solution was applied on TLC plate followed by development, and scanned as described above. The analysis was repeated in triplicate. The possibility of excipient interference in the analysis was studied.
Results and Discussion
There are several spectroscopic and chromatographic methods reported for assay of tenoxicam, but HPTLC method of analysis has not been reported so far and so the aim was to develop and validate HPTLC method of analysis for tenoxicam.
A suitable solvent system for the composition of the mobile phase for development of chromatogram was optimized by testing different solvent mixtures of varying polarity. Various mobile phases were evaluated. Use of chloroform, methanol as single component and a short saturation time of 15 min gave a necklace effect. So chloroform:methanol (95:5, v/v), hexane:ethyl acetate (6:4, 7:3 v/v), toluene: acetic acid (10:3, 9:3 v/v), toluene:acetic acid:acetonitrile (3:6:2 v/v/v), toluene:acetic acid:methanol (9:3:1 v/v/v) were tried. The best results were obtained using toluene:ethyl acetate:formic acid (6:4:0.3, v/v/v). This mobile phase showed a good resolution and a compact spot of tenoxicam. Densitometric scanning of all the tracks at λmax 379 nm showed compound with Rf value 0.38±0.03 (single spot), identified as tenoxicam. The method was successfully used in the analysis of tenoxicam from the microemulsion gels without interference of the formulation excipients.
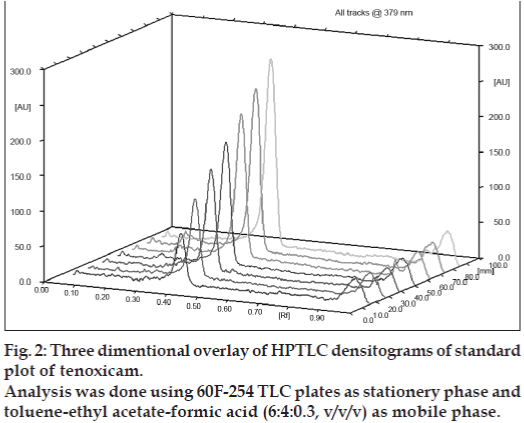
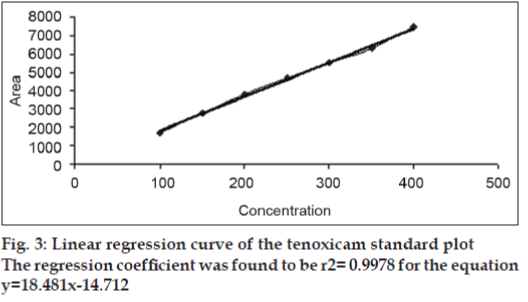
Under the experimental conditions employed, the lowest amount of drug which could be detected was found to be 25 ng/spot and the lowest amount of drug which could be quantified was found to be 50 ng/spot, with a relative standard deviation <5%. The calibration curve was found to be linear in the concentration range of 100–400 ng/spot (n=3). Fig. 2 shows 3D overlay of HPTLC densitograms of standard plot of tenoxicam, using 60F254 TLC plates and toluene:ethyl acetate:formic acid (6:4:0.3, v/v/v). Peak area and concentration was subjected to least square linear regression analysis to calculate the calibration equation and correlation coefficients. The one way ANOVA (p>0.05) shows no significant difference in the values of each calibration curve. The regression data as shown in Table 1 and fig. 3 showed a good linear relationship over the concentration range studied.
| Linearity range(ng/spot) | r2±SD | Slope±SD | Intercept±SD |
|---|---|---|---|
| 100-400 ng | 0.9977±0.0006 | 18.4812±0.2898 | -1471.22±22.4011 |
Table 1: Linear Regression Data For The Calibration Curves
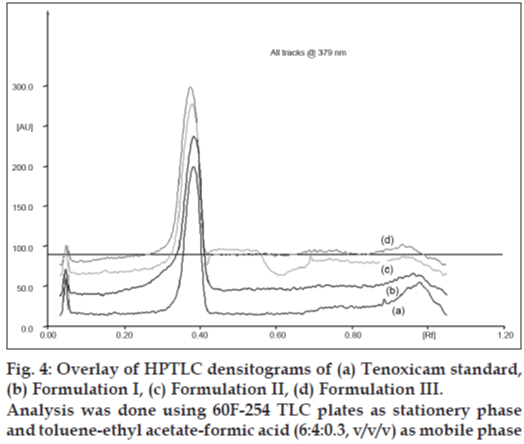
Fig. 4 shows overlay of HPTLC densitograms of tenoxicam standardand three inhouse microelumsion formulations obtianed using the developed method. There was no interference from the formulation component and Rf values of tenoxicam standard and tenoxicam in the microemulsion gels was found to be same thereby confirming the selectivity of the method.
The recovery of tenoxicam ranged from 98.90% to 101.99%, average of 100.45%, as shown in Table 2. These results showed high extraction efficiency of tenoxicam from formulation components and confirms that the proposed method can be used for determination of tenoxicam in microemulsion gel formulations.
| Amount of drug analysed (mg) | Amount of drugadded (mg) | Theoretical concentration (mg) | Total Amountdrug analysed | % recovery±S.D. |
|---|---|---|---|---|
| 5 | 2.5 | 7.5 | 7.65±0.20 | 101.99±2.71 |
| 5 | 5 | 10 | 9.89±0.09 | 98.90±0.91 |
| 5 | 7.5 | 12.5 | 12.58±0.10 | 100.64±0.81 |
| Average of three determinations |
Average of three determinations
Table 2: Recovery Studies Of Tenoxicam From Microemulsion Gels
For precision determination, two five and eight microliter aliquots of sample containing 100, 250 and 400 ng tenoxicam were analyzed according to the proposed method. In order to control the scanner parameters, one spot was analyzed several times. By spotting and analyzing the same amount (250 ng) several times (n=5) the precision of the automatic spotting device was evaluated. The relative standard deviation (% RSD) for the analysis of 5 replicate applications indicated good precision for the proposed TLC method (% RSD consistently less than 2) as shown in Table 3.
| Parameter | Values | ||
|---|---|---|---|
| Actual amount of tenoxicam spotted (ng) | 100 | 250 | 400 |
| Amount detecteda (ng±SD) | 95.05±1.40 | 245.17±3.69 | 407.82±3.90 |
| % RSD | 1.64 | 1.50 | 0.96 |
| Amount detectedb (ng±SD) | 94.39±0.90 | 244.48±4.04 | 409.63±1.94 |
| % RSD | 0.96 | 1.65 | 0.47 |
aOne spot is scanned 5 times, b5 spots scanned once
Table 3: Instrumental Precision And Accuracy Data
The result shown in Table 4 depicts good accuracy and high precision also for recovery studies. The accuracy was found to be in the range of 94.57? 100.38% and % RSD in range of 0.65?1.46.
| Amount of tenoxicam spotted (ng) | Amount detected (ng) (mean±SD, n= 3) | RSD (%) | Accuracy(%) | |
|---|---|---|---|---|
| 100 | 94.57±1.38 | 1.46 | 94.57 | |
| 250 | 250.94±3.21 | 1.28 | 100.38 | |
| 400 | 398.92±2.61 | 0.65 | 99.73 | |
Table 4: Accuracy Results Of The Assay
TThe repeatability and intermediate precision studies of tenoxicam at different levels was given in Table 5. The percentage RSD was found to range from 1.55 to 0.39%, averaging to 0.97%. Which confirms the good precision on the developed assay method.
| Amount of tenoxicamspotted (ng) | Amount detected (ng)(mean±SD) | RSD (%) |
|---|---|---|
| Inter-day (n= 3) | ||
| 100 | 95.29±0.75 | 0.79 |
| 250 | 249.92±1.59 | 0.63 |
| 400 | 400.97±1.55 | 0.39 |
| Intra-day (n=3) | ||
| 100 | 95.37±0.84 | 0.88 |
| 250 | 251.23±2.23 | 1.16 |
| 400 | 403.58±6.27 | 1.55 |
Table 5: Precision Data Of Hptlc Assay For Tenoxicam
The developed assay method was applied for the estimation of tenoxicam from three different gel formulations. The drug content of the formulations was found to be 4.96±0.04 mg, 4.97±0.01 mg and 4.93±0.03 mg, which corresponds to 99.16, 99.42 and 98.62%, respectively. This confirms that the method was successfully applied to the formulation analysis.
The proposed HPTLC method combined with densitometric analysis was found suitable for determination of tenoxicam. Statistical data analysis proves that the method is precise and reproducible for the analysis of tenoxicam. The system being economical can be employed for the routine estimation of the drug in pharmaceutical formulations as well as in bulk drug analysis.
References
- Tenoxicam. In, Dollery C, editor. Therapeutic drugs. 2nd ed., Vol. 2. Edinburgh, UK: Churchill Livingstone; 1999. p. 28.
- Todd PA, Clissold SP. Tenixicam: An update of its pharmacology and therapeutic efficacy in rheumatic diseases. Drugs 1991;41:625-46.
- Dixon JS, Lowe JR, Galloway DB. Differential pulse polarographic determination of tenoxicam in pharmaceuticals and added to blood. J Chromatogr B Biomed Sci Appl 1984;310:455-9.
- Heizmann P, Körner J, Zinapold K. Analysis of reduced oligosaccharides by combined use of gel chromatography and highperformance liquid chromatography. J Chromatogr B Biomed Sci Appl 1986;374:95-102.
- Múnera-Jaramillo MI, Botero-Garcés S. Determination of tenoxicam in plasma by high-performance liquid chromatography. J Chromatogr B Biomed Sci Appl 1993;616:349-52.
- El-Ries MA. Spectrophotometric and potentiometric determination of piroxicam and tenoxicam in pharmaceutical preparations. Anal Lett 1998;31:793-807.
- AL-Tamrah SA. Flow injection spectrophotometric determination of tenoxicam. Anal Chim Acta 1998;375:277-83.
- Taha EA, Salama NN, Abdel Fattah LS. Spectrofluorimetric and spectrophotometric stability-indicating methods for determination of some oxicams using 7-chloro-4-nitrobenz-2-oxa-1,3-diazole (NBD-Cl). Spectro Lett 2002;35:501-16.
- Amin AS. Spectrophotometric determination of piroxicam and tenoxicam in pharmaceutical formulations using alizarin. J Pharm Biomed Anal 2002;29:729-36.
- Yener G, Topaloulu Y. A spectrophotometric method for the determination of tenoxicam in tablets. Sci Pharm 1992;60:247-8.
- British Pharmacopoeia, Vol 1, British Pharmacopoeia Commission, London: Her Majesty Stationary Office; 1998. p. 1280.
- Özaltin N. Differential pulse polarographic determination of tenoxicam in pharmaceuticals and added to blood. Anal Chim Acta 2000;406:183- 9.
- Barary MH, Abdel-Hay MH, Sabry SM. Spectrofluorimetric determination of 2-aminopyridine as a potential impurity in piroxicam and tenoxicam within the pharmacopoeial limit. J Pharm Biomed Anal 2004;34:221-6.
- Mohamed HA, Wadood HM, Farghaly OA. Potentiometric and spectrofluorimetric studies on complexation of tenoxicam with some metal ions. J Pharm Biomed Anal 2002;28:819-26.
- Tayade NG, Nagarsenker MS. Validated HPTLC method of analysis for artemether and its formulations. J Pharm Biomed Anal 2007;43:839-44.
- Dixit RP, Barhate CR, Nagarsenkar MS. Stability indicating HPTLC method for simultaneous estimation of ezetimibe and simvatsatin. Chromatographia 2008;67:101-7.


