- *Corresponding Author:
- M. Ahmed
Institute of Chemistry, University of Punjab,Pakistan
E-mail: mahmoodresearchscholar@gmail.com
| Date of Submission | 23 June 2014 |
| Date of Revision | 23 January 2015 |
| Date of Acceptance | 02 August 2015 |
| Indian J Pharm Sci, 2015;77(4):434-438 |
This is an open access article distributed under the terms of the Creative Commons Attribution‑NonCommercial‑ShareAlike 3.0 License, which allows others to remix, tweak, and build upon the work non‑commercially, as long as the author is credited and the new creations are licensed under the identical terms.
Abstract
A new analytical method is developed and validates for simultaneous estimation of L-lysine hydrochloride and L-carnitine-L-tartrate in single pharmaceutical dosage form by means of high resolution HPLC. The chromatographic procedure was carried out using C18-5 µm (4.6 mm × 250 mm), column. Optimally suited mobile phase was made to run in an isocratic elution mode whose composition was 10 mM of potassium dihydrogen phosphate adjusted with triethylamine to a pH of 7.5 and pumped at a flow rate of 0.50 ml/min through chromatographic system. The detector's wavelength was 214 nm. The accuracy of the analytical method was determined keeping into account the recovery of analytes, which in this case remains well within the accepted standards that is 95-105%. Detection limit for L-lysine hydrochloride and L-carnitine-L-tartrate are 1.47 μg/ml and 0.85 μg/ml while quantitation limit for L-lysine hydrochloride and L-carnitine-L-tartrate is 4.41 and 2.55 μg/ml, respectively. All the statistical results were validated performing precision, accuracy, linearity, specificity studies for analytes concentration from 70-130%. The outcome of results confirmed that the method was in consonance with the acceptance criteria.
Keywords
L-Lysine hydrochloride, LCLT, HPLC, capsules, validation
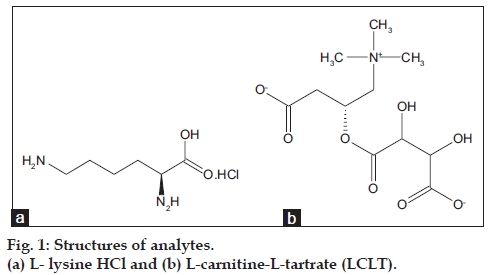
L-Lysine hydrochloride (2,6-diaminohexanoic acid hydrochloride) is an essential amino acid which is used for treatment of shingles and genital as well mouth lesions caused by herpes zoster and herpes simplex virus, respectively. It is also used for production of antibodies, enzymes and hormones inside the human body as well synthesis of antihypertensive agents and neutralizer for analgesic [1]. L-lysine has potential role in osteoporosis management by the intestinal absorption of calcium and its renal excretion elimination [2]. L-carnitine L-tartarate [LCLT, 2,3-dihydroxy-4-({(1R)-3-oxido- 3-oxo-1- [(trimethylammonio)methyl]propyl}oxy)-4- oxobutanoate] is base formed by the combination of tartaric acid and L-carnitine base abbreviated as LCLT essential for fat metabolism and energy production, it is a better than any other form of L-carnitine which has improved absorption from gastrointestinal (GI) tract and into muscle tissue [3-5]. LCLT reduced muscle tissue damage caused of exercise and training by enhancing the hormonal response [6,7]. Various analytical techniques like voltammetry, high performance liquid chromatography (HPLC), ion exchange chromatography and liquid chromatography-mass spectrometry (LC-MS) has been applied for determination of L-lysine in different matrixes such as cereals, nutrition, plant roots, shrimp by products, amino acid mixtures and animal feeds [8-13]. Quantification of L-carnitine in biological fluids, human plasma, pharmaceutics and urine by different analytical techniques such as capillary electrophoresis (CE), HPLC, HPLC-MS and CE-MS has been reported [14-18]. To our knowledge, no analytical method has been available for simultaneous determination of L-lysine and LCLT in pharmaceutical preparations. In the present study HPLC technique is used to develop the method for simultaneous estimation of L-lysine hydrochloride (fig. 1a) and LCLT (fig. 1b) in single pharmaceutical dosage form accompanied by its validation characteristics stated by ICH guidelines.
Materials and Methods
L-Lysine hydrochloride (Merck, Germany), L-carnitine-L-tartrate (KHF Chemicals, China), potassium dihydrogen phosphate (RDH, Germany), triethylamine (Merck, Germany), acetonitrile (Sigma Aldrich, USA), methanol (Sigma Aldrich, USA) and HPLC grade water was prepared in house using Milli-Q system (Millipore, MA, USA). To develop this technique chromatographic system used is Hitachi Chromaster comprising of autosampler (5210), pump (5110), column oven (5310) and diode array detector (5430) set at 214 nm using EZChrome Elite for data acquisition.
The chromatography performed for the separation of L-lysine and LCLT was performed using Purospher star C18 (250 mm×4.6 mm), 5 μm reverse phase column. The mobile phase comprising of 10 mM of potassium dihydrogen phosphate and pH was adjusted with triethylamine at 7.50. The detection was carried at 214 nm by pumping the mobile phase at flow rate of 0.5 ml/min while the temperature of column maintained at 25º. The injection volume was 20 μl and each test required just 6 min. and before injection all the standards, sample solutions as well mobile phase were filtered through membrane filter of 0.45 μm then sonicated.
Standard and sample solutions
1.0 g each of L-lysine hydrochloride and LCLT was dissolved in 1000 ml of water and by serial dilution of 100-180 μg/ml for L-lysine and 70-150 μg/ml for LCLT in mobile phase was prepared as standard solution for quantification of active products in final pharmaceutical preparation. For the assay of pharmaceutical preparation 10 capsules were taken, removed the shells, powdered, homogenized and weighed the contents. The amount of homogenized powder equivalent to 140 μg/ml of L-lysine hydrochloride and 100 μg/ml of LCLT was mixed in mobile phase and made volume upto 100 ml in volumetric flask.
Development and optimization of method
Mobile phase selected for the presented study contained 10 mM of potassium dihydrogen phosphate and triethylamine (TEA). TEA was selected because it served as a competing base for the less availability of octadecylsilane (ODS) stationary phase. The binding of TEA with the stationary phase reduced the prolonged retention time for L-lysine hydrochloride and LCLT also rectified the peak tailing. Several important factors were taken care of while selecting the suitable pH for the mobile phase. The optimal pH range while using silica column was kept between 2-8 as the stationary phase selected did not withstood pH less than 2 (phase loss due to hydrolysis). Conversely the pH greater than 8 did not work either because of ODS dissolution. Since L-lysine hydrochloride and LCLT contain amine functional group so pH ±1 of its pKa worked best for protonation of amines. Therefore, the final pH 7.5 provided excellent resolution and retention time. Phosphate buffers are also regarded as best as they can provide range of multiple options of buffer range for the compounds containing both amino and carboxyl groups with UV/Vis detector below 220 nm wavelength. Therefore, the buffer used for this experiment was potassium dihydrogen phosphate. Other buffers tried were acetate and citrate. Acetate buffer could hardly manage the desired pH value whereas the citrate buffer was not in agreement with UV/Vis detector below 220 nm. The wavelength selected for this experiment after scanning the standard solution in mobile phase at pH 7.5 in range of 190–380 nm. The detection wavelength of 214 nm was chosen because the maximum absorption of L-lysine hydrochloride and LCLT was obtained
Specificity
Placebo solution which may interfere was prepared by dissolving the excipients used in pharmaceutical preparation in mobile phase as well as active raw material identified by comparing it with reference standards for specificity studies.
Linearity
Three independent calibration curves were obtained by weighing the active and corresponding amount of placebo in 70-130% concentration of working, 140 μg/ml of L-lysine hydrochloride and 100 μg/ml of LCLT by dissolving in mobile phase. Calibration graph present the experimental results and statistical study was performed for the correlation of individual calibration curves.
Precision
Instrumental precision was evaluated by injection of the concentration corresponding to sample (140 μg/ml of L-lysine hydrochloride and 100 μg/ml of LCLT) 10 times on two consecutive days and calculated the % RSD. Standard solution precision was tested by injecting three solutions each of 70, 100 and 130% of working concentration. RSD was studied for the relationship between the concentration and area obtained (response factor). Precision of method and intermediate precision was tested by studying the RSD of response factor by seven individual samples preparation on same and different days by analyst change respectively.
Accuracy
The known amount of active at the concentration levels of 70, 100 and 130% (three samples of each) was added to determined amount of placebo. L-lysine hydrochloride and LCLT amount recovered in relation to amount added described the accuracy of method.
Limit of detection and limit of quantitation
Limit of Detection (LOD) and Limit of Quantitation (LOQ) were determined by standard deviation of the response based on the slope of the calibration curve by six injections of five samples each of L-lysine hydrochloride and LCLT under the optimized chromatographic conditions. LOD=yB+3sB; LOQ=yB+10sB, Where yB is intercepts of regression line and sB is standard deviation of intercepts of regression line [19].
Robustness
The method robustness was determined to estimate the effect of small but purposeful variation in chromatography for quantification of methyl paraben, propyl paraben and loratadine. Evaluation of robustness was done by changing mobile phase flow rate (±0.2 ml/min), analytical wavelength (±2 nm), column brand (Merck and Teknokroma) and column temperature (±2º).
Stability of the solutions
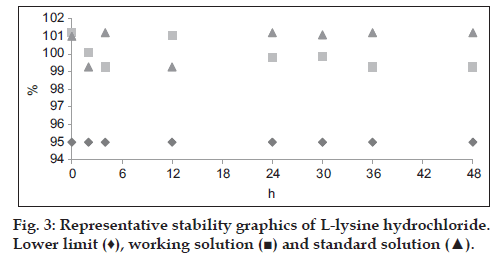
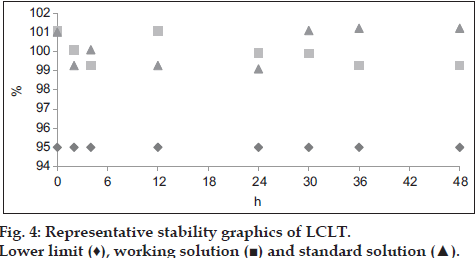
Stability of reference and sample solution was noticed after 48 h, 95% of assay indicates the stability of solutions. If any extraneous peak of impurities or degraded products is observed in chromatogram of both samples for chromatographic method, consider the solution is not stable.
Results and Discussion
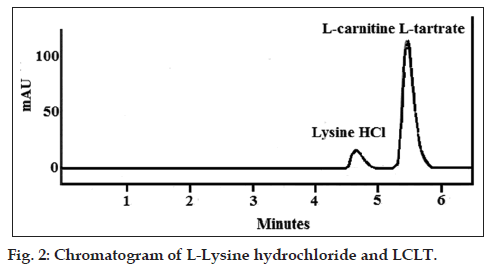
The chromatographic parameters like capacity factors, number of theoretical plates, tailing factor, injection precision and resolution two consecutive peaks for the performance of system suitability was evaluated. Representative chromatogram corresponds to separation of L-lysine hydrochloride and LCLT (fig. 2) is shown. The capacity factor was 2.348 and 6.761; theoretical plates were 2916.6 and 3950.6 for L-lysine hydrochloride and LCLT, respectively. The tailing factor 1.573 for L-lysine hydrochloride 1.473 for LCLT and %RSD for injection precision was 0.865 for L-lysine hydrochloride and 0.987 for LCLT. The resolution between peaks of L-lysine hydrochloride and LCLT was 2.306. The studied parameters within the limits of established ICH guidelines optimized the develop method by proving the suitability of system; the results are summarized in Table 1. For specificity the retention time of the raw material and reference of L-lysine hydrochloride and LCLT was 4.673 and 5.473, respectively same in both chromatogram. The chromatogram of placebo preparation showed no interference which concluded that method is selective in relation to the excipients of the final preparation. Specificity chromatogram for the placebo showing a straight line indicating nonexistent interfering peaks by excipients. Significant correlation was obtained between three independent calibration curves of both L-lysine hydrochloride and LCLT at 95% confidence of interval. The regression curve y=4579.7x+223503 and y=30211x+300000 correspond to test concentration and its response with correlation 0.9997 and 0.9999 for L-lysine hydrochloride and LCLT, respectively was obtained which is higher than the value established by ICH guidelines. RSD for instrumental system precision was 0.056, 0.031 (first day) 0.052, 0.023 (second day) for retention time and 0.872, 0.987 (first day) 0.882, 0.977 (second day) for area correspond to L-lysine hydrochloride and LCLT, respectively. L-lysine hydrochloride and LCLT standard and sample solution precision showed a %RSD 0.931, 0.965 and 0.823, 0.981 for the response factor respectively. For the intermediate precision, a study carried out by the same and different analyst working on different days (n=7 number of analyses per day). Percentage RSD was 0.931, 0.965 and 0.823, 0.981 for L-Lysine hydrochloride and LCLT, respectively.
| Parameters | L‑lysine | LCLT |
|---|---|---|
| Capacity factor | 2.348 | 6.761 |
| Theoretical plates | 2916.6 | 3950.6 |
| Tailing factor | 1.573 | 1.473 |
| Injection precision (% RSD) | 0.865 | 0.987 |
| Resolution | ‑ | 2.306 |
LCLT: L‑carnitine‑L‑tartrate, RSD: relative standard deviation
Table 1: System Suitability Tests
In all these cases the RSD obtained was in compliance with standard requirements set by ICH, thus the instrumental system worked satisfactorily for proposed analytical method, also has good intermediate precision and being highly repetitive. Nine samples each of L-lysine hydrochloride and LCLT (n=3 for 70, 100 and 130% each) studied for accuracy (recovery method) of method. The mean recovery for L-lysine hydrochloride and LCLT was 100.22% (with SD=0.452 and RSD=0.451) and 100.01% (with SD=1.040 and RSD=1.038), respectively. Experimental t-value of recovery percentage was 1.46 and 0.029 for L-lysine hydrochloride and LCLT, respectively which is below than the tabulated value at 95% confidence of interval. Therefore developed analytical method is sufficiently accurate for its active recovery from matrix. From the five point linear regression equation the detection limits for L-lysine hydrochloride and LCLT is 1.47 and 0.85 μg/ml which corresponds to 1.5% and 0.85% of working concentration (140 μg/ml and 100 μg/ml), respectively. Quantitation limit for L-lysine hydrochloride and LCLT is 4.41 and 2.55 μg/ml which corresponds to 4.5% and 2.55% of working concentration respectively. Lower limits of detections indicate the sensitivity of method. The validation results are shown in Table 2. For robustness the influence of each of the variables does not affect the result obtained for percentage L-lysine hydrochloride and LCLT in pharmaceutical preparation. Therefore, variation in front of the wavelength, the temperature of column, the flow rate and by using different column method is consistent. The results of assay are presented in Table 3. The percentage assay of each of standard and sample solution (L-lysine hydrochloride and LCLT) was done in different time interval within 48 h. No peak was observed which indicated the stability of solution as well percent assay was greater than prescribed limit. The graphical explanation (figs. 3 and 4) of stability of both the standards and sample solution are presented. In conclusion, a simple and rapid new analytical method for the simultaneous estimation of lysine HCl and LCLT in capsules has been developed using HPLC which is strictly in accordance with ICH guidelines and proves itself to be supremely up to the validation accepted standards every step of the way.
| Parameters | L‑lysine hydrochloride | LCLT |
|---|---|---|
| System precision | ||
| (%RSD) | ||
| Retention time | 0.056 (first day), | 0.031 (first day), |
| 0.052 (second day) | 0.023 (second day) | |
| Area | 0.872 (first day), | 0.987 (first day), |
| 0.882 (second day) | 0.977 (second day) | |
| Sample solution | ||
| precision (%RSD) | ||
| Same analyst | 0.931 | 0.965 |
| Different | 0.823 | 0.981 |
| analyst | ||
| Recovery (%) | 100.22 | 100.01 |
| LOD (µg/ml) | 1.47 | 0.85 |
| LOQ (µg/ml) | 4.41 | 2.55 |
LCLT: L‑carnitine‑L‑tartrate, RSD: relative standard deviation, LOD: limit of detection, LOQ: limit of quantitation
Table 2: Validation Results
| L‑lysine | LCLT | |
|---|---|---|
| hydrochloride | ||
| Change in flow rate | ||
| 0.3 ml/min (n=3) | 100.12±1.147 | 99.50±1.203 |
| 0.7 ml/min (n=3) | 99.98±0.901 | 100.01±0.657 |
| Change in detection wavelength | ||
| 212 nm (n=3) | 100.69±1.195 | 100.44±1.061 |
| 216 nm (n=3) | 100.81±1.047 | 100.55±0.935 |
| Change of column | ||
| Merck (n=3) | 100.83±1.032 | 99.48±0.900 |
| Teknokroma (n=3) | 100.72±1.177 | 99.43±1.085 |
| Change in column temperature | ||
| 23° (n=3) | 99.87±0.772 | 100.63±0.846 |
| 27° (n=3) | 101.85±0.873 | 101.51±0.991 |
SD for n=3 observations. LCLT: L‑carnitine‑L‑tartrate, SD: standard deviation
Table 3:Assay results for l‑lysine Hydrochloride and lclt
Financial support and sponsorship
Nil.
Conflicts of interest
There are no conflicts of interest.
References
- Sadoul K, Boyault C, Pabion M, Khochbin S. Regulation of protein turnover by acetyltransferases and deacetylases. Biochimie 2008;90:306-12.
- L-lysine. Monograph. Altern Med Rev 2007;12:169-72.
- Hlais S, Reslan DR, Sarieddine HK, Nasreddine L, Taan G, Azar S, et al. Effect of lysine, vitamin B(6), and carnitine supplementation on the lipid profile of male patients with hypertriglyceridemia: A 12-week, open-label, randomized, placebo-controlled trial. Clin Ther 2012;34:1674-82.
- Kerner J, Hoppel C. Fatty acid import into mitochondria. Biochim Biophys Acta 2000;1486:1-17.
- Barnett C, Costill DL, Vukovich MD, Cole KJ, Goodpaster BH, Trappe SW, et al. Effect of L-carnitine supplementation on muscle and blood carnitine content and lactate accumulation during high-intensity sprint cycling. Int J Sport Nutr 1994;4:280-8.
- Volek JS, Kraemer WJ, Rubin MR, Gómez AL, Ratamess NA, Gaynor P. L-Carnitine L-tartrate supplementation favorably affects markers of recovery from exercise stress. Am J Physiol Endocrinol Metab 2002;282:E474-82.
- Kraemer WJ, Volek JS, French DN, Rubin MR, Sharman MJ, Gómez AL, et al. The effects of L-carnitine L-tartrate supplementation on hormonal responses to resistance exercise and recovery. J Strength Cond Res 2003;17:455-62.
- Lizeng W, Chengsong M, Xiaoli Z, Zengqin X. Determination of lysine in nutrition sample by adsorption voltammetry. Anal Lett 1994;27:613-23.
- Eva V, McDonald CE, Gilles KA. Determination of lysine on the automated amino acid analyzer by a triplicate- sample method. Cereal Chem 1968;45:432-6.
- Carolina BS, Jaime LC, Dalia IS, Olga N, Campas B. HPLC determination of histamine, tyramine and amino acids in shrimp by-products. J Braz Chem Soc 2012;23:96-102.
- Armstrong M, Jonscher K, Reisdorph NA. Analysis of 25 underivatized amino acids in human plasma using ion-pairing reversed-phase liquid chromatography/time-of-flight mass spectrometry. Rapid Commun Mass Spectrom 2007;21:2717-26.
- Fontaine J, Eudaimon M, Fontaine J, Eudaimon M. Liquid chromatographic determination of lysine, methionine, and threonine in pure amino acids (feed grade) and premixes: Collaborative study. J AOAC Int 2000;83:771-83.
- Gokulakumar B, Narayanaswamy R. High performance liquid chromatography for the estimation and detection of amino acids in root rot disease in sesame. Adv Biol Res 2009;3:162-7.
- Vogt C, Kiessig S. Separation of d/l-carnitine enatiomers by capillary electrophoresis. J Chromatogr A 1996;745:53-60.
- He GX, Dahl T. Improved high-performance liquid chromatographic method for analysis of L-carnitine in pharmaceutical formulations. J Pharm Biomed Anal 2000;23:315-21.
- Vernez L, Hopfgartner G, Wenk M, Krähenbühl S. Determination of carnitine and acylcarnitines in urine by high-performance liquid chromatography-electrospray ionization ion trap tandem mass spectrometry. J Chromatogr A 2003;984:203-13.
- McEntyre CJ, Lever M, Storer MK. A high performance liquid chromatographic method for the measurement of total carnitine in human plasma and urine. Clin Chim Acta 2004;344:123-30.
- Laura SH, Maria CP, Carmen GR, Antonio LC, Maria LM. Determination of L-and D carnitine in dietary food supplements using capillary electrophoresis tandem mass spectrometry. Food Chem 2010;120:921-8.
- Jane CN, James NM. Statistics and Chemometrics for Analytical Chemistry. Gosport: Ashford Colour Press Ltd.; 2010. p. 124-7.


