- *Corresponding Author:
- A. Singh
R. V. Northland Institute, Dadri, Gautam Budh Nagar-203 207, India
E-mail: amit21may@rediffmail.com
| Date of Submission | 16 July 2014 |
| Date of Revision | 03 February 2015 |
| Date of Acceptance | 18 September 2015 |
| Indian J Pharm Sci 2015;77(5):586-591 |
This is an open access article distributed under the terms of the Creative Commons Attribution-NonCommercial-ShareAlike 3.0 License, which allows others to remix, tweak, and build upon the work non-commercially, as long as the author is credited and the new creations are licensed under the identical terms.
Abstract
In the present work new, simple reversed-phase high performance liquid chromatographic method was developed and validated for the determination of hydroxychloroquine sulphate in blood plasma. Chloroquine sulphate was used as an internal standard. The chromatographic separation was achieved with octadecyl silane Hypersil C18 column (250×6 mm, 5 μm) using water and organic (acetonitrile:methanol: 50:50, v/v) mobile phase in 75:25 v/v ratio, with sodium 1-pentanesulfonate and phosphoric acid. This organic phase was maintained at pH 3.0 by orthophosphoric acid. The flow rate of 2.0 ml/min. with detection at 343 nm was used in the analysis. The calibration curve of standard hydroxychloroquine sulphate was linear in range 0.1-20.0 μg/ml. The method was validated with respected to linearity, range, precision, accuracy, specificity and robustness studies according to ICH guidelines. The method was found to be accurate and robust to analyze the hydroxychloroquine sulphate in plasma samples.
Keywords
Hydroxychloroquine sulphate, chloroquine sulphate, ICH guidelines, antimalarial agent, rheumatoid arthritis
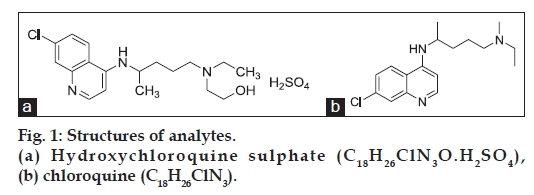
Hydroxychloroquine sulphate (HCQ) was first synthesized in 1946 by the addition of the hydroxy group to the parent compound, chloroquine (CQ), in an effort to reduce toxicity (fig. 1a). Chloroquine was found to be 2-3 fold more toxic than HCQ in experimental animal studies [1] (fig. 1b). HCQ was one of a large series of 4-aminoquinolines with antimalarial activity. It has been used in malaria therapy since 1955 as an alternative to or in combination with CQ, which only differs slightly in structure from. Although HCQ was developed primarily as an antimalarial agent, it possesses several other pharmacological properties as well. Its antiinflammatory properties were well known and it has been useful in the treatment of rheumatoid arthritis and in systemic lupus erythematosus. Its applicability in the treatment of photo-allergic reactions was also established [2]. Literature survey has revealed some methods for analysis of HCQ in biological and nonbiological fluid of different pharmaceutical formulations, such as HPLC with mass detector [3], HPLC with UV variable wavelength detector [4-11], HPLC with fluorescence detector [12-13] and electrochemical [14] detection. Here proposed method was fulfilled the requirements of HCQ estimation in biological samples by utilizing manual injector with nonvariable wavelength detector type (VWD). So present method is better in terms of internal standard usage, peak elution and retention time.
Materials and Methods
HCQ was obtained from K.P.S. Clinical Services, Greater Noida, India as a kind gift sample; HPLC water, methanol and acetonitrile were purchased from Fisher Scientific (Qualigens) and RFCL, New Delhi, India. Sodium 1-pentanesulfonate of HPLC grade was purchased from Glaxo, India Pvt. Ltd. Mumbai, India. The other chemicals were used of analytical grade. The filters with pore size of 0.22 μm were purchased from Pall Life Sciences, Mumbai, India that was used for filtration of mobile phase and sample solutions.
Optimization of procedure
Under the different experimental condition the method was optimized for their different mobile phase solvent ratio, column temperature, flow rate and pH of inorganic mobile phase. Reverse phase HPLC determinations were performed with Agilent technologies (Model-1120, Compact, G4288A-gradient) having gradient low pressure binary pump, consisting of vacuum in built degasser unit, with VWD, equipped with a manual injector system of 50 μl loop. Detection accomplished with a UV detector at 343 nm. Integration and system parameters were controlled by “Ezchrom Elite” compact, software 3.0.1 system. Chromatographic analysis was carried out at 30° on a C-18 column Inertsil® ODS-3 (250×6 mm, 5 μm, GL Sciences Inc. USA) column. The separation was achieved by isocratic elution with a flow rate 2.0 ml/min. The mobile phase was made by inorganic water, and organic (acetonitrile:methanol: 50:50, v/v) with ratio of 75:25, v/v with sodium 1-pentanesulfonate (96 mg/1000 ml of mobile phase). The pH 3.0 of inorganic phase was adjusted with dilute orthophosphoric acid and sodium hydroxide solution.
Preparation of standard
The drug HCQ and internal standard CQ stock solutions of 100 μg/ml were prepared by dissolving 10 mg of each in 100 ml of volumetric flasks separately with distilled water. This was further diluted by pH 1.5 of HCl acid. These stock solutions were stored in the refrigerator for further use. The working solution of HCQ was prepared from stock solution by serial dilutions, as 0.1, 0.2, 0.5, 1.0, 2.0, 5.0, 10.0, 15.0 and 20.0 μg/ml, then internal solution was further added 1 ml to each serial dilutions of HCQ. Calibration standards were prepared by adding 400 μl plasma, 0.1 ml CQ equivalent to 100 μg/ml and standard dilutions equivalent to 0.1-20.0 μg/ml, respectively.
Preparation and extraction of plasma sample
Blood samples were collected from each group of animal and treated for protein free plasma. This blood sample was collected in EDTA tube that was centrifuged to 3000 rpm at 4° for 10 min. Supernatant plasma was collected and stored at –20° for further study. In the way of plasma treatment to before insert in to HPLC, 400 μl plasma was mixed with 100 μl of CQ solution as internal standard solution. This mixture was again added with 100 μl, 1 M ammonium solution, and 5 ml diethyl ether. Resulted mixture was vortexed for 5 min. After vortexing it was centrifuged at 3000 rpm for 10 min. The supernatant phase of was collected and evaporated at 50° in orbital shaker water bath. Dried residue was dissolved with 5 ml of mobile phase.
The in vivo study on animal was based on “Breeding of and Experiments on Animals (Control and Supervision) Rules 1998” as amended by Government of India, Ministry of Environment and Forests (CPCSEA), with permission number 1149/PO/ac/07/ CPCSEA by local ethical committee.
Linearity and range
The method was validated as per the ICH guidelines [15]. Linearity was determined by constructing the calibration curve. For the construction of curve, eight standard dilutions of HCQ in range of 0.1-20.0 μg/ml (0.1, 0.2, 0.5, 1.0, 2.0, 5.0, 10.0, 15.0 and 20.0 μg/ml) were prepared in diluted hydrochloric acid (pH-1.5). Before the injection of the sample, the column was equilibrated for 20 min with mobile phase. The ratio of peak area of drug and internal standard against the respective standard concentrations was used for plotting of graph and the linearity was evaluated by least squares regression analysis.
Precision
The precision of the method was determined by repeatability and recovery at 80, 100 and 120%, respectively. The repeatability was examined by injecting six samples of the same concentration on the same day. Under same experimental conditions recovery was studied for the samples 4 μg/ml (80%), 5 μg/ml (100%) and 6 μg/ml (120%).
Accuracy (by standard addition method) and stability study
To study reliability and suitability of developed method, accuracy was determined. The accuracy of the method was evaluated by percentage recovery of added standard drug solutions 2, 3 and 4 μg/ml to fixed (5 μg/ml) concentration of sample to get finally 7, 8 and 9 μg/ml. All solutions were prepared in triplicate (n=3) and analyzed for percentage recoveries. The above drug concentrations were also analyzed for stability study of the method as intraday and interday accuracy.
Specificity (selectivity)
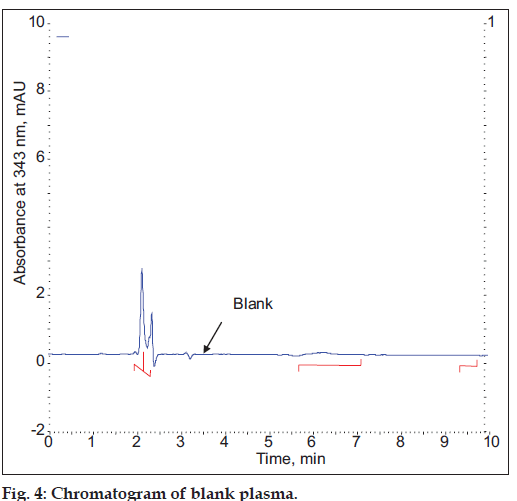
Blank plasma samples obtained from collected plasma, which were collected under controlled conditions were subjected to the preparation procedure described above and evaluated to determine the extent to which endogenous plasma components may interfere with the chromatograph determinates of HCQ and CQ levels.
Sensitivity
The lower limit of detection (LOD) and lower limit of quantification (LOQ) was based on standard deviation of response and the slope of the calibration curve. The estimation of standard deviation of the response was by calculating the standard deviation of y-intercept of regression line and the slope was estimated from the calibration curve.
Robustness
The robustness of an analytical procedure refers to its ability to remain unaffected by small and deliberate variations in method parameters and provides an indication of its reliability for the routine analysis. The robustness was determined by analyzing the same samples under a variety of conditions of the method parameters, such as flow rate, mobile phase ratio, column temperature and pH of mobile phase.
Pharmacokinetic analysis
The following pharmacokinetical values were determined on basis of one week (w) study i.e. for the period of one week, maximum plasma drug concentration (Cmax, μg/l), time to reach maximum plasma drug concentration (Tmax, h), half life of the drug (T1/2, h), area under the curve from time 0 to t ( AUC0-t, μg-h/l), area under the curve from time 0 to ∞ (AUC0-∞, μg-h/l), volume of distribution (Vd, L), total body clearance (CLT, l/h) and elimination rate constant (K, h−1).
Results and Discussion
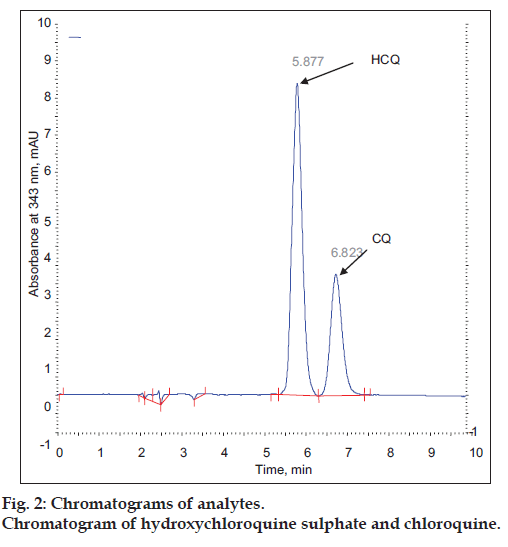
Under the different analytical condition described earlier it was found 75:25 (v/v) ratio of inorganic and organic solvent (pH-3.0) with 30° at 2.0 ml/min flow rate gives, well separated and good shape peak of HCQ and CQ (fig. 2). The representative chromatograms of drug, internal standard and spiked plasma, showed no interference between them. The retention time of HCQ and CQ were 5.87 and 6.82 min, respectively i.e. total running time was less than 7 min.
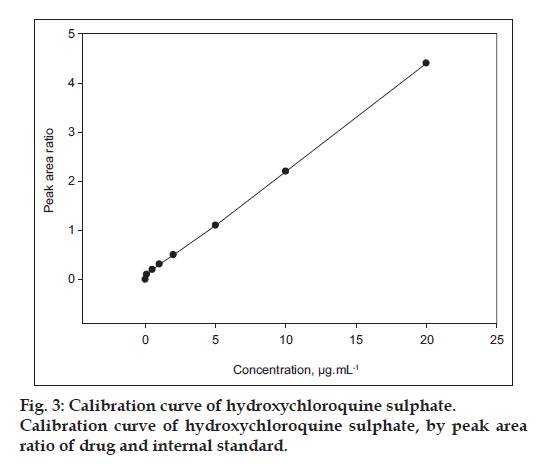
The linearity ratio of peak areas verses different concentration was evaluated for HCQ and CQ. The regression data was presented in Table 1. The regression line was linear within 0.1-20.0 μg/ml of range that showed good regression coefficient (r2) value, with regression intercept not significant different from 0.1. Regression coefficient was demonstrated for the evaluation of goodness fit. The found regression coefficient was 0.9991 which was good (fig. 3). In addition to the range of known concentration recovery, it was found more than 95% (4, 5, and 6 μg/ml, Table 2).
| Parameters | Results |
|---|---|
| Linearity, (µg/ml) | 0.1–20.0 |
| Regression equation | Y=1541633.5808X+657414.8711 |
| Regression coefficient, (r)2 | 0.9991 |
| 95% CI for slope | <0.0001 |
| 95% CI for intercept | <0.0001 |
| Standard error of line | 130,227.81 |
| Standard error of slope | 14,984.53 |
| Standard error of estimate | 323,235.64 |
| LOD, (µg/ml) | 0.24 |
| LOQ, (µg/ml) | 0.84 |
Table 1: Characterization of linear Regression analysis
| Sample concentration, (µg/ml) (%) | Results | ||
|---|---|---|---|
| Mean recovery (%)† | % RSD | ||
| 4 | (80) | 98.45 | 0.35 |
| 5 | (100) | 98.09 | 0.07 |
| 6 | (120) | 97.47 | 0.69 |
Table 2: Precision Determination Of The Drug
The precision of the analytical method was evaluated in terms of repeatability. Repeatability (intra-day precision) was assessed by injecting the six replicate injections at 100% test concentration (5 μg/ml of HCQ). The %RSD values of the results corresponding to the peak areas were found to be 0.97 (Table 3), revealed high system precision. The mean percentage recovery of standard drug at 80, 100 and 120% of specific concentration were found to be satisfactorily high (Table 2).
| Parameters | Results |
|---|---|
| System precision, (% RSD) | 0.97 |
| Retention time of HCQ, (min) | 5.87 |
| Retention time of CQ, (min) | 6.82 |
| Peak width, (min) | 0.64 |
| Peak width, USP | 0.32 |
| Asymmetry/tailing factor | 1.48 |
| Plates/meter, USP | 23,841.31 |
Table 3: System Suitability Parameters
The accuracy of the proposed method by standard addition method was determined as mean recovered concentration. For this %RSD was found to be less than one in intraday recovery (Table 4), which reveals high accuracy of the method. High recovery percentage (>99%) was also found in interday recovery study indicates the stability of the method (Table 4).
| Sample concentration (µg/ml) | Added concentration (µg/ml) | Final concentration µg/ml | Assay (Intraday) | Assay (Interday) | |||||
|---|---|---|---|---|---|---|---|---|---|
| †Mean concentration (µg/ml±SD) | Percentage concentration | Percentage RSD | †Mean concentration (µg/ml±SD) | Percentage concentration | Percentage RSD | ||||
| 5 | 2 | 7 | 6.98±0.04 | 99.28 | 0.67 | 6.97±0.05 | 99.00 | 0.73 | |
| 5 | 3 | 8 | 7.98±0.01 | 99.75 | 0.09 | 7.97±0.01 | 99.62 | 0.09 | |
| 5 | 4 | 9 | 8.99±0.01 | 99.88 | 0.08 | 8.97±0.01 | 99.66 | 0.10 | |
Table 4: Accuracy (Intraday) And Stability Study At Interday
The specificity of the proposed method was illustrated, where complete separation of HCQ peak along with CQ were stated in figs. 2 and 4, where no endogenous substances were found interfered with peak. The average retention time for HCQ and CQ were found to be 5.87 and 6.82 min, respectively with sharp and good shape.
The LOD was found to be 0.24 μg/ml where lower limit of quantification (LOQ) was found to be 0.84 μg/ml with injection volume 50 μl. The lower values of LOD and LOQ with high precision prove good sensitivity.
During variance in some parameters of method it was found that there was no statistically significant difference in results (Table 5). The results obtained were within the acceptable limit and it was observed there was no marked changed in retention time. The change in USP theoretical plates of the chromatograms was found less than 2% of RSD proves robustness of method.
| Variable parameter | Non variable parameters | Changes investigated to variable | Theoretical plates, USP, (n=3) | Retention time,min, (n=3) |
|---|---|---|---|---|
| Flow rate (µg/ml) | pH, temperature, wave length, mobile phase ratio | 1.8 | 1300.50 | 7.68 |
| 2.0† | 1101.50 | 6.94 | ||
| 2.2 | 1340.50 | 6.25 | ||
| pH | Flow rate, temperature, mobile phase ratio, wave length | 2.8 | 2097.50 | 6.44 |
| 3.0† | 1101.50 | 6.94 | ||
| 3.2 | 7873.50 | 6.00 | ||
| Mobile phase | pH, flow rate, temperature, wave?length | 74.5:25.5 | 2097.50 | 5.69 |
| ratio, (% v/v) | 75:25† | 1101.50 | 6.94 | |
| 75.5:24.5 | 2002.00 | 5.69 | ||
| Temperature (°C) | pH, flow rate, mobile phase ratio, wave?length | 25 | 1175.00 | 6.93 |
| 30† | 1101.50 | 6.94 | ||
| 35 | 1487.00 | 6.21 | ||
| Wave length (nm) | pH, flow rate, mobile phase ratio, temperature | 341 | 1583.00 | 6.63 |
| 343† | 1101.50 | 6.94 | ||
| 345 | 1868.50 | 5.66 |
Table 5: Chromatographic Conditions And Range Investigated During Robustness Testing
After single intravenous bolus administration of drug the mean values of different pharmacokinetical parameters were calculated (Table 6). The calculated AUC was more as compared to given i.v. dose, so this difference proves the nonlinear pharmacokinetic.
| Pharmacokinetical parameters | Results±SD |
|---|---|
| Cmax, (µg/ml) | 20,533.00±122.21 |
| Tmax, (h) | 12.00±0.52 |
| T1/2, (h) | 138.00±33.70 |
| AUC0?t, (µg?h/l) | 970,197.00±16,782.11 |
| AUC0?∞, (µg?h/l) | 2,100,197.00±26,876.23 |
| Vd, (l) | 1.097 |
| CLT, (l/h) | 0.027 |
| K, (h−1) | 0.005 |
Table 6: Pharmacokinetical parameters after i.v. Bolus drug administration
To conclude the current validated HPLC RP-HPLC method for HCQ offers good accuracy and significant advantages in terms of sensitivity, selectivity and sample preparation, though it can be used for the estimation of HCQ in the bio-fluids. The developed separation method produces acceptable values of recovery. The chromatogram developed has well resolved peak of HCQ without any interference. From the results we conclude that the developed method can be applied in pharmacokinetic, bioequivalence and toxicokinetics studies with desired precision and accuracy along with high throughout puts.
Acknowledgements
Authors are grateful to the authorities of R.V. Northland Institute, Dadri, Greater Noida, Uttar Pradesh, India, for providing necessary facilities to carry out the research work. The authors are also grateful to KPS Clinical Services Pvt. Ltd. Greater Noida, Uttar Pradesh for supplying standard HCQ and CQ as a kind gift to carry out this work.
Financial support and sponsorship
Nil.
Conflicts of interest
There are no conflicts of interest.
References
- Jordan P, Brookes JG, Nikolic G, Le Couteur DG. Hydroxychloroquine overdose: Toxicokinetics and management. J Toxicol Clin Toxicol 1999;37:861-4.
- Tonnesen HH, Grislingaas AL, Woo SO, Karlsen J. Phytochemical stability of antimalarialshydroxychloroquine. Int J Pharm 1988;43:215.
- Wang LZ, Ong RY, Chin TM, Thuya WL, Wan SC, Wong AL, et al.
- Method development and validation for rapid quantification of hydroxychloroquine in human blood using liquid chromatography-tandem mass spectrometry. J Pharm Biomed Anal 2012;61:86-92.
- Volin P. Simple and specific reversed-phase liquid chromatographic method with diode-array detection for simultaneous determination of serum hydroxychloroquine, chloroquine and some corticosteroids. J Chromatogr B Biomed Appl 1995;666:347-53.
- Croes K, McCarthy PT, Flanagan RJ. Simple and rapid HPLC of quinine, hydroxychloroquine, chloroquine, and desethylchloroquine in serum, whole blood, and filter paper-adsorbed dry blood. J Anal Toxicol1994;18:255-60.
- Tonnesen HH, Grislingaas AL, Woo SO, Karlsen J. Analytical andsemi-preparative high performance liquid chromatographic separation and assay of hydroxychloroquine enantiomers. Int J Phytoremediation 1988;43:215.
- Brocks DR, Pasutto FM, Jamali F. Pharmacokinetics of hydroxychloroquine and chloroquine during treatment of rheumatic diseases. J Chromatogr 1992;58:83.
- Iredale J, Wainer IW, Tett SE, Cutler DJ, Brown KF. Determination of the stereoisomers of hydroxychloroquine and its major metabolites in plasma and urine following a single oral administration of racemic hydroxychloroquine. J Chromatogr 1992;573:253.
- Brown RR, Stroshane RM, Benziger DP. High-performance liquid chromatographic assay for hydroxychloroquine and three of its major metabolites, desethylhydroxychloroquine, desethylchloroquine and bidesethylchloroquine, in human plasma. J Chromatogr 1986;377:454-9. 10. Morris RG. Estimation of plasma hydroxychloroquine by high-performance liquid chromatography with ultraviolet detection.JChromatogr 1985;338:422-7.
- Chaulet JF, Robet Y, Prevosto JM, Soares O, Brazier JL. Very small injected samples to study chloroquine and quinine in human serum using capillary-LC and native fluorescence. J Chromatogr 1993;613:303.
- Tett SE, Cutler DJ, Day RO, Brown KF. A dose-ranging study of the pharmacokinetics of hydroxy-chloroquine following intravenous administration to healthy volunteers. Br J ClinPharmacol 1988;26:303-13.
- Tett SE, Cutler DJ, Day RO, Brown KF. Bioavailability of hydroxychloroquine tablets in healthy volunteers. Br J ClinPharmacol 1989;27:771-9.
- Arguelho ML, Andrade JF, Stradiotto NR. Electrochemical study of hydroxychloroquine and its determination in plaquenil by differential pulse voltammetry. J Pharm Biomed Anal 2003;32:269-75.
- ICH/CPMP Guidelines Q2B. CPMP/ICH/281/95, Text on Validation of Analytical Procedures Methodology; 1996


