- *Corresponding Author:
- Li Li
Department of Hepatobiliary and Pancreatic Surgery, The Affiliated Calmette Hospital of Kunming Medical University and The First Hospital of Kunming, Kunming, Yunnan Province 650011, China
E-mail: kmlili557@163.com
| Date of Received | 04 December 2022 |
| Date of Revision | 15 October 2023 |
| Date of Acceptance | 22 March 2024 |
| Indian J Pharm Sci 2024;86(2):606-619 |
This is an open access article distributed under the terms of the Creative Commons Attribution-NonCommercial-ShareAlike 3.0 License, which allows others to remix, tweak, and build upon the work non-commercially, as long as the author is credited and the new creations are licensed under the identical terms
Abstract
To explore the activation effect and mechanism of exocrine secreted by HepG2.2.15 cells on hepatic stellate cells. The exosomes from HepG2.2.15 cell culture medium and HepG2 cell culture medium were co-cultured with hepatic stellate cells respectively. The activation of hepatic stellate cells after co-culture was detected by immunofluorescence, oil red staining, scratch test, transwell, EDU, cell counting kit-8, flow apoptosis and Western blotting. The microRNA and downstream pathways which may lead to the activation of hepatic stellate cells were extracted from HepG2.2.15 cell culture medium and HepG2 cell culture medium by exosome sequencing, which were verified by quantitative polymerase chain reaction and Western blotting. After coculture with hepatic stellate cells, exosomes secreted by HepG2.2.15 cells and exosomes secreted by HepG2 cells and hepatic stellate cells, the proliferation, migration and cell activity of hepatic stellate cells were enhanced. Quantitative polymerase chain reaction detection showed that the expression of microRNA1269a in exosomes secreted by HepG2.2.15 cells co-cultured with hepatic stellate cells and exosomes secreted by HepG2 cells increased compared with hepatic stellate cells co-cultured with hepatic stellate cells, while the expression of C-mesenchymal-epithelial transition factor in stromal epidermis decreased. The hepatic stellate cells of exosomes secreted by HepG2.2.15 cells co-cultured with hepatic stellate cells and exosomes secreted by HepG2 cells and hepatic stellate cells decreased while the Yes-associated protein increased compared with that of C-mesenchymal-epithelial transition factor and phosphorylated Yes-associated protein. The exocrine secreted by HepG2.2.15 cells promote the activation of hepatic stellate cells. The mechanism may be that the exocrine carrier microRNA-1269a secreted by HepG2.2.15 is down-regulated by hepatic stellate cells, which downregulates c-mesenchymal-epithelial transition factor messenger ribonucleic acid, resulting in the decrease of C-mesenchymal-epithelial transition factor receptors on the surface of hepatic stellate cells, resulting in the decrease of Yes-associated protein phosphorylation and promoting the proliferation and activation of hepatic stellate cells.
Keywords
HepG2.2.15 cell, hepatic stellate cell, microRNA-1269a, epidermal transforming factor, hepatocellular carcinoma
As we all know, Hepatitis B Virus (HBV) infects many human beings, especially in China, as there were hepatitis B carriers. Long-term hepatitis B infection is one of the main causes of liver fibrosis and cirrhosis. It can eventually lead to end-stage liver disease or Hepatocellular Carcinoma (HCC). HBV is a hepatophilic virus with strict specificity to human hepatocytes[1]. The target cells of HBV injury are hepatocytes, and hepatocytes are a kind of cells with strong ability of regeneration. So what causes hepatocytes to become fibrotic and cirrhotic after HBV infection? At present, it is generally believed that the main cause of liver fibrosis caused by hepatitis B is the immune response induced by hepatitis B infection, which leads to liver injury, induces macrophages to activate and secrete a large number of cytokines such as Transforming Growth Factor-Beta (TGF-β), and leads to epigenetic changes, which leads to the activation of Hepatic Stellate Cells (HSCs), and finally leads to liver fibrosis. Exosome-mediated intercellular communication plays an important role in disease progression[2]. Exocrine body is a kind of extracellular vesicles secreted by many kinds of cells. Exocrine bodies can be found in almost all body fluids. Exocrine bodies can be secreted by all types of cells under pathological or physiological conditions. It is reported that exosomes carry information substances, including non-coding Ribonucleic Acid (RNA), proteins and lipids, which can play a role in many liver diseases[3]. In previous studies, it has been confirmed that exosomes can mediate communication between other cells of the liver and HSCs, leading to liver fibrosis[4]. However, these studies mainly focus on Hepatitis C Virus (HCV), cholestatic liver injury, chemical and drug-induced liver injury and so on. There are few studies on hepatitis B liver fibrosis. In past studies, HepG2 (a kind of liver cancer cell) and HepG2.2.15 (HepG2 cell integrated with the whole genome of HBV) are often used in the study of hepatitis B related diseases. In this study, we compared HepG2.2.15 cells with HepG2 cells to confirm that the exosomes secreted by HepG2.2.15 can be absorbed by HSCs and activate HSCs and its mechanism.
Materials and Methods
Materials:
HepG2.2.15, HepG2, Hu-HSCs and LX2 cells were derived from the cell bank of the Chinese academy of sciences.
Instruments and reagents:
Bicinchoninic Acid (BCA) protein concentration determination kit Solarbio Co., Ltd., ultra-clean workbench purchased from Beijing Semiconductor equipment factory, TGL-16B desktop centrifuge purchased from Shanghai Anting Scientific instrument Factory, high-speed freezing centrifuge purchased from Changsha Kewei Industrial Co., Ltd., 80-2 electric centrifuge purchased from Shanghai Yuefeng instrument Co., Ltd., palm centrifuge purchased from Haimen Qilin Bell Company, high-speed freezing centrifuge purchased from thermo scientific company. The ultra-low temperature refrigerator at -80° was purchased from Sanya company, the ordinary optical microscope from Olympus company, the fluorescence microscope from Nikon company, the Exo-spin™ exosome purification kit from cell guidance systems company, the transmission electron microscope (HT-7700) from Hitachi company, the particle size analyzer (N30E) from NanoFCM company, the ultraviolet spectrophotometer from NanoDrop company, the electrophoresis instrument from Bio-rad company, and the Polyacrylamide Gel Electrophoresis (PAGE) gel rapid preparation kit from Ya enzyme company. The chemiluminescence substrate of hypersensitive Enhanced Chemiluminescence (ECL) was purchased from Genetex company, the IPVH00010 0.45 μm protein transport membrane was purchased from Millipore company, the rainbow prestaining protein Marke was purchased from Yazhi company, goat anti-rabbit Immunoglobulin G (IgG) antibody (Horseradish Peroxidase (HRP)) was purchased from Genetex company, and DIL (cell membrane red fluorescent probe) was purchased from Biyuntian company.
Oil red O staining kit (for cells) was purchased from Genetex Company, 4′,6-Diamidino-2- Phenylindole (DAPI) staining tablet sealing agent was purchased from Shanghai Shangbao Biological Company, anti-Alpha Smooth Muscle Actin (α-SMA) antibody was purchased from Abcom Company, anti-Clusters of Differentiation (CD)-9 antibody was purchased from Genetex Company, anti-CD63 antibody, anti-Cobalt I antibody, anti- Cobalt III antibody, anti-β-actin antibody and anti-Glyceraldehyde 3-Phosphate Dehydrogenase (GAPDH) antibody were purchased from Genetex company, Terminal deoxynucleotidyl Transferase (TdT) dUTP Nick-End Labeling (TUNEL) apoptosis detection kit was purchased from olarbio company, Annexin V-Fluorescein Isothiocyanate (FITC) apoptosis detection kit was purchased from Biyuntian Company, Cell Counting Kit-8 (CCK- 8) was purchased from BIOSS Company, and Transwell chamber was purchased from Corning Company.
Experimental method:
Cell culture: 1 ml cryopreserved cells were quickly reheated in a water bath at 37°, transferred to a 10 ml centrifuge tube at 1000 rpm/min, centrifuged 5 min, removed the supernatant, 1 ml Dulbecco's Modified Eagle Medium (DMEM) complete culture medium (containing 10 % Fetal Bovine Serum (FBS), 1 % penicillin streptomycin double antibody) was suspended, 2 ml DMEM complete medium wet culture bottle was first added to the T25 culture bottle, and the re-suspended cells were added to the T25 culture bottle. Put it in the incubator of 5 % Carbon dioxide (CO2) at 37°.
Cell exchange and passage: On the 2nd d, the cells were adhered to the wall, and the culture medium was removed and washed twice with Phosphate Buffer Solution (PBS). DMEM complete medium 3 ml was added and cultured in the incubator of 5 % CO2 at 37°. The cell status was observed every day and the fluid was changed once in 2-3 d. When the cells grow to about 80 % of the bottom of the culture bottle, the cells will be passed on. Suck out the culture medium and wash it twice with PBS. The cells were digested with 2 ml trypsin and put into the incubator of 5 % CO2 at 37°. Under the microscope, the pseudopodia protruding from the cells disappeared, and the cells became round and floated. Add 2 ml and the same volume of DMEM complete medium (containing 10 % FBS, 1 % penicillin streptomycin double antibody) to terminate digestion. Suck out the liquid from the culture bottle and transfer it to the 10 ml centrifuge tube at 1000 rpm/min, and centrifuge 5 min. The white precipitation at the bottom of the centrifuge tube can be seen. 1 ml DMEM complete medium (containing 10 % FBS, 1 % penicillin streptomycin double antibody) was suspended. Suck out 50 μl and drop 10 μl into the counting board to count, about 4×10⁵/ml. DMEM complete medium 8 ml wet T75 culture flask, re-suspended cells were divided into two parts of 500 μl, respectively, added to a T75 culture flask. Put it in the incubator of 5 % CO2 at 37°. When the cells grow to about 80 % of the bottom of the culture bottle, the cells will be passed on. Passaged step by step until 10 T75 culture bottles reached 80 % of the effect, the total number of cells reached about 1×10⁷/ml, the total cell culture medium reached 80 ml, and the exocrine body could be lifted.
Extraction and identification of exosomes: Use Exo-spin™ exocrine purification kit to extract and operate strictly according to the instructions. Under transmission electron microscope, 10 μl of exocrine was removed. The 1 min was precipitated on the copper net, and the floating liquid was absorbed by filter paper. 10 μl of uranyl acetate was added to the copper net to precipitate 1 min, and the filter paper was used to absorb the floating liquid. Dry at room temperature for 5 min. 100 kv was examined by electron microscope. The imaging results of transmission electron microscope were obtained. The exosome was diluted from 10 μl to 30 μl. The exocrine sample cannot be sampled until the instrument performance test is qualified with the standard sample, and attention should be paid to the gradient dilution to prevent the sample from clogging the injection needle. The particle size and concentration information of the exosome detected by the instrument can be obtained when the sample is tested.
Western blotting:
Exosomal protein extraction: The exosomes of the three groups A-HepG2.2.15-EXO, B-HepG2-EXO, and C-WRL68-EXO were each taken 50 μl and added to 20 μl cell lysate (Radioimmunoprecipitation Assay (RIPA):Phenylmethylsulfonyl Fluoride (PMSF)=100:1) for shock, placed on an ice plate for 10 min, 12 000 ×g, centrifuged at 4° for 10 min, and supernatant was obtained. Total exosomal protein was obtained.
Quantity of exocrine protein: Determination of BCA protein concentration kit, configuration of working liquid BCA reagent 100 μl, 4900 μl (50:1). Diluted the standard sample, the total proteins extracted from the three groups were diluted 10-fold with 20, 200 μl, each of which was diluted 10 times. The cleaved protein 50 μl of each group was added to Sodium Dodecyl Sulfate- PAGE (SDS-PAGE) protein buffer (5×) according to 4:1, and boiled for 5 min at 20°. Separate glue and concentrated glue were prepared according to the formula. Before adding the sample, the sample gun was the protein sample prepared by mark 6 μl, HepG2.2.15-EXO, HepG2.-EXO, WRL68- EXO, 90 V constant voltage electrophoresis, wait for bromophenol blue to separate gel, adjust the voltage to 120 V, and stop when bromophenol blue ran to the bottom of the glass plate. Turn the film (wet turn), end the electrophoresis and cut off the separation glue. Cut out properly and soak in methanol to activate 2 min. The film transfer clip was infiltrated with electroporation liquid in advance, and the black glue white film was placed. Put the transfer film clip into the transfer film frame, put into the ice box to cool down, fill it with 1× electric transfer buffer in advance, cover the top, and finally put the whole film transfer slot into the basin filled with ice, and begin to turn the film. Constant current 400 mA was used for 60 min. After the end of the film transfer, take out the Polyvinylidene Fluoride (PVDF) film, cut the angle mark, put into the sealing solution, at room temperature for 60 min. In antibody incubation, use 5 % skimmed milk powder to prepare an antibody according to the antibody instruction (CD9, CD63, CD81 according to 1:1000) and put it into the antibody incubator at 4° overnight. Wash with 1× PBS with Tween® Detergent (PBST) shaker for 3 times and 10 min/3 times. In second antibody incubation, using 5 % skimmed milk powder to prepare secondary antibody (12 000) according to the instructions, and the antibody incubator incubated 60 min at room temperature. Wash with 1× PBST for 3 times and 10 min/3 times. Use ECL hypersensitive photoluminescence solution, automatic Western blotting exposure instrument for exposure; select the appropriate exposure time to save the picture. In result analysis, quantitative analysis of band gray level was done by Gel-Pro Analyzer 4.0.
Exocrine body uptake experiment: 10 mg was dissolved by adding 10.7 ml PBS, and then cryopreserved after repackaging. Each 2 μg exosome was incubated with 20 min at DiI 2 μl, 37°, and then the exosome was added to the top of the purification injection kit of exocrine extraction kit, centrifuged at 50 ×g for 60 s, and the eluate was discarded. The purification column was placed into a new 1.5 ml micro centrifuge tube to harvest the exocrine, and 200 μl of PBS was added to the top of the purification column. Centrifuge at 50 ×g for 60 s; after centrifugation, about 20 μl of the eluate is the exocrine after DiI staining. In experimental grouping; 24-hole plate, 12 holes were selected, and each hole was covered with circular cover slides, which were divided into four groups A, B, C and D with 3 holes in each group. In group A and B, 1×103 LX2 cells were cultured in 1640 complete medium per well and 500 μl was cultured in each well for 6 h. It can be seen that the cells completely adhere to the wall and change the fluid. Group A was treated with HepG2.2.15-EXO 2 μg stained by DiI and group B with HepG2- EXO 2 μg stained by DiI, which was co-cultured in incubator for 12 h. In group C and D, 1×10³ Hu-HSCs cells were cultured in 1640 complete medium per well and 500 μl was cultured in each well for 6 h. It can be seen that the cells completely adhere to the wall and change the fluid. Group C was treated with HepG2.2.15-EXO 2 μg dyed by DiI and group D with HepG2-EXO 2 μg stained by DiI and co-cultured in incubator for 12 h. Remove the culture medium and wash it twice with PBS, add 4 % paraformaldehyde per pore 500 μl, fixed 15 min and wash with PBS twice. 0.5 % Triton® X 100 μl was added to each hole to incubate 20 min and wash it 3 times with TBST.
Cell staining: In group A and B, a drop of DAPI sealant was dropped in the center of the slide and covered with a cover slide affixed with cells, so that the cells came into contact with the sealing solution. It was observed by positive fluorescence microscope. In group C and D, 5 % skim milk 500 μl dissolved by TBST was added to each hole and sealed for 1 h. The first anti-α-SMA was prepared with 5 % skim milk TBST according to 1-1.2 ml, 100 and 200 μl was added to each hole and incubated overnight at 4°. Absorb the first antibody, wash it with TBST for 5 times, add the second antibody (sheep anti-rabbit, with immune green light) according to 1-1.2 ml with 5 % skim milk TBST to form 1.2 ml, add 200 μl to each hole, incubate 45 min at room temperature. Suck up the second antibody. Wash it with TBST for 5 times. Drop a drop of DAPI sealing agent in the center of the slide, cover the cover slide with the cell, and let the cell come into contact with the sealing solution. And observe with positive fluorescence microscope.
Exocrine and HSCs co-culture: Divided into 3 groups, HepG2.2.15-EXO group, HepG2-EXO, Hu-HSCs blank control group. 6-well plate, 12 holes in each group, 1×10⁵ Hu-HSCs cells were added to each well, and pure 1640 culture medium+1 % FBS 500 μl was added. The cells adhered to the wall after 6 h. Change medium, 1640 complete culture medium of 500 μl per well (+10 % FBS). Group A, group B, and group C, which were added with HepG2.2.15-EXO 2 μg Magol, served as Hu-HSCs blank control. Put it in the incubator and co-culture for 24 h. HepG2.2.15-EXO group, HepG2-EXO, and Hu-HSCs blank control. After digestion, make a cell suspension, and add 1×10³ cells per well into 1640 complete culture medium (pure 1640 culture medium+10 % FBS). The cells will adhere to the wall after 6 h. Use solarbio oil red staining solution (special for cells) for oil red staining, remove cell culture medium, wash with PBS twice, add red O fixation solution, 200 μl per well, fix 30 min. Discard the fixed liquid and wash it twice with distilled water. Add 60 % isopropanol to wash 5 min. After absorbing 60 % isopropanol, the newly prepared oil red O staining solution (B1- Oil red O dyeing A solution:B2-Oil red O dyeing B solution 3:2 static 10 min) was added to each well, and 20 min was stained. Remove the dye and wash it 3 times until there is no excess dye. Mayer hematoxylin staining solution was added and restained for 2 min. Wash 5 times after discarding the dye. Add oil red O buffer 1 min and remove. Add distilled water to cover the cells and observe them under microscope.
EDU: HepG2.2.15-EXO group and the control group were treated with BJHG_2, EXO_2, C_ RHSCs and HSCs. 6-hole plate, 3 holes in each group. The cells in each group were co-cultured with exocrine. After digestion, the cell suspension was made. 1640 complete medium (pure 1640 medium+1 % FBS) was added to 1×10³ cells per well, and the cells adhered 6 h later. Change to 1640 complete medium (pure 1640 culture 2000 μl per well) and continue to culture for 24 h. EDU working solution was configured according to 1RU 500, 9 holes per well 1000 μl, a total of 9000 μl (1640 complete medium+10 % FBS) and 18 μl EDU working solution. 2× EDU working solution was prepared. 1000 μl medium was sucked out from each of the 6-well plates, and the 2× EDU working solution just prepared by 1000 μl was supplemented by each and incubates for 2 h. The culture medium was removed, and 1 ml of 4 % paraformaldehyde was added to each well to fix for 15 min. Bisphenol S (BPS) washed for 3 times. The detergent was removed and each hole was incubated with 1 ml permeable solution containing 0.3 % Triton X-100 at room temperature for 15 min. BPS washed for 3 times. 6-hole plate with a total of 3 ml, 1.3 ml reaction buffer 2580 μl, Copper (II) sulfate (CuSO4) 120 μl, Azide 4886 (1.3 ml deionized water dissolving a tube of click additive) 300 μl to form click reaction solution. 350 μl per hole, incubate 30 min without light. Absorb the click reaction solution and wash it with PBS for 3 times. 3 ml of Hoechst 33342 was diluted with PBS and added to Hoechst 33423 according to the proportion of 1RU 1000. Hoechst 33342 350 μl was added to each hole to avoid light to incubate 10 min. Wash with PBS for 3 times. It was observed by inverted fluorescence microscope.
Wound healing assay: A-HepG2.2.15-EXO group, B-HepG2-EXO, and C-Hu-HSCs blank control. The 6-hole plate, 3 holes in each group, the hole plate is first placed behind the 6-hole plate with a marker pen, compared with a ruler, and a uniform horizontal line is drawn, about every 0.5~1 cm, across the hole. Each hole passes through at least five lines. The cells in each group were co-cultured with exocrine. After digestion, the cell suspension was made. 1×10⁵ cells per well were added to 1640 medium (pure 1640 medium+1 % FBS) for 6 h. Change to 1640 complete medium (pure 1640 medium+10 % FBS) 2000 μl per well and continue to culture. Use the head of the gun to compare the ruler, as far as possible to the back of the horizontal scratches, the head of the gun should be vertical, not tilted. Wash the cells with PBS for 3 times, remove the cut cells, add 1640 complete medium (pure 1640 medium+10 % FBS) per well 2000 μl, put into the incubator to continue culture. Recording and taking photos at 0 h, 12 h, 24 h, and 36 h. Use ImageJ software to open the picture, calculate and observe the area between cells.
Transwell assay: A-HepG2.2.15-EXO, B-HepG2- EXO, and C-Hu-HSCs blank control group. Coat the upper surface of the bottom membrane of the Transwell chamber with 50 mg/l Matrigel 1:8 dilution and air-dry at 4°. Hydrate the basement membrane by aspirating the remaining liquid in the culture plate, add 50 μl of serum-free culture medium containing 10 g/l Bovine Serum Albumin (BSA) to each well, and incubate at 37° for 30 min. Prepare cell suspension from each group of cells previously co-cultured with exocytosis, add 1640 culture medium (pure 1640 culture medium+1 % FBS) to adjust the cell concentration to 200 μl containing 1×10⁵ Hu-HSCs. Take 200 μl of cell suspension from each group and add it to the Transwell chamber. Add 500 μl of 1640 culture medium containing 10 % FBS to the lower chamber of the 24-well plate. Place the Transwell chamber into the lower culture medium of the lower 24- well plate, being careful not to allow air bubbles to appear. Place in the incubator for 48 h. Take out the Transwell chamber. Remove the culture medium from the lower well and wash twice with PBS. 100 μl 4 % paraformaldehyde fixed for 15 min. Wash 3 times with BPS. Remove the washing liquid. Stain with 0.1 % crystal violet for 20 min and wash with BPS 3 times. Observe and count under a microscope.
CCK-8: A-HepG2.2.15-EXO, B-HepG2-EXO, and C-Hu-HSCs blank control group. After coculture with exocrine, the cells of each group were prepared and inoculated into 96-well cell culture plate according to the density of 1×10⁴/ml. 100 μl (including 1×10³) was inoculated into each well with 3 holes in each group. The cells were cultured in 37° and 5 % CO2 cell incubator. The cells in each group were completely adhered to the wall 24 h after inoculation, the culture medium was sucked out from the 96-well plate, PBS was washed once, and then the complete medium was added. 10 μl of CCK-8 reagent was added to each group of cells and incubated in a 5 % CO2 cell incubator at 37° for 2 h. Finally, the absorbance (Optical Density (OD)) of each well at 450 nm wavelength was detected by enzyme labeling instrument, and the cell survival rate of each group was calculated. The formula for calculating cell survival rate is as follows:
Cell survival rate=(OD experimental group-OD zeroing group)/(OD control group-OD zeroing group)
Flow apoptotic experiment: Cell suspension was prepared from the cells of each group after coculture with exoides, with 3 samples in each group. Cell count in each group was 1×10⁵/ml. Wash twice with PBS. Add 100 μl binding buffer and FITC labeled Annexin-V (20 μg/ml) 10 μl, avoid light at room temperature for 30 min, then add Propidium Iodide (PI) (50 μg/ml) 5 μl, after 5 min, add 400 μl binding buffer, immediately use FACScan™ for flow cytometry quantitative detection (usually not more than 1 h), and use a tube without AnnexinVFITC and PI as negative control.
Statistical method:
GraphPad Prism 9.1.2 software was used for analysis, and the results were expressed as mean±standard deviation (x±s). T-test was used for comparison between the two groups, and multivariate analysis of variance was used for comparison between groups.
Results and Discussion
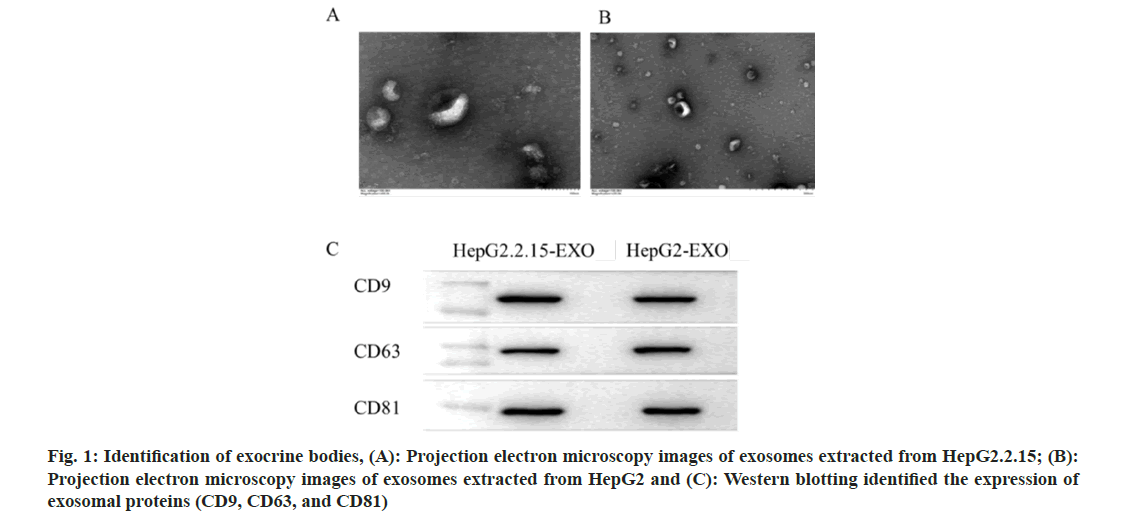
The concentration and particle size of the exocrine body is consistent with the diameter of the exocrine body (Table 1). Under transmission electron microscope, the exocrine body showed a double-layer capsule structure, which was teashaped or hemispherical with depression on one side, as shown in fig. 1A and fig. 1B. All exocrine proteins (CD9, CD63, and CD81) were identified by Western blotting (fig. 1C).
| Sample | Average diameter (nm) | Concentration (particles/ml) |
|---|---|---|
| HepG2.2.25-EXO | 79.32 | 2.01×10¹⁰ |
| HepG2-EXO | 82.47 | 1.93×10¹⁰ |
Table 1: Average diameter and concentration of exocrine
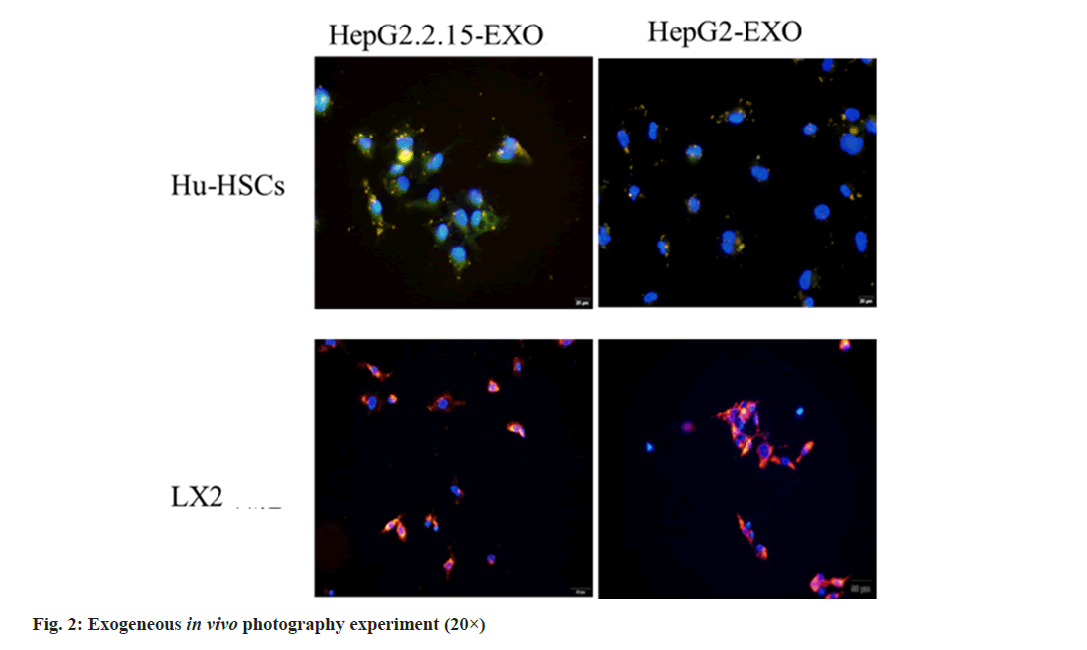
The exosomes of HepG2.2.15-EXO and HepG2- EXO groups were stained with DiI and co-cultured with Hu-HSCs and LX2 cells, respectively, for 24 h. The nucleus was stained with DAPI and observed by inverted fluorescence microscope; Hu-HSCs and LX2 exosomes were detected in the cells (fig. 2).
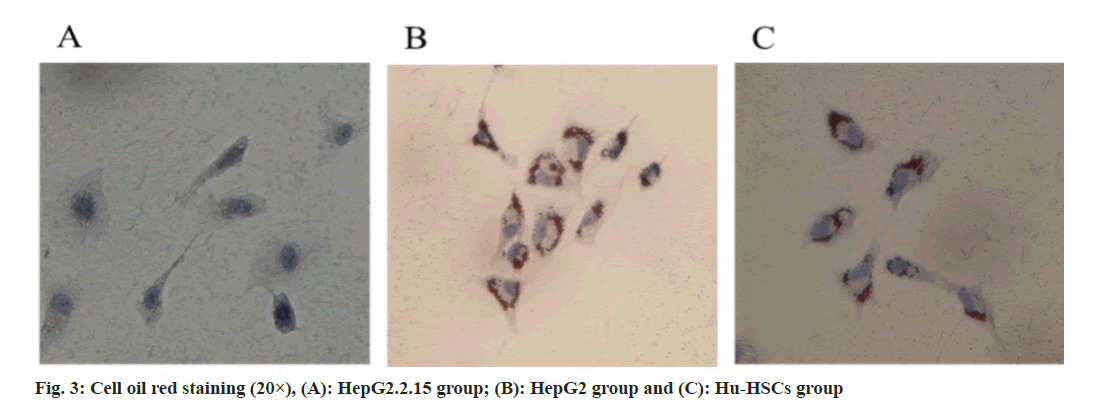
Exosomes extracted from HepG2.2.15 culture medium can eliminate fat particles in Hu-HSCs cytoplasm and activate Hu-HSCs (fig. 3).
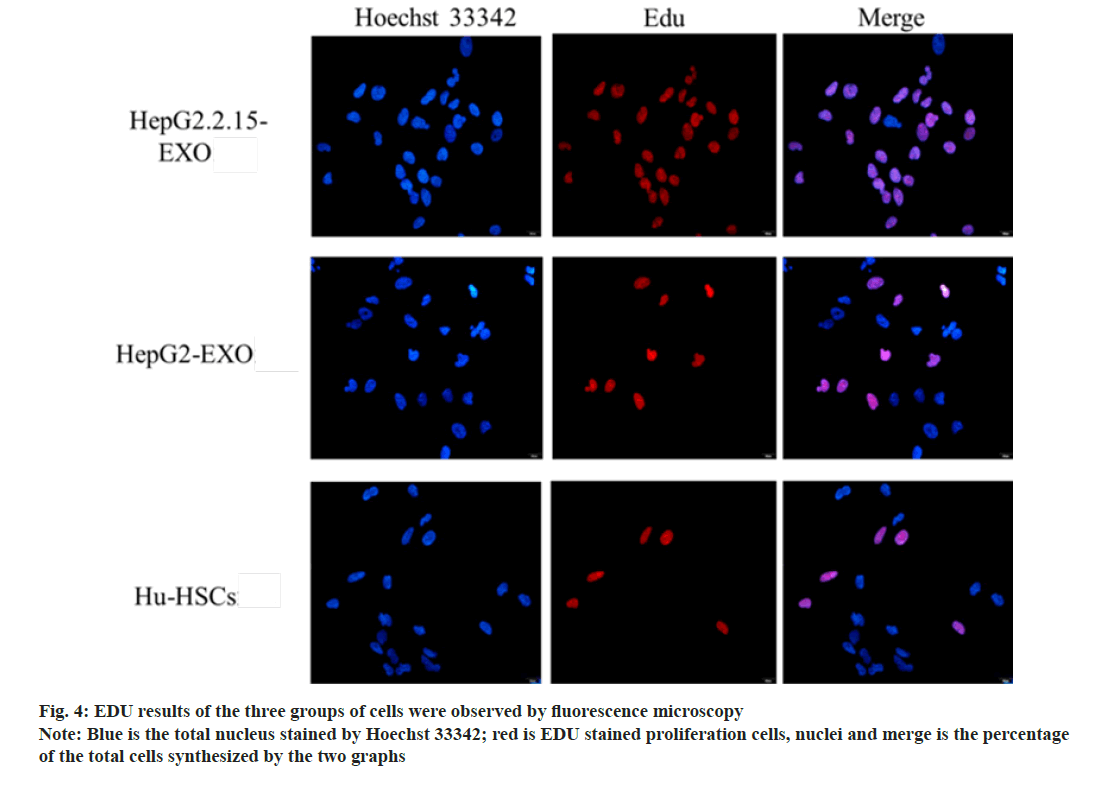
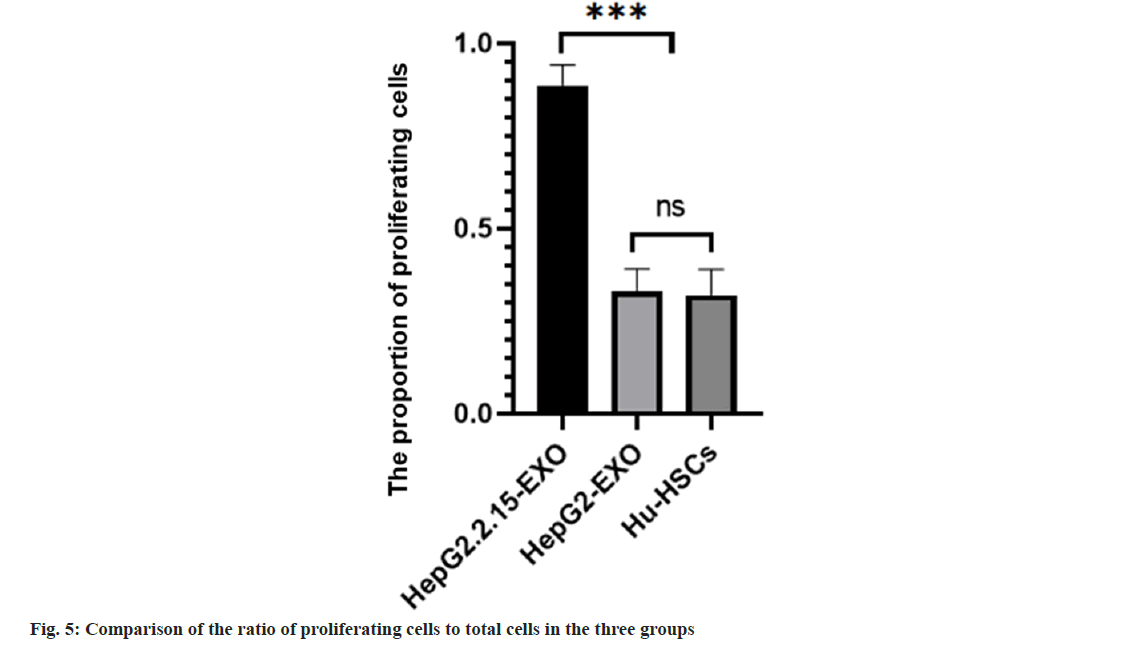
The proportion of proliferating cells in HepG2.2.15- EXO group was higher than that in HepG2-EXO group and Hu-HSCs group. HepG2-EXO group and Hu-HSCs group had no significant difference as shown in fig. 4 and fig. 5.
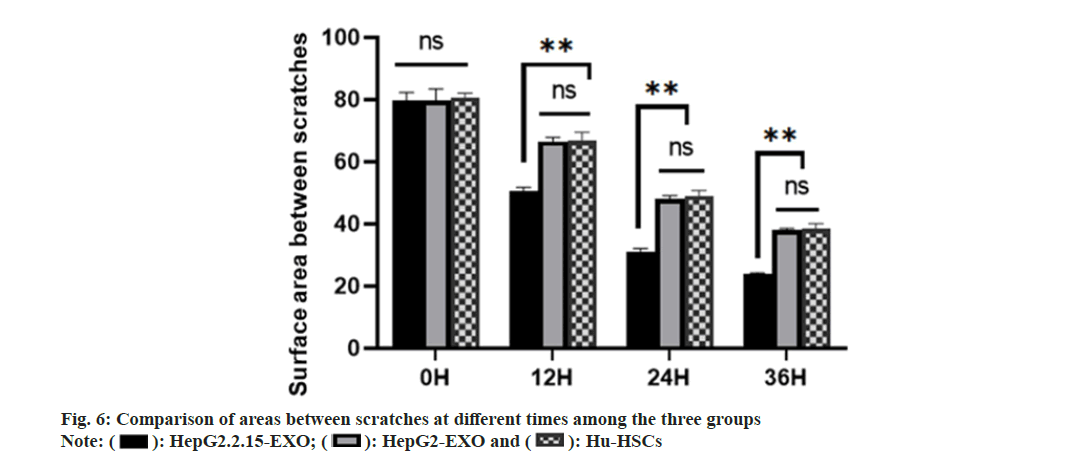
There was no significant difference in scratch area between HepG2.2.15-EXO group, HepG2- EXO group and Hu-HSCs group at 0 h. There was no significant difference in the area of scratches between HepG2-EXO group and Hu-HSCs group at 12 h, 24 h and 36 h. The area between scratches at 12 hours, 24 h and 36 h in HepG2.2.15-EXO group was smaller than that in HepG2-EXO group and Hu-HSCs group as shown in fig. 6.
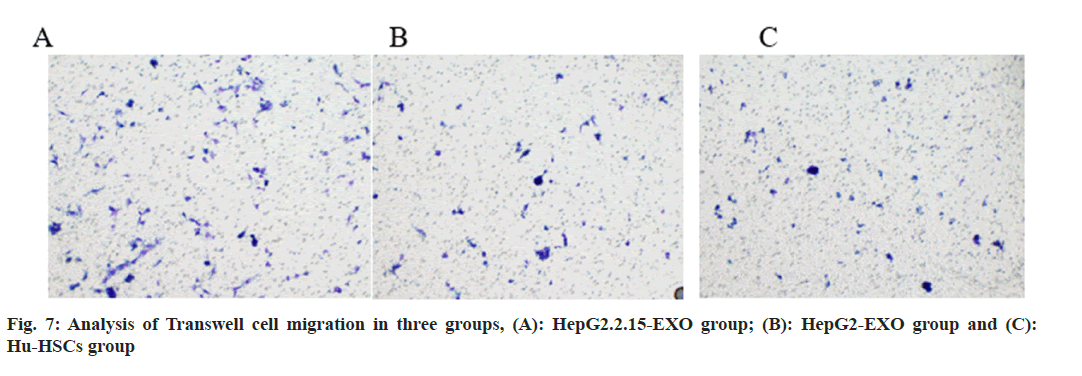
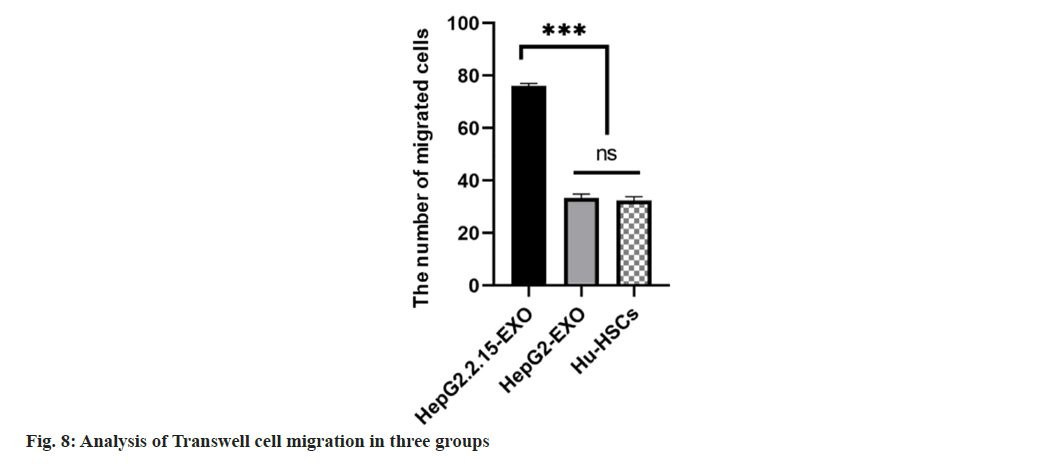
The number of migrated cells in HepG2.2.15-EXO group was increased than that in HepG2-EXO and Hu-HSC groups, and there was no statistically significant difference in the number of migrated cells between HepG2-EXO and Hu-HSCs groups (fig. 7 and fig. 8).
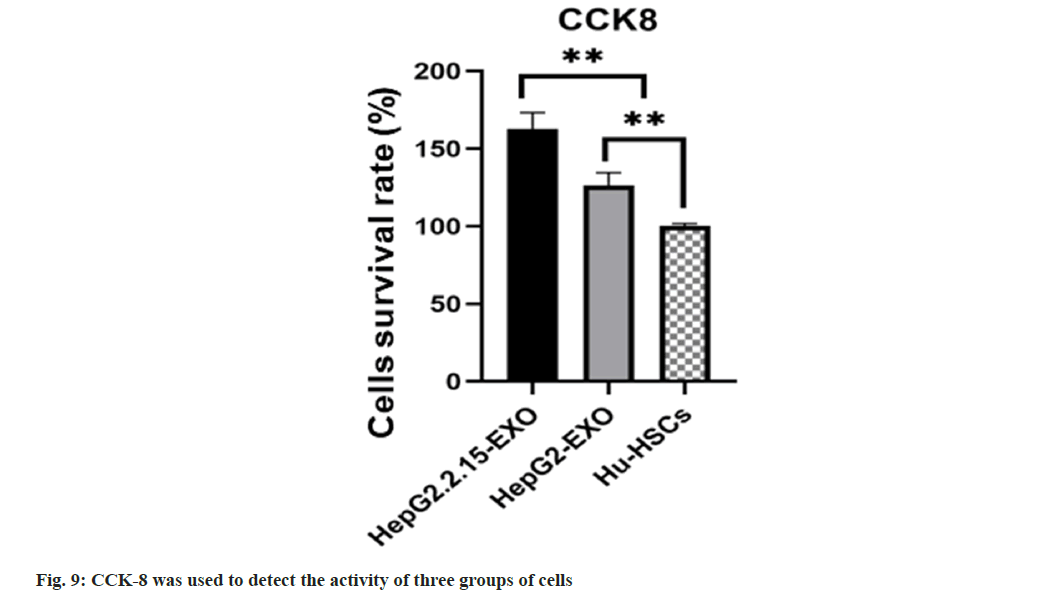
The survival rate of HepG2.2.15-EXO cells was raised than that of HepG2-EXO group and Hu- HSCs group (fig. 9).
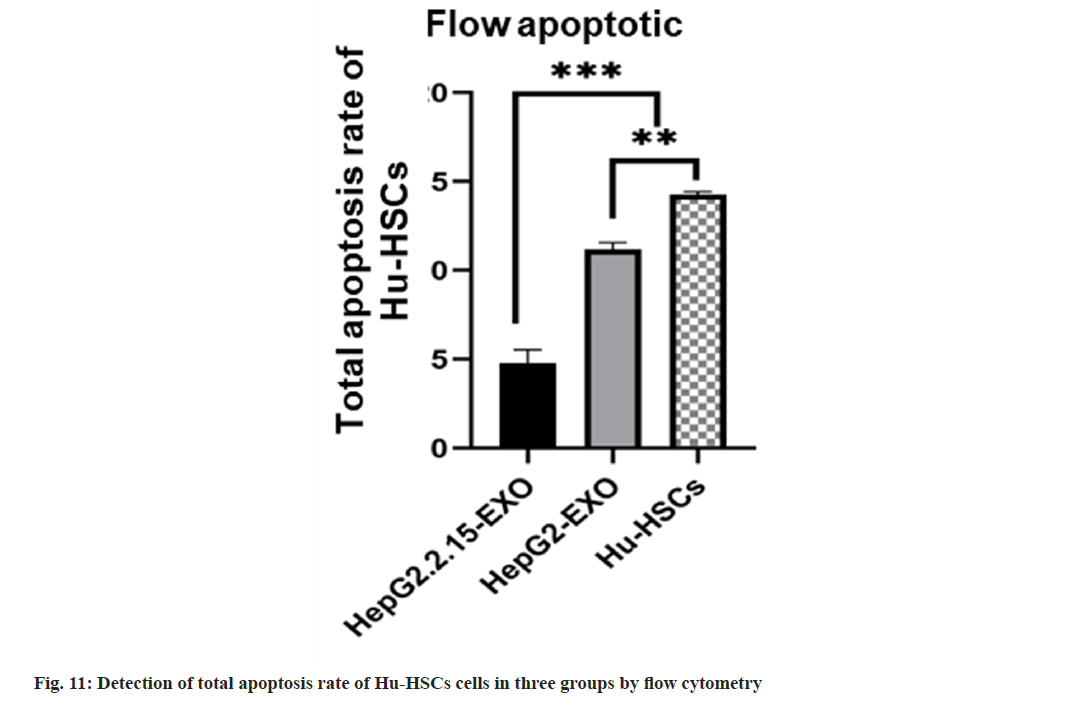
The total apoptosis rate of Hu-HSCs in HepG2.2.15- EXO group was reduced than that in HepG2-EXO group and Hu-HSCs group, while the apoptosis rate in HepG2-EXO group was lower than that in Hu-HSCs group (fig. 10 and fig. 11).
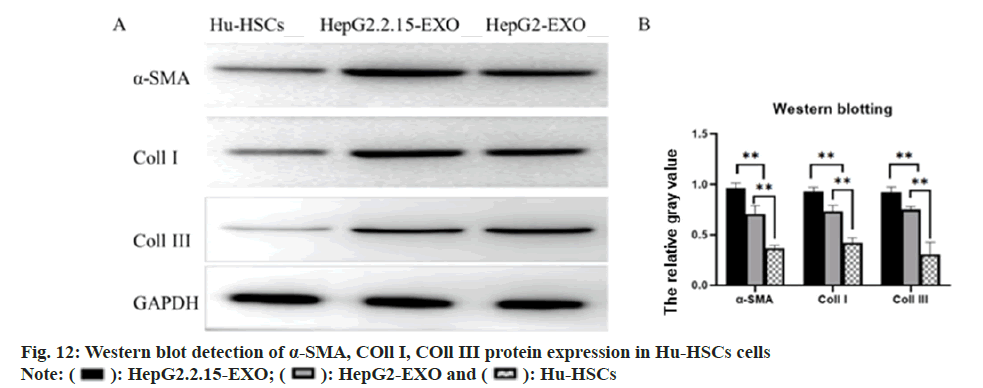
The expression of α-SMA, COL11 I and COL11 III protein in each group was detected by Western blotting. It was found that α-SMA, COL11 I and COL11 III protein in HepG2.2.15-EXO group was raised than that in HepG2-EXO group and Hu- HSCs group, while this in HepG2-EXO group was increased than that in Hu-HSCs group (fig. 12).
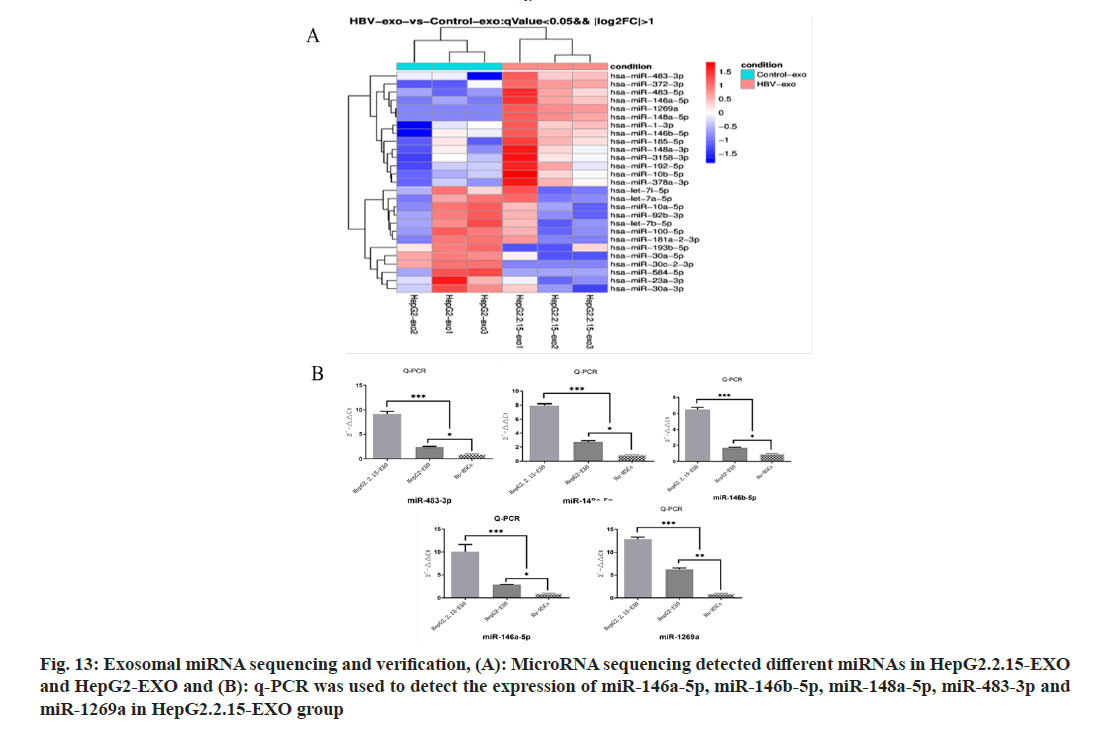
A total of 27 microns with differences in HepG2.2.15-EXO and HepG2-EXO were detected by microRNA (miR) sequencing, of which 14 were upregulated and 13 were downregulated, as shown in the figure. The expression of miR- 146a-5p, miR-146b-5p, miR-148a-5p, miR-483- 3p and miR-1269a in each group was detected by Reverse Transcription-Polymerase Chain Reaction (RT-PCR). It was found that compared with miR- 146a-5p in HepG2.2.15-EXO group, miR-146A- 5p in HepG2.2.15-EXO group, miR-146A-5p in HepG2.2.15-EXo group. The expressions of miR-146b-5p, miR-148a-5p, miR-483-3p, and miR- 1269a were significantly increased (fig. 13).
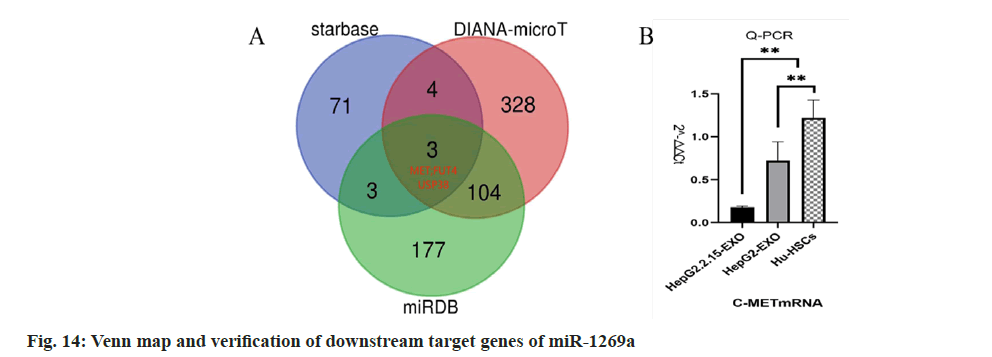
Starbase, miR map, and DIANA-microT were used to predict the downstream target genes of miR-1269a, and the target gene Mesenchymal- Epithelial Transition (MET) factor was finally obtained (fig. 14). q-PCR detection showed that c-Met messenger RNA (mRNA) expression in HepG2.2.15-EXO group was reduced than that in HepG2-EXO group and Hu-HSCs group.
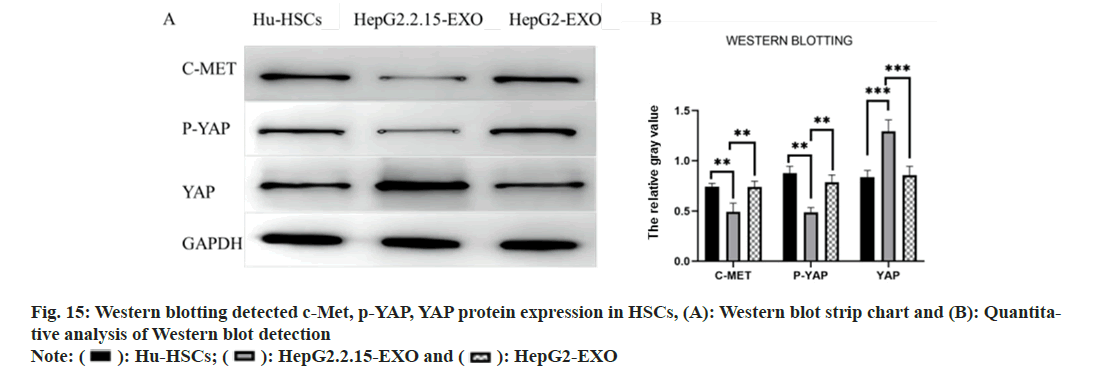
Western blotting detected the expressions of c-Met, phosphorylated (p)-Yes Associated Protein (YAP) and YAP proteins in each group. It was found that the c-Met and p-YAP proteins in HepG2.2.15-EXO group were reduced than those in HepG2-EXO group and Hu-HSCs group. YAP protein was raised than HepG2-EXO group and Hu-HSCs group (fig. 15).
In the experiment, we used exosomes secreted by HepG2.2.15 cells, exosomes secreted by HepG2 cells, exosomes secreted by WRL68 (immortalized hepatocytes) and LX2 (immortalized HSCs). After 24 h of co-culture with LX2 (immortalized HSCs), we detected the expression of α-SMA by Western blotting. It was found that the expression of α-SMA in HepG2.2.15-EXO group was lower than that in HepG2-EXO group, WRL68-EXO group and LX2 blank control group. And there was no statistical difference among the three groups. Therefore, in the study, the exocrine secreted by HepG2.2.15 cells was selected as the experimental group infected with hepatitis B, and the exocrine secreted by HepG2 cells was selected as the control group without hepatitis B.
At present, it is generally believed that the main cause of liver fibrosis caused by hepatitis B is the immune response induced by hepatitis B infection, which leads to liver injury, induces macrophages to activate and secrete a large number of cytokines such as TGF-β, and leads to epigenetic changes, which leads to the activation of HSCs, and finally leads to liver fibrosis. Generally speaking, people infected with hepatitis B will go through three processes; immune tolerance stage, in which Alanine Transaminase (ALT) and other liver function indexes are normal, HBVDeoxyribonucleic Acid (DNA) >2 000 000 μ/ml, and the result of liver puncture is normal, which can last for several years to decades; in the stage of immune activation (clearance), ALT increased in HBA positive patients, HBV-DNA >20 000 μ/ml. For HBA negative patients, ALT increased, HBVDNA >2000 μ/ml. The results of liver puncture showed that the inflammatory reaction of the liver could be with or without liver fibrosis; immune inactivation stage, HBA positive, HBV-DNA <2000 μ/ml. The inflammation of the liver alleviated or disappeared. Liver fibrosis may be improved. HBA may be cleared. Then the process of liver fibrosis caused by hepatitis B should be that hepatitis B leads to recurrent liver inflammation, liver injury, liver fibrosis and liver cirrhosis[5-7]. However, the above theory is very difficult to explain many clinical phenomena, so we do not fully understand how liver fibrosis occurs, and now our treatment of hepatitis B is only limited to the stage of inhibiting the HBV. Because the HBV itself is difficult to completely remove, coupled with even some of the people infected with HBV who we think have been well controlled still have liver fibrosis and even cirrhosis. Therefore, in order to avoid the occurrence of hepatitis B liver fibrosis and liver cirrhosis, it is very necessary to further understand the principle of hepatitis B liver fibrosis. Our team's previous studies on exosomes have found that the amount of miR-634, miR-638 and miR- 3960 in exosomes can be regulated by regulating the expression of long-chain non-coding RNA Nuclear Enriched Abundant Transcript 1 (NEAT1). After these exosomes are absorbed by HCC cells, the proliferation and invasive ability of HCC are changed. The relationship between miRNA in exocrine and hepatoma cells was confirmed[8]. So does exocrine miRNA also play an important role in the occurrence and development of hepatic fibrosis? Previous studies have confirmed that exocrine can mediate the communication between other liver cells and HSCs and lead to HSCs activation leading to liver fibrosis, but these studies mainly focus on HCV, cholestatic liver injury, chemical and drug-induced liver injury. Liu et al. confirmed by cells and animal models that the exocrine body secreted by bile duct cells carrying long-chain non-coding RNA H19 can activate HSCs and lead to cholestatic liver fibrosis. Devhare et al. confirmed in vitro that the exocrine body of hepatocytes infected with HCV can activate HSCs, and the exosome carries miR- 19a to regulate the SOCS3/STAT3 pathway. Zhang et al. confirmed that miR-21 leads to liver fibrosis by regulating the autoregulation feedback loop of miR-21/programmed cell death protein 4/activator protein 1 (miR-21/PDCD4/AP-1) in chemical liver injury induced by carbon tetrachloride[9-11].
In this part of the study, we extracted exosomes from the culture media of HepG2.2.15 (hepatoma cells carrying HBV) and HepG2 (hepatoma cells). 24 h after co-incubation with Hu-HSCs cells, immunofluorescence, oil red staining, scratches, Transwell, EDU, CCK-8 and flow cytometry were used to detect apoptosis. Western blotting and other experiments confirmed that the exocrine secreted by HepG2.2.15 cells can activate HSCs. However, what substances are carried in the exosomes and what mechanisms lead to the activation of HSCs need to be further studied.
We have previously discussed that the formation of liver fibrosis is mainly caused by the formation of a large number of EMC after HSCs is activated from the resting state. Previous studies have shown that miR-1269a can regulate the transformation of HSCs into myofibroblasts, and miRNAs is involved in the activation of HSCs[12]. Wojcicka et al.[13] found the changes of miRNA in patients with liver cirrhosis by using the second generation sequencing technique. The up-regulated miRNAs in the liver of patients with liver cirrhosis included miR-1269a, miR-3144-3p, miR-183-5p, miR-10b- 5p, miR-490-3p, miR-199a-5p, miR-199a-3p/ miR-199b-3p, miR-214-5p and miR-214-3p, while the down-regulated miRNAs included miR-199a- 3p/miR-199b-3p. Therefore, the up-regulation of miR-1269a may be related to liver fibrosis.
In our study, the difference of microRNA expression in exocrine bodies secreted by HepG2.2.15 cells and HepG2 cells was identified by secondgeneration sequencing. Compared with HepG2- EXO, microRNA, 14 in Hep2.2.15-EXO was upregulated and 13 down-regulated. miR-1269a in upregulated miRNA may lead to hepatic stellate cell activation and liver fibrosis. Through the method of big data analysis, the three databases of starbase, miRmap and DIANA-microT were found, and the Venn map was drawn. MET gene is one of the common target genes found in the three databases. By binding to the silencing complex (RISC) of c-Met, miR-1269a inhibits the degradation and translation of c-Met, mRNA, reduces the number of c-Met receptors on the cell membrane, inhibits the binding of Hepatocyte Growth Factor (HGF) to c-Met, inhibits the phosphorylation of downstream factors, and may inhibit the p-YAP, which makes non p-YAP enter the nucleus to bind with TEAD to promote the proliferation and activation of HSCs in target cells.
To sum up, both the exosomes secreted by HepG2.2.15 and the exosomes secreted by HepG2 can be absorbed by HSCs after co-culture with HSCs for 24 h, and the exosomes secreted by HepG2.2.15 can promote the activation of HSCs compared with the exosomes secreted by HepG2. The microRNA-1269a carried by the exosome secreted by HepG2.2.15 was upregulated into HSCs and targeted on MET gene, inhibiting its transcription, resulting in the decrease of c-Met, mRNA, the decrease of c-Met receptors expressed on the surface of HSCs, the inhibition of phosphorylation of downstream factor YAP, the increase and the entry of non p-YAP into the nucleus to bind to TEAD, which promoted the proliferation and activation of HSCs.
Conflict of interests:
The authors declared no conflict of interests.
References
- Zhang Z, Zha Y, Hu W, Huang Z, Gao Z, Zang Y, et al. The autoregulatory feedback loop of microRNA-21/programmed cell death protein 4/activation protein-1 (miR-21/PDCD4/AP-1) as a driving force for hepatic fibrosis development. J Biol Chem 2013;288(52):37082-93.
[Crossref] [Google Scholar] [PubMed]
- Liu Z, Zhang XH, Callejas-Díaz B, Mullol J. MicroRNA in united airway diseases. Int J Mol Sci 2016;17(5):716.
[Crossref] [Google Scholar] [PubMed]
- Jonas S, Izaurralde E. Towards a molecular understanding of microRNA-mediated gene silencing. Nat Rev Genet 2015;16(7):421-33.
[Crossref] [Google Scholar] [PubMed]
- Steiman-Shimony A, Shtrikman O, Margalit H. Assessing the functional association of intronic miRNAs with their host genes. RNA 2018;24(8):991-1004.
[Crossref] [Google Scholar] [PubMed]
- Sendi H, Yazdimamaghani M, Hu M, Sultanpuram N, Wang J, Moody AS, et al. Nanoparticle delivery of miR-122 inhibits colorectal cancer liver metastasis. Cancer Res 2022;82(1):105-13.
[Crossref] [Google Scholar] [PubMed]
- Ota A, Tagawa H, Karnan S, Tsuzuki S, Karpas A, Kira S, et al. Identification and characterization of a novel gene, C13orf25, as a target for 13q31-q32 amplification in malignant lymphoma. Cancer Res 2004;64(9):3087-95.
[Crossref] [Google Scholar] [PubMed]
- Berindan-Neagoe I, Monroig PD, Pasculli B, Calin GA. MicroRNAome genome: A treasure for cancer diagnosis and therapy. CA Cancer J Clin 2014;64(5):311-36.
[Crossref] [Google Scholar] [PubMed]
- Vienberg S, Geiger J, Madsen S, Dalgaard LT. MicroRNAs in metabolism. Acta Physiol 2017;219(2):346-61.
[Crossref] [Google Scholar] [PubMed]
- Hsu SH, Wang B, Kota J, Yu J, Costinean S, Kutay H, et al. Essential metabolic, anti-inflammatory, and anti-tumorigenic functions of miR-122 in liver. J Clin Invest 2012;122(8):2871-83.
[Crossref] [Google Scholar] [PubMed]
- Tsai WC, Hsu SD, Hsu CS, Lai TC, Chen SJ, Shen R, et al. MicroRNA-122 plays a critical role in liver homeostasis and hepatocarcinogenesis. J Clin Invest 2012;122(8):2884-97.
[Crossref] [Google Scholar] [PubMed]
- Agarwal V, Subtelny AO, Thiru P, Ulitsky I, Bartel DP. Predicting microRNA targeting efficacy in Drosophila. Genome Biol 2018;19:1-23.
[Crossref] [Google Scholar] [PubMed]
- Wang Y, Chen C, Deng Z, Bian E, Huang C, Lei T, et al. Repression of TSC1/TSC2 mediated by MeCP2 regulates human embryo lung fibroblast cell differentiation and proliferation. Int J Biol Macromol 2017;96:578-88.
[Crossref] [Google Scholar] [PubMed]
- Wojcicka A, Swierniak M, Kornasiewicz O, Gierlikowski W, Maciag M, Kolanowska M, et al. Next generation sequencing reveals microRNA isoforms in liver cirrhosis and hepatocellular carcinoma. Int J Biochem Cell Biol 2014;53:208-17.
[Crossref] [Google Scholar] [PubMed]
 ): HepG2.2.15-EXO; (
 ): HepG2-EXO and (
 ): Hu-HSCs

 ): HepG2.2.15-EXO; (
 ): HepG2-EXO and (
 ): Hu-HSCs
 ): Hu-HSCs; (
  ): HepG2.2.15-EXO and (
 ): HepG2-EXO


