- *Corresponding Author:
- A. O. Abuelgassim
Department of Zoology,
King Saud University,
Riyadh 11451,
Saudi Arabia
E-mail: gassim@ksu.edu.sa
| Date of Received | 13 January 2020 |
| Date of Revision | 14 September 2021 |
| Date of Acceptance | 19 March 2022 |
| Indian J Pharm Sci 2022;84(2):341-347 |
This is an open access article distributed under the terms of the Creative Commons Attribution-NonCommercial-ShareAlike 3.0 License, which allows others to remix, tweak, and build upon the work non-commercially, as long as the author is credited and the new creations are licensed under the identical terms
Abstract
The effect of ferulic acid administration to atherogenic rats was investigated. 80 male Wistar rats were assigned to two categories. The first consisted of four groups which receive normal diet and divided into control rats, rats treated with ferulic acid (30 mg/kg body weight), simvastatin (10 mg/kg body weight) and a combined dose of both ferulic acid and simvastatin. The second four groups received atherogenic diet and divided into control, treated with ferulic acid, simvastatin and both ferulic acid and simvastatin using the previous doses. Doses were administered orally on daily basis and continued for 7 successive weeks. Serum concentrations of total cholesterol, low-density lipoprotein cholesterol, high-density lipoprotein cholesterol, triglycerides and glucose were determined. A significant decrease in serum levels of total cholesterol and low-density lipoprotein cholesterol was observed in normal control and atherogenic rats treated with ferulic acid. No significant differences were observed in serum levels of high-density lipoprotein cholesterol and glucose after treating atherogenic rats with ferulic acid or simvastatin or the combination. 3-hydroxy-3-methylglutaryl-coenzyme A reductase activity was increased in the atherogenic control group compared to their matched normal control group. Treatment of atherogenic rats with the combined dose almost restored the enzyme activity to the normal level. Oral administration of ferulic acid has a hypocholesterolaemic effect and significantly reduces 3-hydroxy-3-methylglutaryl-coenzyme A reductase activity.
Keywords
Ferulic acid, cholesterol, simvastatin, 3-hydroxy-3-methylglutaryl-coenzyme A reductase, histopathology, lipid profile
Cardiovascular Disease (CVD) is one of the major leading cause of morbidity and mortality that affects not only developed but also under-developed countries [1]. Oxidative stress has been implicated in the pathogenesis of various CVDs including atherosclerosis [2]. Hypercholesterolemia, an elevation of Total Cholesterol (TC) and/or Low-Density Lipoprotein Cholesterol (LDL-C) within the blood, is often referred to as dyslipidaemia [3]. Animal model studies and epidemiological and clinical studies indicate that high dietary fat intake promotes the development of obesity and hyperlipidaemia in humans and rodents by altering the cholesterol and Triglycerides (TG) levels within plasma and tissues, ultimately leading to a higher risk for CVDs, fatty liver disease and diabetes mellitus [4,5].
A large number of foods contain polyphenols including fruits, vegetables, seeds, nuts, chocolate, wine, coffee and tea [6]. Phenolic acids are one of the essential compounds that occur in plants, their structures are relatively simple and they can be bound to sugar units [7,8]. Ferulic Acid (FA) is a ubiquitous bioactive plant polyphenol composed of 4-hydroxy-3-methoxycinnamic acid. It is commonly found in rice, wheat, oats, pineapple, grasses, grains, vegetables, flowers, fruits, leaves, beans, seeds of coffee, artichoke, peanuts and cereals [9,10]. FA has been suggested to possess a number of properties such as antioxidant, antihyperlipidemic, antimicrobial, anti-inflammatory, antiatherogenic, anti-carcinogenic, neuroprotective and antihypertensive [11-13]. It has also been demonstrated to exert protective effects against CVD, Alzheimer disease and ultraviolet radiation [14]. FA lowers cholesterol and increases sperm viability [15] and it has been approved in Japan as an additive antioxidant and food preservative [16].
The aim of the present work was to study the effect of oral administration of FA on serum lipid profile of atherogenic-induced rats. 3-Hydroxy-3-Methylglutaryl- Coenzyme A (HMG-CoA) reductase activity and liver histology were also in focus.The atherogenic diet was purchased from DYET#102571, United States of America (USA) and Canada. The diet composed the following in g/kg: Casein 75, soy protein isolates 130, DL-methionine 2, sucrose 30, cornstarch 275, dextrose 150, soybean oil 50, cocoa butter 75, edible coconut oil 35, cellulose 90, mineral mix (No. 200000) 35, calcium carbonate 5.5, sodium chloride 8, hydrated potassium citrate 10, vitamin mix (No. 300050)10, choline bitartrate 2, cholesterol 12.5 and sodium cholate 5. FA (Cat. No.128708) and HMG-CoA reductase kit (Category No. CS1090) were obtained from Sigma Aldrich (Missouri (MO), USA). Kits for TC, LDL-C, High-Density Lipoprotein Cholesterol (HDL-C), TG and glucose were obtained from Human (Germany). Male Wistar rats were obtained from the animal house, College of Science, King Saud University, Riyadh, Saudi Arabia.
Materials and Methods
The atherogenic diet was purchased from DYET#102571, United States of America (USA) and Canada. The diet composed the following in g/kg: Casein 75, soy protein isolates 130, DL-methionine 2, sucrose 30, cornstarch 275, dextrose 150, soybean oil 50, cocoa butter 75, edible coconut oil 35, cellulose 90, mineral mix (No. 200000) 35, calcium carbonate 5.5, sodium chloride 8, hydrated potassium citrate 10, vitamin mix (No. 300050)10, choline bitartrate 2, cholesterol 12.5 and sodium cholate 5. FA (Cat. No.128708) and HMG-CoA reductase kit (Category No. CS1090) were obtained from Sigma Aldrich (Missouri (MO), USA). Kits for TC, LDL-C, High-Density Lipoprotein Cholesterol (HDL-C), TG and glucose were obtained from Human (Germany). Male Wistar rats were obtained from the animal house, College of Science, King Saud University, Riyadh, Saudi Arabia.
Animal groups and experimental design:
80 Wistar rats (155-200 g) were allowed for free access to standard laboratory diet and water and maintained at 22°±2° under a 12:12 h light and dark cycle for 7 d prior to the start of the experiment. After 1 w of acclimatization, rats were randomly divided into two groups with similar average body weights, each group composed of 4 subgroups. Group I rats received normal diet that is Normal Control (NC); Group II received Atherogenic Diet (AT). Atherogenesis was confirmed by biochemical analysis of TC, TG and LDL-C. NC and AT groups were divided into 3 subgroups, treated orally by gavage with either FA at 30 mg/kg Body Weight (BW), or with the reference drug Simvastatin (STAT) at 10 mg/kg BW or both FA and STAT, all treatment protocols continued for 7 successive weeks. Body weights, water ingestion and food intake were measured and recorded daily for all groups. The experiments were conducted according to King Saud University Ethical Committee Acts (Ethical Approval #78352-25-8).
Blood and tissue sample preparation for analysis:
Rats were anaesthetized using diethyl ether and blood was collected from the jugular vein into plain tubes, stored for 30 min at room temperature and centrifuged at 4000 rpm for 10 min. The serum was collected and refrigerated at -20° until biochemical analysis. At the end of the treatment, anaesthetized rats were decapitated. The liver was quickly removed and washed with normal saline and stored at -80° until biochemical analysis.
Biochemical analysis:
The following parameters; Glucose, TC, LDL-C, HDL-C and TG were estimated in serum samples using standard enzymatic methods on a semi-automatic biochemistry 3000 analyzer (SFRI, France) [17-21].
Preparation of the liver microsomal fraction and HMG-CoA reductase activity:
Frozen livers (2 g) were excised and homogenized in an ice-cold 10 mM Tris (hydroxymethyl) aminomethane Hydrochloride (Tris-HCl) buffer containing 0.25 M sucrose, pH 7.4. The homogenate was centrifuged for 10 min at 13 000×g and 4° and the precipitate was discarded. Calcium chloride was added to the supernatant to yield a final concentration of 10 mM. The solution was stirred for 15-20 min and then centrifuged at 25 000×g for 10 min at 4°. The firmly packed microsome pellets were resuspended in 100 mM Tris-HCl buffer containing 20 % w/v glycerol and 10 mM Ethylenediamine Tetraacetic Acid (EDTA), pH 7.4. The microsomes were stored at –70° until use [22]. Protein concentration using Bovine Serum Albumin (BSA) as a standard was determined [23]. HMG-CoA reductase activity was determined by using Sigma Aldrich kit (Category. No. CS1090).
Histopathology examination:
Liver samples were fixed in 10 % neutral buffered formalin and cut into small pieces to allow the penetration of the fixing reagent. Tissues were then dehydrated under ethanol gradients and then in absolute alcohol, thereafter cleared using xylol and immersed in a mixture of xylol and paraffin wax (melting point of 58°) in the oven. Samples were then mounted in blocks, the paraffin blocks were sectioned using a microtome at a thickness of 5 μm and mounted on clean glass slides, after drying overnight, the slides were deparaffinised in xylol and then rehydrated using a descending series of alcohol concentrations, finally slides were stained with haematoxylin and eosin and examined under a light microscope using 20× and 40× magnification, respectively [24].
Statistical analysis:
The results are presented as mean±Standard Deviation (SD). Comparisons between groups were performed using the Statistical Package for the Social Sciences (SPSS) software. Statistical analysis was performed using one-way Analysis of Variance (ANOVA) with Tukey's post hoc test using Origin software version 19.0. p≤0.05 was considered significant.
Results and Discussion
Table 1 showed the effect of FA administration on body weight, water and diet intake, no significant differences in the final body weights were observed between the NC rats and their matched groups that treated with FA, STAT or a combination of these drugs. However, the control AT rats exhibited a significant increase (p<0.01) in final body weight compared to that of the NC rats (418.71±30.83 compared to 282±39.09 g). The final body weight was significantly decreased (p<0.01; p<0.05) in AT treated groups compared to the control AT rats. The gain in body weight was greater in the control AT group in comparison to their matched NC group (147.21 compared to 101.2 g). NC rats treated with FA, STAT or a combination of FA and STAT exhibited a decrease in body weight gain (72.5, 81.33 and 65.83 g respectively).
| Groups | Initial body weight (g) | Final body weight (g) | Weight gain (g) | Food intake (g/d) | Water intake (ml/d) |
|---|---|---|---|---|---|
| NC | 180.8±24.47 | 282±39.09 | 101.2 | 18.67±1.88 | 34.86±6.03 |
| NC+FA | 164.33±11.52 | 236.83±34.70 | 72.5 | 16.78±0.98 | 26.69±2.56a* |
| NC+STAT | 176±20.24 | 257.33±41.94 | 81.33 | 18.36±1.27 | 28.57±4.29a** |
| NC+FA+STAT | 198.5±21.82 | 264.33±24.31 | 65.83 | 18.5±2.76 | 36.94±4.37 |
| AT | 271.5±13.67 | 418.71±30.83a* | 147.21 | 17.85±2.06 | 35.88±6.40 |
| AT+FA | 242.5±9.77 | 361.78±17.46b* | 119.28 | 18.03±2.35 | 37.55±4.09 |
| AT+STAT | 231.4±18.56 | 348.9±44.84b** | 117.5 | 17.6±3.56 | 40.11±6.08 |
| AT+FA+STAT | 234.8±23.26 b* | 347±20.41b** | 112.2 | 7.58±2.79 | 40.69±7.86 |
Note: Results are expressed as mean±SD. NC groups consisted of 6 rats; AT groups consisted of 8 rats; acompared to NC; bcompared to AT; *p<0.01; **p<0.05; NC: Normal Control rats; FA: Ferulic Acid; STAT: Simvastatin; AT: Atherogenic rats
Table 1: The Effect of FA on BW, Food Intake and Water Intake of NC and AT Rat Groups
The effect of FA administration on serum concentrations of lipids and glucose of NC and AT rats is shown on Table 2 and Table 3. Serum levels of TC were significantly decreased (p<0.05) in NC rats treated with FA at a concentration of 30 mg/kg BW as the concentration decreased from 44.55±9.21 to 40.13±4.49 mg/dl (Table 2). Also the serum levels of TC were significantly decreased (p<0.001) in AT rats treated with FA, STAT and a combined dose of FA with STAT as they dropped from 91.13±15.83 mg/dl in AT control group to 64.37±12.67, 49.73±11.21 and 67.69±10.93 mg/dl respectively (Table 3). Serum levels of LDL-C were significantly decreased in NC and AT groups that were treated with FA as the concentration decreased from 22.24±2.66 to 17.54±2.87 mg/dl and from 41.44±6.88 to 25.86±4.87 mg/dl respectively (Table 2 and Table 3). The drop reached 37.6 % (p<0.001) in AT rats treated with FA. These findings are in full agreement with those of Jain and Surana [25] who reported that administration of FA at a concentration of 20 and 40 mg/kg BW resulted in a significant decrease in the serum levels of TC and LDL-C of hyperlipidemic rats. This decrease in serum levels of TC, LDL-C could be attributed to the high amounts of cholesterol and saturated fatty acids that were associated with a downregulation of LDL receptors that resulted in increased serum LDL-C levels. Another report conducted by Miller et al. [26] referred to that gamma (γ)-oryzanol, due to its steryl ferulates as a major component exerts a cholesterol lowering effect.
| Assay/Groups | NC | NC+FA | NC+STAT | NC+FA+STAT |
|---|---|---|---|---|
| TC (mg/dl) | 44.55±9.21 | 40.13±4.49† | 34.70±7.57†† | 33.44±6.44* |
| LDL-C (mg/dl) | 22.24±2.66 | 17.54±2.87* | 16.59±2.89* | 18.65±3.58 |
| HDL-C (mg/dl) | 34.25±7.09 | 22.0±1.63* | 26.50±3.70* | 24.80±7.76* |
| TG (mg/dl) | 42.44±9.10 | 48.85±11.02 | 47.78±13.78 | 50.52±9.12 |
| Glucose (mg/dl) | 137.15±14.32 | 124.63±17.36 | 141.86±15.37 | 132.14±18.87 |
Note: Results are expressed as mean±SD. Each group consisted of 6 rats. Compared to NC, †p<0.05; ††p<0.02 and *p<0.01; NC: Normal Control rats; FA: Ferulic Acid; STAT: Simvastatin
Table 2: The Effect of FA on Serum Lipid and Glucose Levels of NC Rats
Serum TG concentration was significantly increased (p<0.001) in AT control rats (139.79±20.97 mg/ dl) compared to their matched NC rats (42.44 ±9.10 mg/dl), however, treatment of AT rats with FA or FA in combination with STAT resulted in a significant decrease (p<0.001) of serum TG levels (Table 3). On the other hand, no significant differences were observed in both serum glucose and HDL-C concentrations of AT rats administered FA either alone or in a combination with STAT.
| Assay/Groups | AT | AT+FA | AT+STAT | AT+FA+STAT |
|---|---|---|---|---|
| TC (mg/dl) | 91.13±15.83 | 64.37±12.67** | 49.73±11.21** | 67.69±10.93** |
| LDL-C (mg/dl) | 41.44±6.88 | 25.86±4.87** | 30.68±4.09* | 29.11±4.80** |
| HDL-C (mg/dl) | 38.03±14.74 | 35.80±6.05 | 28.20±4.09 | 31.50±6.16 |
| TG (mg/dl) | 139.79±20.97 | 118.98±12.26** | 135.10±24.0 | 125.75±21.97** |
| Glucose (mg/dl) | 156.61±21.27 | 159.93±18.14 | 145.70±15.03 | 156.18±13.05 |
Note: Results are expressed as mean±SD. Each group consisted of 8 rats. Compared to AT, *p<0.01; **p<0.001; FA: Ferulic Acid; STAT: Simvastatin; AT: Atherogenic rats
Table 3: The Effect of FA on Serum Lipid and Glucose Levels of AT Rats
Table 4 shows the effect of FA on liver HMG-CoA reductase activity. No changes were observed in the HMG-CoA reductase activity of NC rats and their matched groups. The enzyme activity was significantly increased (p<0.001) in the AT rats (11.54 nU/mg) compared to that of the NC rat group (5.82 nU/mg). Treatment of atherogenic-induced rats with a combined dose of FA and STAT restored the enzyme activity to nearly normal levels, as it dropped from 11.54 nU/mg to 6.51 nU/mg. Rats fed high cholesterol diet supplemented with hesperetin and hesperetin metabolites, among them is FA, for 5 w, all showed a significant decrease in hepatic HMG-CoA reductase and Acyl-Coenzyme A:Cholesterol Acyltransferase (ACAT) activities when compared to their matched groups [27].
| Groups | NC | NC+ FA | NC+STAT | NC+FA+STAT | AT | AT+FA | AT+STAT | AT+FA+STAT |
|---|---|---|---|---|---|---|---|---|
| HMG-CoA reductase activity (nU/mg protein) | 5.82±0.31 | 6.11±0.26 | 7.15±0.28 | 7.45±0.19 | 11.54±0.37 | 10.71±0.27 | 8.2±0.33* | 6.51±0.22** |
Note: Results are expressed as mean±SD for at least 4 liver samples; * p<0.01; **p<0.001; NC: Normal Control rats; FA: Ferulic Acid; STAT: Simvastatin; AT: Atherogenic rats
Table 4: The Effect of FA on Liver HMG-Coa Reductase Activity of NC And AT Rats
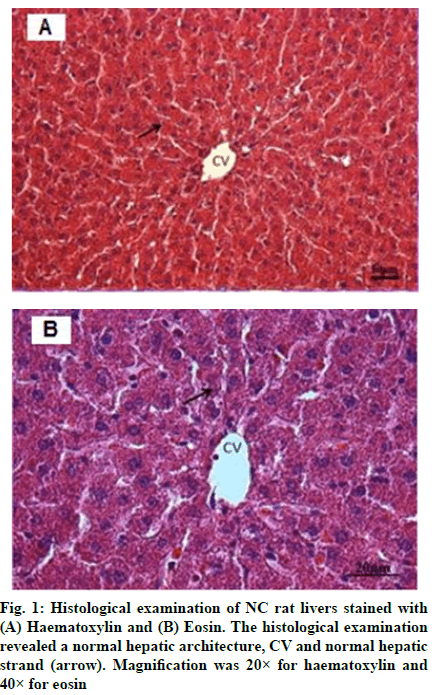
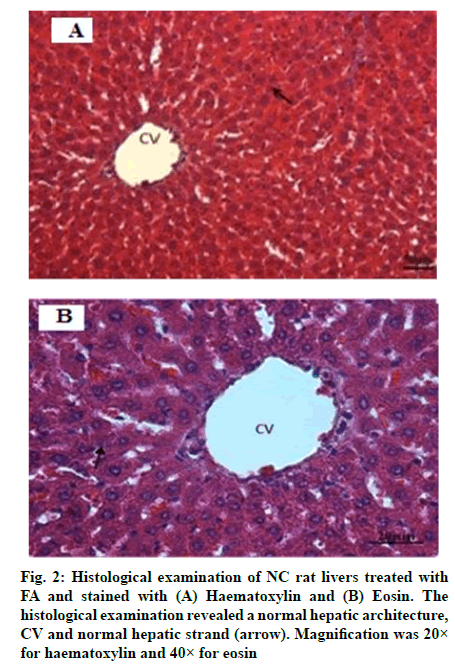
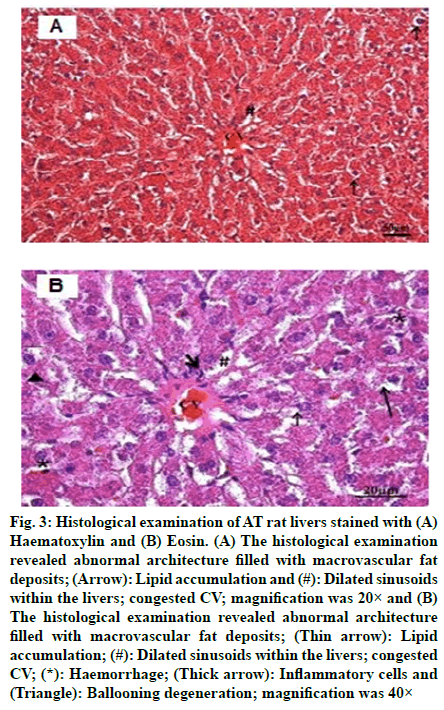
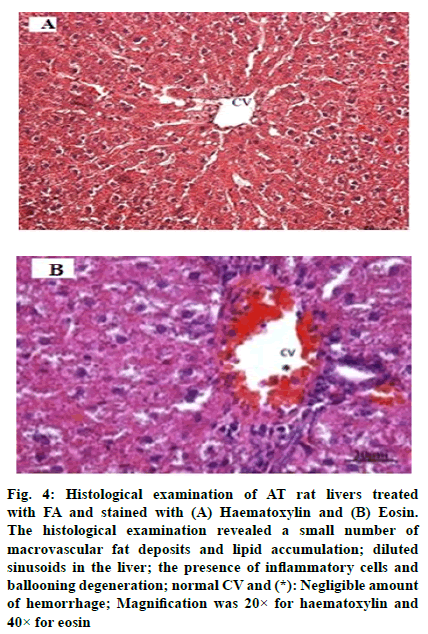
The histological examination of NC rat livers are shown in fig. 1A and fig. 1B, whereas, NC rat livers that were treated with FA are shown in fig. 2A and fig. 2B. Both sets of livers revealed a normal hepatic architecture exhibiting a normal Central Vein (CV) and hepatic strand. On the other hand, histological changes were observed in the livers of AT rats. These changes include abnormal architecture filled with macrovascular fat deposits, lipid accumulation, dilated sinusoids in the liver and congested CVs (fig. 3A and fig. 3B). Fig. 4A and fig. 4B represented the histological examination of AT rat livers treated with FA. Images revealed moderate macrovascular fat deposits, lipid accumulation, dilated sinusoids in the liver, inflammatory cells, ballooning degeneration and normal CVs. The histological changes of AT rats treated with STAT showed liver tissue filled with moderate macrovascular fat deposits, lipid accumulation and little presence of haemorrhage, whereas, AT rats treated with both FA and STAT, histological staining revealed mild macrovascular fat deposits, lipid accumulation in the liver, dilated CVs and negligible amount of haemorrhage.
Fig. 3: Histological examination of AT rat livers stained with (A) Haematoxylin and (B) Eosin. (A) The histological examination revealed abnormal architecture filled with macrovascular fat deposits; (Arrow): Lipid accumulation and (#): Dilated sinusoids within the livers; congested CV; magnification was 20× and (B) The histological examination revealed abnormal architecture filled with macrovascular fat deposits; (Thin arrow): Lipid accumulation; (#): Dilated sinusoids within the livers; congested CV; (*): Haemorrhage; (Thick arrow): Inflammatory cells and (Triangle): Ballooning degeneration; magnification was 40×
Fig. 4: Histological examination of AT rat livers treated with FA and stained with (A) Haematoxylin and (B) Eosin. The histological examination revealed a small number of macrovascular fat deposits and lipid accumulation; diluted sinusoids in the liver; the presence of inflammatory cells and ballooning degeneration; normal CV and (*): Negligible amount of hemorrhage; Magnification was 20× for haematoxylin and 40× for eosin
Histological analyses in the present study revealed changes within the liver sections of AT rats. The major alterations observed were abnormal architecture filled with macrovascular fat deposits, lipid accumulation, dilated sinusoids in the liver and congested CVs (fig. 3). Similar observations were reported by Jain and Surana [25], where they observed histopathological changes when comparing the livers from NC rats to those of AT group and other groups treated with FA or atorvastatin. The livers of High Fat Diet (HFD) control rats exhibited the presence of inflammatory cells; however, atorvastatin (1.2 mg/kg) treatment resulted in mild histopathological changes in the liver marked by vesicular fat. In FA (10 and 20 mg/kg) treated rats, the histology of the liver revealed a moderate degree of vacuolisation and necrosis surrounding the CV. In our study, histological examinations of AT rats treated with FA, STAT, or a combination of FA and STAT revealed reduced macrovascular fat deposits, lipid accumulation, diluted sinusoids in the liver, the presence of inflammatory cells, ballooning degeneration, normal CVs and only small amounts of haemorrhage. Our histology findings are in agreement with the report of Kesh et al. [28], who studied the effects of FA on liver histology and revealed that mice fed HFD supplemented with FA for 8 w resulted in less severe fat accumulation and infiltration of inflammatory cells into the liver compared to their matched group mice fed on HFD.
In conclusion, oral supplementation of FA at a concentration of 30 mg/kg BW to atherogenic-induced rats resulted in a significant reduction of the serum levels of TC and LDL-C. FA treatment also inhibited the activity of liver HMG-CoA reductase. The histological examination of livers from control rats and rats treated with FA, STAT or a combination of both drugs revealed normal hepatic architecture. In contrast, there were several changes in the liver sections obtained from AT rats. Treatment with FA, STAT or both drugs in combination induced a greater reduction in hepatic steatosis and resulted in additional improvements in liver architecture.
Acknowledgements:
This work was supported by King Abdulaziz City for Science and Technology (KACST), Kingdom of Saudi Arabia, Project No. 12-BIO2694-02.
Conflict of interests:
The authors declared no conflict of interest.
References
- Wadhera RK, Steen DL, Khan I, Giugliano RP, Foody JM. A review of low-density lipoprotein cholesterol, treatment strategies and its impact on cardiovascular disease morbidity and mortality. J Clin Lipidol 2016;10(3):472-89.
[Crossref] [Google Scholar] [PubMed]
- Li H, Horke S, Förstermann U. Vascular oxidative stress, nitric oxide and atherosclerosis. Atherosclerosis 2014;237(1):208-19.
[Crossref] [Google Scholar] [PubMed]
- Tiwari V, Khokhar M. Mechanism of action of anti-hypercholesterolemia drugs and their resistance. Eur J Pharmacol 2014;741:156-70.
[Crossref] [Google Scholar] [PubMed]
- Bray GA, Popkin BM. Dietary fat intake does affect obesity! Am J Clin Nutr 1998;68(6):1157-73.
[Crossref] [Google Scholar] [PubMed]
- McNamara DJ. Dietary cholesterol and atherosclerosis. Biochim Biophys Acta Mol Cell Biol Lipids 2000;1529(1-3):310-20.
[Crossref] [Google Scholar] [PubMed]
- Ly C, Yockell-Lelievre J, Ferraro ZM, Arnason JT, Ferrier J, Gruslin A. The effects of dietary polyphenols on reproductive health and early development. Hum Reprod Update 2015;21(2):228-48.
[Crossref] [Google Scholar] [PubMed]
- Mattila P, Hellström J. Phenolic acids in potatoes, vegetables and some of their products. J Food Compost Anal 2007;20(3-4):152-60.
- Crozier A, Jaganath IB, Clifford MN. Dietary phenolics: Chemistry, bioavailability and effects on health. Nat Prod Rep 2009;26(8):1001-43.
[Crossref] [Google Scholar] [PubMed]
- Srinivasan M, Sudheer AR, Menon VP. Ferulic acid: Therapeutic potential through its antioxidant property. J Clin Biochem Nutr 2007;40(2):92-100.
[Crossref] [Google Scholar] [PubMed]
- Zhao Z, Moghadasian MH. Chemistry, natural sources, dietary intake and pharmacokinetic properties of ferulic acid: A review. Food Chem 2008;109(4):691-702.
[Crossref] [Google Scholar] [PubMed]
- Balakrishnan S, Menon VP, Manoharan S, Rajalingam K. Antigenotoxic effect of ferulic acid in 7, 12-dimethyl benz (a)-anthracene (DMBA) induced genotoxicity. Afr J Tradit Complement Altern Med 2008;5(1):32-8.
[Crossref] [Google Scholar] [PubMed]
- Sudheer AR, Muthukumaran S, Devipriya N, Devaraj H, Menon VP. Influence of ferulic acid on nicotine-induced lipid peroxidation, DNA damage and inflammation in experimental rats as compared to N-acetylcysteine. Toxicology 2008;243(3):317-29.
[Crossref] [Google Scholar] [PubMed]
- Ramar M, Manikandan B, Raman T, Priyadarsini A, Palanisamy S, Velayudam M, et al. Protective effect of ferulic acid and resveratrol against alloxan-induced diabetes in mice. Eur J Pharmacol 2012;690(1-3):226-35.
[Crossref] [Google Scholar] [PubMed]
- Mancuso C, Santangelo R. Ferulic acid: Pharmacological and toxicological aspects. Food Chem Toxicol 2014;65:185-95.
[Crossref] [Google Scholar] [PubMed]
- Ou S, Kwok KC. Ferulic acid: Pharmaceutical functions, preparation and applications in foods. J Sci Food Agric 2004;84(11):1261-9.
- Sri Balasubashini M, Rukkumani R, Menon VP. Protective effects of ferulic acid on hyperlipidemic diabetic rats. Acta Diabetol 2003;40(3):118-22.
[Crossref] [Google Scholar]`
- Barham D, Trinder P. An improved colour reagent for the determination of blood glucose by the oxidase system. Analyst 1972;97(1151):142-5.
[Crossref] [Google Scholar] [PubMed]
- Richmond W. Preparation and properties of a cholesterol oxidase from Nocardia sp. and its application to the enzymatic assay of total cholesterol in serum. Clin Chem 1973;19(12):1350-6.
[Crossref] [Google Scholar] [PubMed]
- Okada M, Matsui H, Ito Y, Fujiwara A, Inano K. Low-density lipoprotein cholesterol can be chemically measured: A new superior method. J Lab Clin Med 1998;132(3):195-201.
[Crossref] [Google Scholar] [PubMed]
- Izawa S, Okada M, Matsui H, Horita Y. A new direct method for measuring HDL-cholesterol which does not produce any biased values. J Med Pharm Sci 1997;37(7):13852-81.
- Schettler G, Nussel E. Determination of triglycerides. ARB Med SO2 Med Prav Med 1975;10:25-8.
- Walawalkar PS, Serai PS, Iyer KR. Isolation and catalytic competence of different animal liver microsomal fractions prepared by calcium-aggregation method. Indian J Pharm Sci 2006;68(2):262-5.
- Lowry OH, Rosebrough NJ, Farr AL, Randall RJ. Protein measurement with the Folin phenol reagent. J Biol Chem 1951;193(1):265-75.
[Crossref] [Google Scholar] [PubMed]
- Carleton HM, Drury RA, Wallington EA. Carleton’s histological technique. New York, USA: Oxford University Press; 1980. p. 41-54.
- Jain PG, Surana SJ. Isolation, characterization and hypolipidemic activity of ferulic acid in high-fat-diet-induced hyperlipidemia in laboratory rats. EXCLI J 2016;15:599-613.
- Miller A, Majauskaite L, Engel KH. Enzyme-catalyzed hydrolysis of γ-oryzanol. Eur Food Res Technol 2004;218(4):349-54.
- Kim HK, Jeong TS, Lee MK, Park YB, Choi MS. Lipid-lowering efficacy of hesperetin metabolites in high-cholesterol fed rats. Clin Chim Acta 2003;327(1):129-37.
[Crossref] [Google Scholar] [PubMed]
- Kesh SB, Sikder K, Manna K, Das DK, Khan A, Das N, et al. Promising role of ferulic acid, atorvastatin and their combination in ameliorating high fat diet-induced stress in mice. Life Sci 2013;92(17):938-49.
[Crossref] [Google Scholar] [PubMed]


