B. Yilmaz* and S. Kaban
Department of Analytical Chemistry, Faculty of Pharmacy, Ataturk University, 25240, Erzurum, Turkey
- *Corresponding Author:
- B. Yilmaz
Department of Analytical Chemistry, Faculty of Pharmacy
Ataturk University, 25240, Erzurum, Turkey
E-mail: yilmazb@atauni.edu.tr
Received date: 01 Oct 2015; Revised date: 31 May 2016; Accepted date: 08 Jun 2016
Abstract
A simple and rapid electrochemical methods for the determination of atorvastatin in pharmaceutical preparations was developed. The anodic peak at 1.07 V obtained in a buffer on glassy carbon electrode was used for analysis. The peak current and peak potential depends on pH, scan rate and initial potential. Decrease of the anodic peak with increasing pH, as well as deviations from linear plots of ip = f(C) and ip = kv1/2 indicate that this peak at higher concentrations is affected by adsorption-desorption phenomena. The calibration curves were linear for atorvastatin at the concentration range of 1-50 µg/ml or square wave and differential pulse voltammetry methods, respectively. Intra and interday precision values for atorvastatin were less than 3.17, and accuracy (relative error) was better than 1.93%. The mean recovery of atorvastatin was 100.4% for pharmaceutical preparations. Limits of detection were 0.3 µg/ml and 0.2 µg/ml for square wave and differential pulse voltammetry, respectively. Developed methods in this study are accurate, precise and can be easily applied to Ator, Cholvast and Lipitor tablets as pharmaceutical preparation.
Keywords
Atorvastatin, cyclic voltammetry, square wave voltammetry, differential pulse voltammetry, glassy carbon electrode
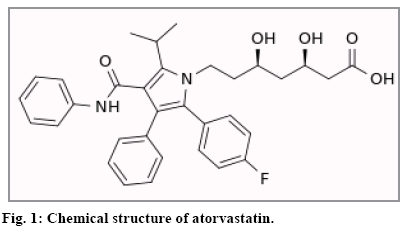
Atorvastatin, (Fig. 1) an antihyperlipoproteinemic drug, inhibits 3-hydroxy-3-methylglutaryl coenzyme A (HMG-CoA) reductase, a key enzyme in the biosynthesis of cholesterol[1,2]. Using of atorvastatin leads to reducing the total cholesterol, low-density lipoprotein cholesterol[3], apo-B[4], triglycerides levels[5], and C-reactive protein (CRP)[6] as well as increasing high density lipids (HDL) levels. This drug also stabilizes plaque and prevents risk of strokes, heart attack or other heart complications through antiinflammatory and other mechanisms.
Several methods have been reported for the determination of atorvastatin in pharmaceutical formations and in biological fluids including reversedphase high performance liquid chromatography (RPHPLC)[ 7,8], liquid chromatography tandem mass spectrometry (LC-MS)[9], high performance liquid chromatography (HPLC)[10] and spectrophotometry[11,12]. There are some problems encountered in using such methods. Spectrophotometric methods suffer from low sensitivity. Chromatographic methods are relatively slow and expensive and they require derivatization or time consuming extraction procedures. Thus, the use of simpler, faster and less expensive, but still sensitive electrochemical techniques can be considered as a useful alternative. Different methods are reported on the electrooxidation and determination of atorvastatin, including adsorptive stripping voltammetry using glassy carbon electrode (GCE)[13,14], cyclic and differential pulse voltammetry (DPV) at a carbon paste electrode (CPE) in the presence of an enhancing agent, cetyltrimethyl ammoniumbromide (CTAB)[1] and DPV using boron-doped diamond electrode and GCE[15].
Since the development of modern computer-based electrochemical instrumentation, electroanalytical techniques, especially modern pulse techniques, such as differential pulse voltammetry and square wave voltammetry have been used for the sensitive determination of a wide range of pharmaceuticals, due to their simplicity, low cost and relatively short analysis time. Because, these methods are less sensitive to matrix effects than other analytical techniques, the sensitive determination of drugs in complex biological fluids is possible without time-consuming extraction procedures being necessary before the voltammetric measurement. The use of carbon based electrodes for electroanalysis has gained popularity in recent years because of their applicability to the determination of substances that undergo oxidation reactions[16].
In the first part of the present study, electrochemical behavior of this compound at a GCE was investigated using cyclic, linear sweep, DPV and square wave voltammetry (SWV). In the second part, the determination of atorvastatin in pharmaceutical preparations was investigated using the glassy carbon electrode and DPV and SWV voltammetry. The proposed methods in this study are accurate, sensitive, and precise and can be easily applied to Ator, Cholvast and Lipitor tablets as pharmaceutical preparation. The results obtained by the methods were statistically compared.
Materials And Methods
Atorvastatin was purchased from Fluka (Buchs, Switzerland). Ator, Cholvast and Lipitor tablets were obtained from pharmacy (Erzurum, Turkey). A stock solution of 100 μg/ml was prepared by dissolving the compound in methanol. 0.5 M H2SO4, 0.2 M phosphate buffer between pH 2 and 12, 0.04 M Britton-Robinson buffer between pH 2 and 12 and 0.2 M acetate buffer between pH 3.5 and 5.7 were used as the supporting electrolytes.
Standard solutions were prepared by serial dilution of the stock solution with selected supporting electrolyte. The calibration curve for DPV and SWV analysis was constructed by plotting the peak current against the atorvastatin concentration. The ruggedness and precision were checked at different days, within day and between days. Relative standard deviations were calculated to check the ruggedness and precision of the method[17,18]. The precision and accuracy of analytical methods are described in a quantitative fashion by the use of relative errors (bias %). One example of relative error is the accuracy, which describes the deviation from the expected results. All solutions were kept in the dark in a refrigerator and were used within several hours to avoid hydrolysis. However, voltammograms of the sample solutions recorded 72 h after preparation did not show appreciable change in assay values.
Voltammetric measurements were obtained with Gamry Potentiostat Interface 1000 controlled with software PHE 200 and PV 220. A three electrode cell system was used a glassy carbon electrode (Φ=3 mm, BAS) as working electrode and an Ag/AgCl (KCl 3M, BAS) electrode as the reference electrode. All the results in the figures are presented in respect to the Ag/AgCl, 3M KCl reference electrodes. Before each experiment, the glassy carbon surface was polished with polishing alumina (prepared from 0.01 μm aluminium oxide) on alumina polish pad then rinsed with purified water.
All pH measurements were made with Model 538 pH meter (WTW, Austria), calibrated with standard buffers (Fixanal, Riedel-deHaen, Germany) at room temperature. All measurements were carried out at ambient temperature of the laboratory (22-25°).
For analytical application, the following parameters being employed: DPV pulse amplitude 50 mV, pulse width 50 ms, scan rate 20 mV/s; SWV pulse amplitude 25 mV, frequency 15 Hz, potential step 4 mV. Cyclic voltammetry: The initial and final potential were variable, depending on the pH value and the cut-off the electrolyte. Scan rate measurements in the range 0.01- 1.0 V/s.
Procedure for pharmaceutical preparations:
A total 10 tablets of atorvastatin (Ator, Cholvast or Lipitor) were accurately weighed and powdered. An amount of this powder corresponding to one tablet atorvastatin content was weighed and accurately transferred into 100 ml calibrated flask and 50 ml of 0.04 M Britton-Robinson buffer (pH 3) containing 10% methanol was added and then the flask was sonicated to 10 min at room tempature. The flask was filled to volume with 0.04 M Britton-Robinson buffer (pH 3) containing 10% methanol. The resulting solutions in both the cases were filtered through Whatman filter paper no 42 and suitably diluted to get final concentration within the limits of linearity for the respective proposed method. The drug content of atorvastatin tablet was calculated from the current potential curve.
Results And Discussion
Atorvastatin yields in solution between pH 2 and 12 a main anodic peak which is accompanied by a smaller peak at more negative potentials. The main peak was the best developed and suitable for analytical purposes in solution of sulphuric acid and in buffer solutions at pH<4. Absence of a cathodic peak on reverse sweep at pH 3.0 indicates irreversibility of the electrode process. Decrease of the main anodic peak with repeated cycling indicates filming of the electrode by an adsorbed product. The potential of the main anodic peak in shifted with increasing pH to less positive potentials (fig. 2a) with dEp=1030.4-30.45 mV/pH (R2=0.99 between pH 2 and 12). That indicates participation of a proton transfer in the electrode process. Dependence of peak currents on pH (fig. 2b) presents a more complex situation: whereas in Britton-Robinson buffers the peak current increases gradually from 2 to 12, in simple acetate and phosphate buffers the current reaches a limiting value at about pH 4 and decreases with further decrease in pH (fig. 2b). The solution pH influenced the peak current considerably. The peak current decreased linearly with the increase in pH of solution. So, the buffer solution with pH 3.0 was selected for further experiments.
As a general rule, a base is more easily oxidized than its conjugate acid. Thus anodic waves controlled by the rate of formation of the basic form from the conjugate acid, reach the diffusion controlled limiting value at sufficiently high pH value, when all electroactive species in present in the basic form. In such cases the anodic current decreases with decreasing pH. As in the present case the peak current oppositely increases with decreasing pH, the observed dependence cannot be attributed to the oxidation of the basic form of atorvastatin. The observed dependence of ip=f(pH) for atorvastatin can then be attributed to a difference in adsorption of its acidic and basic form. The role of adsorption is further supported by the sharp form of the main anodic peak and by the dependence of the peak current on scan rate (v). For diffusion current the plot of log ip as a function of log v should have a slope of 0.5 and for a purely adsorption current a slope of 1.0.
The observed value the slope of such plot of 0.62 indicates a strong role of adsorption in a solution containing 30 μg/ml atorvastatin. The peak potential is shifted to more negative values by 30 V per decade of the sweep rate, but is independent of concentration of atorvastatin. All this indicates that the main anodic peak of atorvastatin does not correspond to oxidation, but rather to an adsorption-desorption process. This difference can be attributed to an orientation of atorvastatin molecule at the electrode surface, which does not allow an electron transfer. The adsorption of the atorvastatin molecule seems to occur in a fashion that the long side chain of atorvastatin is attached to the surface of the carbon electrode.
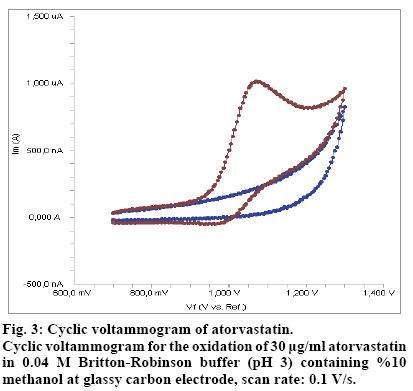
The best results with respect to signal enhancement and peak shape accompanied by sharper response was obtained with BR buffer at pH 3.0. This supporting electrolyte was chosen for the subsequent experiments. The electrochemical behavior of atorvastatin was investigated at glassy carbon electrode in 0.04 M Britton-Robinson buffer (pH 3) containing 10% methanol as the supporting electrolyte by using cyclic voltammetry (CV). Fig. 3 shows a typical cyclic voltammogram of 30 μg/mL atorvastatin recorded under these conditions for the scan rate of 0.1 v /s. In the anodic sweep, an oxidation peak is seen at about potential of 1.07 V.
In order to develop a voltammetric method for determination of the atorvastatin, we selected the DPV and SWV techniques, since the peaks were sharper and better defined at lower concentration of atorvastatin than those obtained by cyclic and linear sweep voltammetry with a lower background current, resulting in improved resolution. DPV and SWV are effective and rapid electroanalytical techniques with well-established advantages, including good discrimination against background currents and low detection and determination limits[19-21].
The validation was carried out by establishing specificity, linearity, accuracy, precision, limit of detection (LOD), limit of quantification (LOQ), recovery, ruggedness according to ICH Q2B recommendations[22].
Excipients (corn starch, magnesium stearate, lactose, sodium lauryl sulfate, polyethyleneglycol 6000, titanium dioxide, carboxymethylcellulose, hydroxypropylmethylcellulose and talc) were added to the drug for recovery studies, according to the manufacturer’s batch formulas for 30 mg atorvastatin per tablet. The mean percentage recovery of 30 μg/ ml atorvastatin showed no significant excipient interference; thus the procedures were able to assay atorvastatin in the presence of excipients, and hence it can be considered specific.
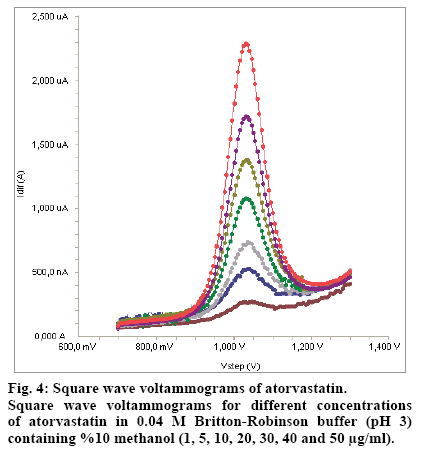
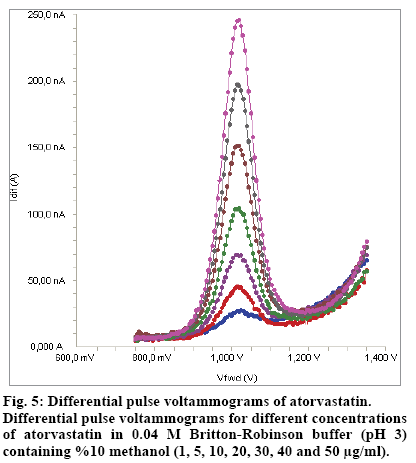
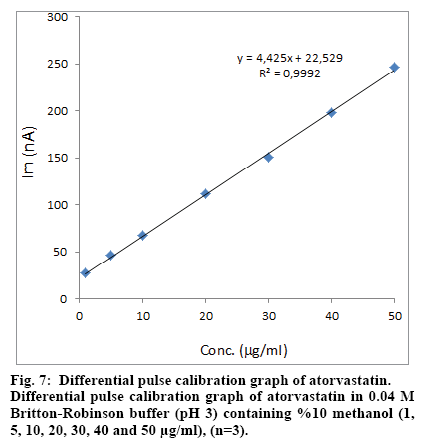
Standard solutions were prepared as 1-50 μg/ml (1, 5, 10, 20, 30, 40 and 50 μg/ml) for SWV and DPV (Fig. 4 and 5), respectively. Calibration curves were constructed for atorvastatin standard by plotting the concentration of compound versus peak current responses.
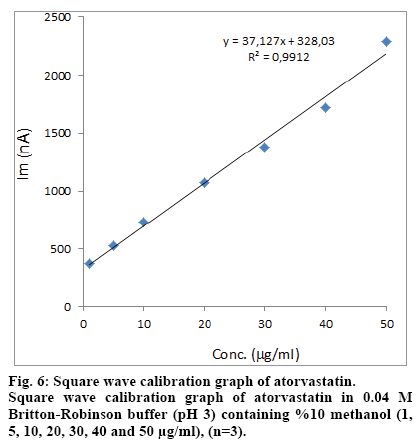
The calibration curves were evaluated by its correlation coefficients. The correlation coefficients (R) of all the calibration curves were consistently greater than 0.99 (Figs. 6 and 7). The linear regression equations were calculated by the least squares method using Microsoft Excel® program and summarized in Table 1.
| Method | Range(µg/ml) | LR | R2 | LOD (µg/ml) |
LOQ (µg/ml) |
|---|---|---|---|---|---|
| SWV | 1-50 | y=31.127x+328.03 | 0.9912 | 0.3 | 0.9 |
| DPV | 1-50 | y=4.425x+22.529 | 0.9992 | 0.2 | 0.6 |
aBased on three calibration curves, LR: Linear regression, R2: Coefficient of correlation, y: Peak current, x: atorvastatin concentration, LOD: Limit of detection, LOQ: Limit of quantification
TABLE 1: LINEARITY OF ATORVASTATIN
Accuracy of the assay methods was determined for both intra-day and inter-day variations using the six times analysis of the QC samples. Repeatability refers to the use of the analytical procedure within a laboratory over a short period of time that was evaluated by assaying the QC samples during the same day. Intermediate precision was assessed by comparing the assays on different days (3 days). The intra-day accuracy ranged from -1.28% to 1.93% and precision from 2.01% to 3.17%. The results obtained from intermediate precision (inter-day) also indicated a good method precision.
The LOD and LOQ of atorvastatin by the proposed methods were determined using calibration standards. LOD and LOQ values were calculated as 3.3 σ/S and 10 σ/S, respectively, where S is the slope of the calibration curve and σ is the standard deviation of y-intercept of regression equation (n=3)[22]. The LOD and LOQ values of the methods were summarized in Table 1.
To determine the accuracy of the SWV and DPV methods and to study the interference of formulation additives, the recovery was checked as three different concentration levels. Analytical recovery experiments were performed by adding known amount of pure drugs to pre-analyzed samples of commercial tablet forms. The recovery values were calculated by comparing concentration obtained from the spiked samples with actual added concentrations. These values are also listed in Table 2.
| Pharmaceuticalpreparation | Added (µg/ml) | SWV | DPV | ||||
|---|---|---|---|---|---|---|---|
| Found±SD | Recovery (%) |
RSDa (%) |
Found±SD | Recovery (%) |
RSDa (%) |
||
| Ator (5 μg/ml) |
5 | 4.9±0.11 | 98.0 | 2.24 | 5.1 ±0.22 | 102.0 | 4.31 |
| 15 | 14.9±0.23 | 99.3 | 1.54 | 14.7±0.34 | 98.0 | 2.31 | |
| 35 | 35.1±0.93 | 100.3 | 2.65 | 35.9±1.24 | 102.6 | 3.45 | |
| Cholvast (5 μg/ml) |
5 | 4.8±0.20 | 96.0 | 4.17 | 4.9±0.13 | 98.0 | 2.65 |
| 15 | 14.5±0.29 | 96.7 | 2.00 | 14.8±0.27 | 98.7 | 1.82 | |
| 35 | 35.6±1.12 | 101.7 | 3.14 | 35.6±1.02 | 101.7 | 2.87 | |
| Lipitor (5 μg/ml) |
5 | 5.1±0.18 | 102.0 | 3.53 | 5.2±0.21 | 104.0 | 4.04 |
| 15 | 14.8±0.25 | 98.7 | 1.69 | 14.6±0.28 | 97.3 | 1.92 | |
| 35 | 35.2±1.67 | 100.6 | 4.74 | 35.4±0.73 | 101.1 | 2.06 | |
SD: Standard deviation of six replicate determinations, RSD: Relative standard deviation, aAverage of six replicate determinations
TABLE 2: RECOVERY OF ATORVASTATIN IN PHARMACEUT?CAL PREPARATIONS BY PROPOSED METHODS
In this study, the SWV and DPV determination of atorvastatin were carried out by a different analyst in same instrument with the same standard. The results showed no statistical differences between different operators suggesting that the developed method was rugged.
To evaluate the stability of atorvastatin, standard solutions were prepared separately at concentrations covering the low, medium and higher ranges of calibration curve for different temperature and times. These solutions were stored at room temperature, refrigeratory (4°) and frozen (–20) temperature for 24 h and 72 h. Stability measurements were carried out with SWV and DPV method. The results were evaluated comparing these measurements with those of standards and expressed as percentage deviation and atorvastatin was found as stable at room temperature, 4 and –20° for at least 72 h.
Voltammetry has been recently proposed as a promising new analytical method for electrochemical detection of drugs. Owing to the high sensitivity, low cost, simplicity of instrumentation and short analysis time voltammetric techniques are important methods for pharmaceutical analysis[23,24].
SWV and DPV voltammetry methods were applied for the determination of the commercial tablets (Table 3). The results show that high reliability and reproducibility of two methods. The best results were statistically compared using the t-test. At 95% confidence level, the calculated t-values do not exceed the theoretical values (Table 3). Therefore, there is no significant difference between SWV and DPV voltammetry methods.
| Parameters | SWV | DPV | Reported method[12] | Reported method[13] |
|---|---|---|---|---|
| Mean (recovery %) | 99.91 | 100.85 | 99.81 | 100.5 |
| SD | 0.616 | 1.81 | - | - |
| % RSD | 0.617 | 1.79 | 1.48 | 0.64 |
| Variance | 0.697 | 3.20 | - | - |
| SE | 0.251 | 3.18 | - | - |
| t-test (2.228)a | 0.921 | - | - | |
| F-test (5.1)a | 4.05 | - | - |
SD: Standard deviation of six replicate determinations, RSD: relative standard deviation, SE: standard error, aTheoretical values, Theoretical values at P=0.05, Ho hypothesis: no statistically significant difference exists between four methods, Ft>Fc: Ho hypothesis is accepted (P>0.05)
TABLE 3: COMPARISON OF THE PROPOSED AND REPORTED METHODS FOR DETERMINATION OF ATORVASTATIN
As mentioned earlier in the introduction section, an electrochemical method has been reported for the voltammetric determination of atorvastatin, at a CPE in the presence of an enhancing agent, CTAB using CV and DPV[1]. Adsorptive stripping voltammetry has been used for the electrochemical determination of atorvastatin on the surface of GCE in two reports[13,14]. Also the electrochemical behavior of atorvastatin at glassy carbon and boron-doped diamond electrodes has been studied using voltammetric techniques[15]. Response characteristics of these previous reports and the present study are shown in Table 4. In comparison to the previous works, the present work exhibits high sensitivity, long time stability of the electrode response, good repeatability and reproducibility together with the simple procedure.
| Electrode | Linear range | LODa | Reference |
|---|---|---|---|
| CPE in the presence of CTAB | 0.05-10 μM | 4.08 nM | [1] |
| GCE | 1.0×10⁻⁷–5.0×10⁻⁶ M | 6.55×10⁻⁸M | [13] |
| GCE | 3.5×10⁻⁸–4.6×10⁻⁷M | 4.0 nM | [14] |
| GCE boron-doped diamond electrode | 9.65×10⁻⁷–3.86×10⁻⁵M | 2.11×10⁻⁷M | [15] |
| Spectrophotometry | 20-100 μg/ml | 1.80 μg/ml | [12] |
| GCE | 1-50 μg/ml (1.79×10⁻⁷–8.95×10⁻⁵M) |
0.20 μg/ml (3.54×10⁻⁷M) | This work |
aLOD: limit of detection
TABLE 4: COMPARISON OF ANALYTICAL PARAMETERS OF TH?S WORK WITH THOSE PREVIOUSLY REPORTED IN THE LITERATURE
The voltammetric anodic peak of atorvastatin at pH 2-12 most probably is due to an adsorption-desorption process. The electrochemical process is irreversible and pH dependent. A validated differential pulse and square wave voltammetric procedure was developed and successfully applied to the estimation of atorvastatin in solution and pharmaceutical preparation samples.
DPV and SWV are effective and rapid electroanalytical techniques with well-established advantages, including good discrimination against background current and low detection limits[21]. Two calibration graphs from the bulk solution of atorvastatin according to the procedures described above were constructed by using DPV and SWV. And these methods are requiring less than 3 min to run samples.
A comparison with an official reference determination method has not been possible in any pharmacopeias, because so far no other procedure for the quantitation of atorvastatin from pharmaceutical formulations has been reported. For this reason, proposed method was compared with the literature method[1,13-15]. Table 4 compares the results of the analysis of atorvastatin between proposed and previous reports method. However, the proposed method is sensitive, selective and more precise than the previous reports.
In conclusion, in this study, the electrochemical behavior of atorvastatin has been studied in 0.04 M Britton-Robinson buffer (pH 3) containing %10 methanol by cyclic voltammetry method. It has concluded that there is a completely diffusion-controlled current process which is not affected by adsorption phenomenon. Besides, in the present report, a simple, rapid, sensitive, reliable, specific, accurate and precise SWV and DPV methods for the determination of atorvastatin in pharmaceutical preparations were developed and validated. The method described has been effectively and efficiently used to analyze atorvastatin pharmaceutical tablets without any interference from the pharmaceutical excipients. Therefore, the methods can be used effectively without separation for routine analysis of atorvastatin in pure form and its formulations.
Financial support and sponsorship:
This study was supported by a grant from Ataturk University Research Foundation (Project no: 2013/268).
Conflicts of interest:
There are no conflicts of interest.
References
- Abbar JC, Nandibewoor ST. Voltammetric oxidation and determination of atorvastatin based on the enhancement effect of cetyltrimethyl ammonium bromide at a carbon paste electrode. Colloids Surf B 2013;106:158-64.
- Bakker-Arkema RG, Best J, Fayyad R, Heinonen TM, Marais AD, Nawrocki JM, et al. A brief review paper of the efficacy and safety of atorvastatin in early clinical trials. Atherosclerosis 1997;131:17-23.
- Nissen SE, Nicholls SJ, Sipahi I, Libby P, Raichlen JS, Ballantyne CM, et al. Effect of very high-intensity statin therapy on regression of coronary atherosclerosis: the asteroid trial. J Am Med Assoc 2006; 295:1556-65.
- Nawrocki JW, Weiss SR, Davidson MH, Sprecher DL, Schwartz SL, Lupien PJ, et al.Reduction of LDL cholesterol by 25% to 60% in patients with primary hypercholesterolemia by atorvastatin, a new HMG-CoA reductase inhibitor. ArteriosclerThrombVascBiol 1995;15:678-82.
- Bakker-Arkema RG, Davidson MH, Goldstein RJ, Davignon J, Isaacsohn JL, Weiss SR, et al.Efficacy and safety of a new HMG-CoA reductase inhibitor, atorvastatin, in patients with hypertriglyceridemia. J Am Med Assoc 1996;275:128-33.
- Ozaki K, Kubo T, Imaki R, Shinagawa H, Fukaya H, Ohtaki K, et al. The anti-atherosclerotic effects of lipid lowering with atorvastatin in patients with hypercholesterolemia. J AtherosclerThromb 2006;13:216-9.
- Al-Akkam EJ, Abdul Rasool AA, Badwan AA, Al-Jbour ND, Qinna NA. Development and validation of a sensitive and accuratemethod for determination of atorvastatin and rosuvastatin in rat plasma by reversed-phase high performance liquid chromatography with UV detection. Int J Pharm PharmSci 2013;5:211-9.
- Dangre SC, Shah SK, Suruse PB, Bhusari KP. Development of RP-HPLCmethod for simultaneous estimation of atorvastatin calcium and clopidogrelbisulphate in a pharmaceutical capsule dosage form. Res J Pharm Technol 2012;5:641-4.
- Rukthong P, Sangvanich P, Kitchaiya S, Jantratid E, Sathirakul K. The quantitation of atorvastatin in human plasma by solid phase micro-extraction followed by LC-MS/MS and its application to pharmacokinetics study. J SciTechnol 2013;35:41-50.
- Kotagiri H, Gannu R, Palem CR, Yamsani SK, Yamsani VV, Yamsani MR. Simultaneous determination of glimepiride and atorvastatin in human serum by high-performance liquid chromatography: application to pharmacokinetic study. J LiqChromatogrRelatTechnol 2011;34:2420-32.
- Baghdady YZ, Al-Ghobashy MA, Abdel-Aleem AAE, Weshahy SA. Spectrophotometric and TLC-densitometric methods for the simultaneous determination of ezetimibe and atorvastatin calcium. J Adv Res 2013;4:51-9.
- Bernard S, Mathew M. Spectrophotometric method of estimation of atorvastatin calcium using sulfo-phospho-vanillin reaction. J Appl Pharm Sci 2012;2:150-4.
- Eskikoy D, Durmus Z, Kilic E. Electrochemical oxidation of atorvastatin and its adsorptive stripping determination in pharmaceutical dosage forms and biological fluids. Collect CzechoslovChemCommun 2011;76:1633-49.
- Erk N. Development of electrochemical methods for determination of atorvastatin and analytical application to pharmaceutical products and spiked human plasma. Crit Rev Anal Chem 2004;34:1-7.
- Dogan-Topal B, Uslu B, Ozkan SA. Investigation of electrochemical behavior of lipid lowering agent atorvastatin calcium in aqueous media and its determination from pharmaceutical dosage forms and biological fluids using boron-doped diamond and glassy carbon electrodes. Comb Chem High Throughput Screen 2007;10:571-82.
- Uslu B, Ozkan SA, Senturk Z. Electrooxidation of the antiviral drug valacyclovir and its square-wave and differential pulse voltammetric determination in pharmaceuticals and human biological fluids. Anal ChimActa 2006;555:341-7.
- Riley CM, Rosanske TW. Development and Validation of Analytical Methods. New York: Elsevier Science Ltd; 1996.
- Swartz ME, Krull IS. Analytical Method Development and Validation. New York: Marcel Dekker; 1997.
- Wang J, Editor. Analytical Electrochemistry, 2nd ed. New York: Wiley/VCH Publishers; 2000.
- Kissenger PT, Heineman WR. (Eds.), Laboratory Techniques in Electroanalytical Chemistry, 2nd ed. New York: Marcel Dekker; 1997.
- Wang J, Editor. Electroanalytical Techniques in Clinical Chemistry and Laboratory Medicine, New York: VCH Publishers; 1996.
- The European Agency for the Evaluation of Medicinal Products. ICH Topic Q2B Note for Guideline on Validation of Analytical Procedures: Methodology GPMP/ICH/281/95, 1996.
- El-Hefnawey GB, El-Hallag IS, Ghoneim EM, Ghoneim MM. Voltammetric behavior and quantification of the sedative-hypnotic drug chlordiazepoxide in bulk form, pharmaceutical formulation and human serum at a mercury electrode. J Pharm Biomed Anal 2004;34:75-86.
- Corti P, Corbini G, Gratteri P, Furlanetto S, Pinzauti S. Determination of some quinolones in tablets, human plasma and urine by differential-pulse polarography. Int J Pharm 1994;111:83-7.
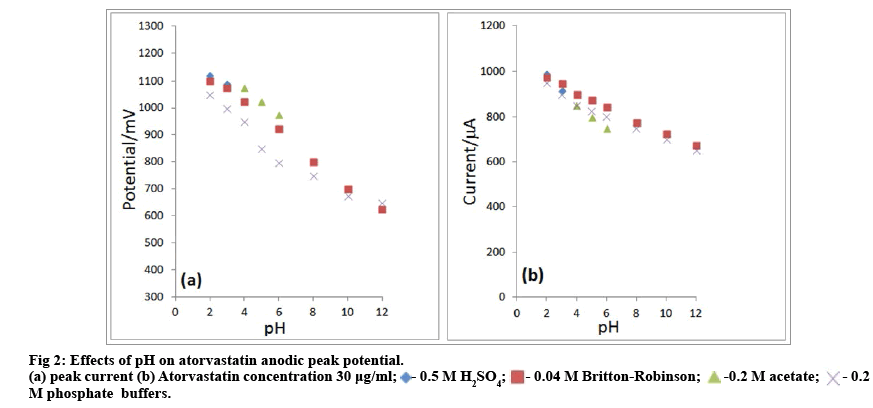
 - 0.5 M H2SO4;
  - 0.04 M Britton-Robinson;
  -0.2 M acetate;
  - 0.2 M phosphate buffers.