- *Corresponding Author:
- V. Radhakrishnan
Department of Biochemistry,
VRR Institute of Biomedical Science (Affiliated to University of Madras),
Chennai 600056
E-mail: drrvijayaraghavan@gmail.com
| Date of Received | 25 February 2020 |
| Date of Revision | 12 July 2021 |
| Date of Acceptance | 01 October 2021 |
| Indian J Pharm Sci 2021;83(5):989-999 |
This is an open access article distributed under the terms of the Creative Commons Attribution-NonCommercial-ShareAlike 3.0 License, which allows others to remix, tweak, and build upon the work non-commercially, as long as the author is credited and the new creations are licensed under the identical terms
Abstract
In this study we intended to perform in silico and in vitro analysis of naturally derived flavonoid, hesperetin as a promising mammalian target of rapamycin inhibitor. This study features in silico screening of natural compound hesperetin against mammalian target of rapamycin FK506 binding proteins 12 domain by using Schrodinger glide based virtual screening and further molecular dynamics simulation was done to infer the stability of complex formation. Mammalian target of rapamycin co-crystallized with P2X (a known inhibitor of mTOR) (Protein Data Bank ID: 4JT5) was used for reference guided docking protocol. Then in vitro analysis applying hesperetin for cell viability followed by protein expressions in ovarian PA-1 and MCF-7 breast cancer cell lines were performed dose dependently. in silico molecular docking and dynamic studies with mammalian target of rapamycin protein revealed that hesperetin was found to be a potent compound that could inhibit the FK506 binding proteins 12 domain of mammalian target of rapamycin. The in vitro studies with hesperetin on PA-1 and MCF-7 breast cancer cell lines, found that hesperetin in a dose dependent manner significantly reduced the phosphorylation of mammalian target of rapamycin on Serine 2448 a marker for mammalian target of rapamycin complex 1 activity, as well as phosphorylation of eukaryotic translation initiation factor 4E binding protein 1 and Ribosomal protein S6 kinase beta-1 which are downstream molecules of mammalian target of rapamycin was also significantly inhibited. To the best of our knowledge this is the first study that brings up the scientific evidence for the efficacy of hesperetin in inhibiting mammalian target of rapamycin with a similar docking score to the native ligand and also in a dose dependent manner in PA-1 human ovarian cancer cells and MCF-7 breast cancer cells, as an anticancer agent with further studies in near future.
Keywords
Hesperetin, mammalian target of rapamycin, FK506 binding proteins 12, docking, molecular dynamics, eukaryotic translation initiation factor 4E-binding protein 1, ribosomal protein S6 kinase beta-1 anticancer
Cancer constitutes a heterogeneous group of diseases featuring abnormal cell proliferation beyond control and is one of the leading causes of death worldwide. It is characterized by its hallmarks including sustained growth signals, escape from growth suppressors, allowing replicative immortality, upregulating invasion, metastasis and angiogenesis, developing resistance from cell death, evasion of immune destruction and reprogrammed metabolism [1]. Breast and prostate cancer constitute a major portion of cancer in women and men, respectively [2]. Mutation in vital genes often leads to disturbance in cell cycle and leads to proliferation which forms the basis of cancer [3]. One of the key molecules in cell growth and differentiation is mTOR (mammalian target of rapamycin) and is implicated in various solid tumors [4]. Activation of mTOR signaling is associated with the various hallmarks of cancer processes, thus making mTOR a promising target for treating cancer.
mTOR is an evolutionarily conserved serine/threonine kinase that belongs to the Phosphatidylinositol 3-kinase (PI3K)-related kinase (PIKK) family, which integrates a variety of exogenous signals to coordinate numerous cellular processes, that includes cell growth and metabolism [4-6]. It is known to form two complexes, mTOR complex 1 (mTORC1) and 2 (mTORC2), which regulates protein synthesis and cytoskeletal function, respectively [7,8]. mTORC1 regulates nutrient and energy supply, related to several growth factor signals, essential for cell growth and also regulates autophagy [9,10]. mTORC2 functions primarily and mediates cytoskeletal organization moreover it also plays a significant role in cancer progression by facilitating cancer cell migration, invasion and metastasis [11,12]. When mTOR is deregulated and homeostasis is compromised, it implicates metabolic diseases like diabetes and cancer [13]. Therefore, mTOR inhibition has been considered as promising therapeutic strategy for cancer and metabolic diseases.
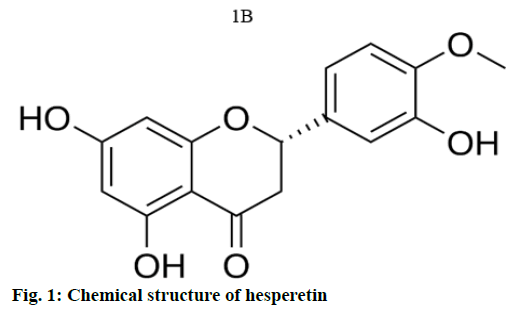
Currently, plant derived bioactive compounds are considered as an alternative and effective anticancer therapeutics for cancer treatment, as they are easily available and natural. Moreover they can be easily administered even orally and can also be a part of our dietary intake without causing any side effects [14,15]. In addition, as they are naturally derived compounds they are highly tolerant, with higher bioavailability and least toxicity. If these naturally derived compounds show effective cytotoxicity to cancer cells, these compounds can be considered as lead compounds for further therapeutic development. Among the various phenolic compounds, flavonoids such as hesperetin commonly found in citrus fruits are used in traditional Chinese medicine [16]. Hesperetin (3’,5,7-trihydroxy-4- methoxyflavonone), is known for its pharmacological functions such as anti-inflammatory, antihypertensive, antiatherogenic effects with higher antioxidant properties [17-19]. In addition, recent studies have reported that hesperetin might be a potent anticancer agent in various cancer types such as, colon, breast, prostate and cervical cancers [20-23]. Although the effect of hesperetin on some of the signaling pathways like Mitogen- Activated Protein Kinase (MAPK), Notch1 had been explored [24,25], the molecular mechanism on inhibiting PI3K/AKT/mTOR pathway have not been determined so far.
A previous in silico and in vitro study have reported the interaction of hesperetin on DNA binding domain of Nuclear factor kappa-light-chain-enhancer of activated B cells (NFκB) and thereby regulating apoptosis [24]. In order to determine whether hesperetin have same effect on mTOR signaling cascade, both in silico and in vitro approaches are implemented in this study (fig. 1).
Materials and Methods
Protein preparation:
The co-crystal structure of mTOR with co-crystallized ligand P2X (2- [4-amino-1-(propan-2-yl)-1H-pyrazolo [3,4-d]pyrimidin-3-yl]-1H-indol-5-ol) (PDB ID:4JT5) [26] was used as the structural template for molecular docking approach. In specific, the kinase domain (Val1869-Thr2346) of chain B was considered further and by using Protein Preparation Wizard of Schrödinger (New York, NY, USA) the domain was pre-processed and optimized. The structure was optimized by assigning proper bond order, removing steric clashes and by assigning the optimal protonation states for histidine residues and adjusting the chi rotation of asparagine, glutamine and histidine residues accordingly. Finally, the geometrically optimal structure obtained from energy minimization with OPLS_2005 (Schrödinger) was used for grid generation. Further, the active binding site residues; Leu2185, Lys2187, Asp2195, Tyr2225, Ile2237, Tyr2239, Val 2240, Met2345, Ile2356, Asp2357, Phe2358 was used for docking grid generation. In addition, 1.0 Ǻ for Van der Waals radii scaling factor and 0.25 Ǻ of partial cutoff was set to the receptor grid and proceeded for the virtual screening process.
Ligand preparation:
The structure of ligands hesperetin (Accession Number: DB01094) optimal 3-dimensional (3D) structures were generated using Ligprep Module, by fixing its ionization states, tautomer’s and other stereo chemical errors. Further, the optimal chiral forms of these structures were energy minimized using the OPLS 2005 force field and were used for docking against the kinase domain of mTOR.
Re-docking of P2X:
The P2X structure was retrieved from the co-crystallized crystal structure (PDB ID:4JT5) and were prepared and re-docked to the active cavity using Glide XP (Schrödinger, LLC, New York, NY), where the ligand sampling was set rigid. The binding affinity of P2X was calculated using Glide score and finally, the binding free energy of the complex was calculated using Prime Molecular Mechanics/Generalized Born Surface Area (MM/GBSA) [27]. Moreover, the interaction profile of the re-docked ligand with the mTOR kinase domain was analysed using Ligplot.
Docking:
The docking of the prepared ligands (Hesperetin) to the active cavity was carried out using Glide SP (standard precision). The binding affinity of the docked ligands was calculated using Glide score. Following which the binding free energy of the docked ligands were calculated using Prime MMGBSA (molecular Mechanics/Generalized Born Surface Area) (10.1016/j. lfs.2018.10.022). Further the interaction profile of the ligands with the mTOR kinase domain was analysed using Ligplot.
ADME studies:
The compounds clearing the absorption, distribution, metabolism and excretion filter (ADME) properties are known to surpass the clinical trials and emerge as best compound. Hence, in this study FAF Drug3.0 server [28] was used to predict the physicochemical properties that are essential for conferring the ADME properties like: Molecular weight (MW), predicted qualitative oral absorption and Lipinski’s rule of five [29].
Toxicity prediction:
Similarly, toxicity analysis is important criteria to determine the drug’s efficacy, the compounds toxicity prediction was carried out using FAF-Drug 3.0 server [29] for calculating properties such as drug likeness, Topological Polar Surface Area (TPSA), ClogP and solubility, mutagenic and tumorigenic effects.
Molecular Dynamics (MD) simulation:
MD simulation has become an indispensable tool in computational biology research towards understanding the dynamic behavior of molecular complexes and intermolecular interactions in physiologically simulated conditions [30-33]. Hence, in this study, we implemented explicit MD simulations using the Desmond package (Desmond MD System, version 3.1, D. E. Shaw Research, New York, NY, 2012; Maestro-Desmond Interoperability Tools, version 3.1, Schrödinger, New York, NY, 2012) with OPLS2005 as force field. The complete system for MD was build using predefined water model Simple Point Charge (SPC) as solvent in a cubic box (10 Å×10 Å×10 Å) dimension as periodic boundary. Further, to neutralize the system, Na+ counter ions were added. Implementing Steepest Descent and the limited-memory Broyden-Fletcher-Goldfarb- Shanno (LBFGS) algorithms, the complete system was energy minimized in a hybrid manner. Following which, the Isothermal-isobaric (NPT) ensemble was initiated and the production run was performed. The temperature was set to 300K and maintained throughout by implementing Nose–Hoover thermostat with the pressure set to 1.0 bar and maintained through Martyna–Tobias Klein pressure bath. Smooth Particle Mesh Ewald method implementing SHAKE algorithm was applied to analyze the electrostatic interactions with a cutoff value of 9.0 Å distance. Finally, the production run was carried out for 20 ns and the final trajectory sampling for analysis was recorded at an interval of 1.0 ps [34-36].
Maintenance of cell lines:
Ovarian cancer (PA-1) cells and MCF-7 breast cancer cells were obtained from National Centre for Cell Science (NCCS) (Pune, India) was maintained and grown in a humidified incubator at 37° with 5 % carbondioxide (CO2). Cells were grown as a monolayer in plastic tissue culture (T25) flasks in Dulbecco's Modified Eagle's Medium (DMEM) (Gibco, Grand Island, New York, USA). The medium was supplemented with 10 % Fetal Bovine Serum (FBS) (Gibco, Grand Island, New York, USA) and antibiotics (penicillin 50 IU/ml, streptomycin 3.5 μg/ml and gentamycin 2.5 μg/ml) (Gibco, Grand Island, New York, USA).
Treatment of cells:
Cells were seeded (at 2.5×10⁵/ml per 5 ml) in T25 flask and incubated for 3 d (to confluence) before treatment. On the day of treatment, cells were washed using 5 ml of sterile Phosphate Buffered Saline (PBS) and an appropriate culture medium containing the drug(s) of interest was added to the wells.
Cell viability assay:
Cell viability was determined by 3-(4,5-dimethylthiazol- 2-yl)-2,5-diphenyl-2H-tetrazolium bromide (MTT) assay. PA-1 and MCF-7 breast cancer cells (5×10³ cells/well) were seeded in 96-well culture plates. After overnight incubation, various concentrations of hesperetin were added to the cells for varying times followed by the addition of 20 μl MTT at 37° for 4 h. Optical Density (OD) was measured at 550 nm using an microplate reader (Bio Rad, CA, USA). Cell viability was expressed as a percentage of untreated cells.
Protein preparation and western blot analysis:
After 48 h of treatment the PA-1 cells and MCF-7 breast cancer cells were lysed with Radio-Immunoprecipitation Assay (RIPA) buffer, containing the protease inhibitor cocktail and sodium orthovanadate (Santa Cruz Inc., Dallas, TX, USA), for 30 min at 4° . Cell lysates were clarified by centrifugation at 4° for 10 min at 12 000 rpm and then protein concentrations were determined by using Bicinchoninic acid (BCA) protein assay method (Thermo Fisher Scientific, Grand Island, NY, USA). For the western blot analysis equal concentration of proteins were separated using Sodium Dodecyl Sulfate Polyacrylamide Gel Electrophoresis (SDSPAGE) and blotted onto a nitrocellulose membrane (GE Healthcare, Pittsburgh, PA, USA). After protein transfer the membranes were blocked using 4 % bovine serum albumin (BSA) and probed with specific antibodies for Phospho mTOR and p-p70S6K and β-actin was used as internal control (Santa Cruz Inc., Dallas, TX, USA). Finally, for the detection of specific proteins, the membranes were incubated in a solution containing chemiluminescent substrate. Densitometry analyses were performed using the ImageJ program.
Statistics analysis:
Data were represented as mean±standard error of the mean (SEM). Statistical significance was analysed using Analysis of Variance (ANOVA) and Dunnett’s multiple comparison test between the groups, using GraphPad Prism7.0 software package. p<0.05 was considered to be statistically significant all the experiments were done in triplicates.
Results and Discussion
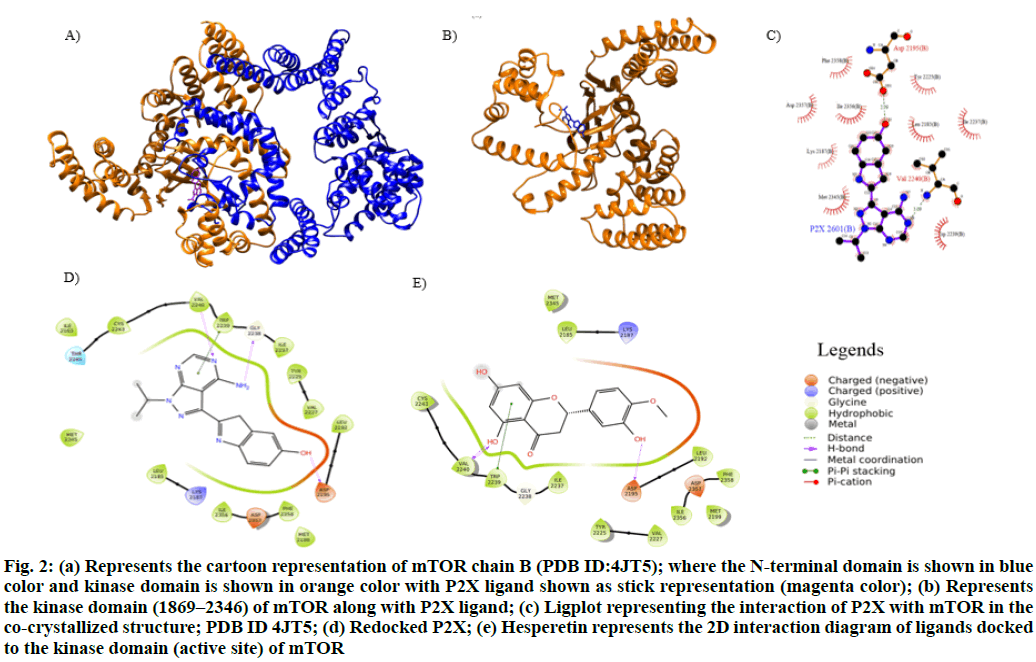
The crystal structure for mTOR was retrieved from PDB (PDB ID:4JT5, Resolution: 3.5 Å, R value: 0.271) (fig. 2a) and optimized using Schrödinger maestro. The structure of mTOR B chain consists of the N-terminal kinase domain and the kinase domain (1869–2346) (fig. 2b). The structure was found to be co-crystallized with P2X showing hydrogen bond interactions with Asp2195 and Val2240 (fig. 2c). The hinge region residues (2185–2360) of kinase domain consists of active site residues; Asp2195 and Val2240 which are noted to be critical for hydrogen-bond formation with inhibitors.
Figure. 2: (a) Represents the cartoon representation of mTOR chain B (PDB ID:4JT5); where the N-terminal domain is shown in blue color and kinase domain is shown in orange color with P2X ligand shown as stick representation (magenta color); (b) Represents the kinase domain (1869–2346) of mTOR along with P2X ligand; (c) Ligplot representing the interaction of P2X with mTOR in the co-crystallized structure; PDB ID 4JT5; (d) Redocked P2X; (e) Hesperetin represents the 2D interaction diagram of ligands docked to the kinase domain (active site) of mTOR
The re-docking of P2X to mTOR was performed using Glide XP mode. The docking results inferred synonymous interactions as observed in the cocrystal form. Similarly, hydrogen bonding of P2X to Asp2195, Val2240 and Gly2238 and a π-π interaction with Trp2239 in the active site of mTOR’s chain B was observed (fig. 2d). Further, Prime/MMGBSA score was observed to be -60 kcal/mol with docking score of -11.09 kcal/mol for re-docked pose (Table 1).
| S. No | Ligand | Glide score (kcal/mol) |
Prime/MM-GBSA (kcal/mol) |
|---|---|---|---|
| 1 | P2X | -11.019 | -60 |
| 2 | Hesperetin | -10.85 | -43.3 |
Table 1: Post Docking Analysis of The Compounds Based On Glide Score And Binding Free Energy
From Table 1, it can inferred the hesperetin compound has showed binding affinity of -10.85 kcal/mol approximately equal when compared to P2X (-11.09 kcal/mol). On comparing the Prime/MMGBSA score (Table 1), it was observed that hesperetin has binding free energy of -43.3 kcal/mol, which was significantly comparable to P2X (-60 kcal/mol). Moreover, based on the protein-ligand interaction profile analysis (fig. 2d), it was inferred that hesperetin compounds showed a strong hydrogen bond with Asp2195 and two hydrogen bonds with Val2240 which spans the hydrophilic cavity and being more specific to P2X and shall serve as specific inhibitor (fig. 2e). In addition hesperetin also showed a π-π interaction with the active cavity residue Trp2239.
Further, the compound hesperetin was subjected to in silico ADME predictions such compounds showing physico-chemical properties within the allowed range such as molecular weight (130-725 Da), Estimated number of hydrogen bonds (2.0-20.0), Estimated number of hydrogen bonds donors (0.0-6.0) Lipinski’s rule of five (max violation 4) are considered as potential leads. All compounds showed significant physico-chemical properties within the range of recommended range of computed descriptors representing ADME properties (Table 2). Similarly, the oral bio-availability was estimated using VEBER’S rule, wherein, the selected compound showed very good bioavailability (Table 3). Solubility index for the compounds were also calculated, which inferred P2X to have reduced solubility were as hesperetin have good solubility (Table 3).
| S. No | Ligand | MW | logP | logD | logSw | HB Donor | HB Acceptor | Rule of five |
|---|---|---|---|---|---|---|---|---|
| 1 | P2X | 308.34 | 2.01 | 2.09 | -3.23 | 4 | 7 | 0 |
| 2 | Hesperetin | 302.28 | 2.6 | 2.56 | -3.47 | 3 | 6 | 0 |
Table 2: Predicted Physico-Chemical Descriptors For Adme
| Oral bioavailability of compounds based on VEBER’S rule | FAF-Drug3 Prediction | ||||
|---|---|---|---|---|---|
| Ligand | No of rotatable bond | TPSA | Oral bioavailability (VEBER) | Solubility (mg/l) | Solubility forecast index |
| P2X | 2 | 105.64 | Good | 12227.2 | Reduced Solubility |
| Hesperetin | 2 | 96.22 | Good | 9436.21 | Good Solubility |
Table 3: Showing Oral Bioavailability and Solubility Predictions For The Compounds
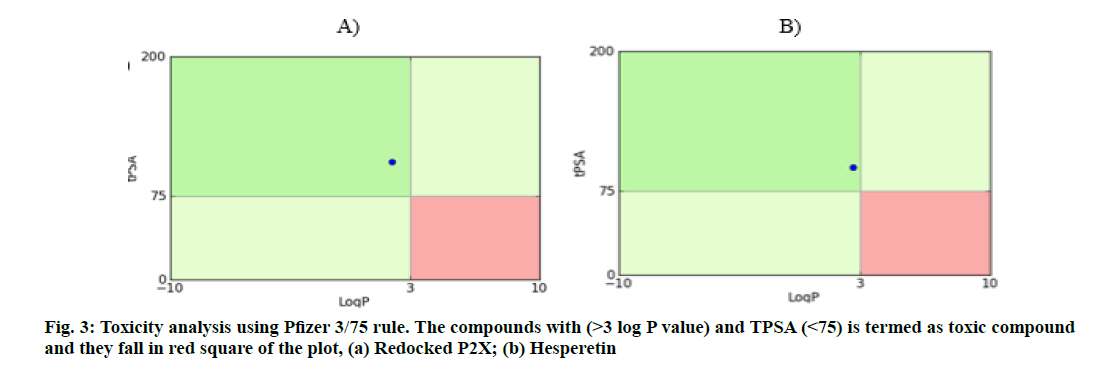
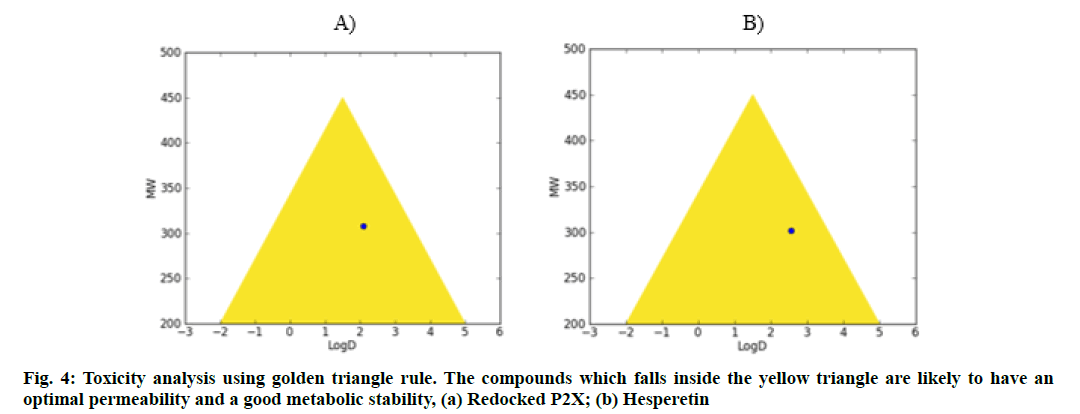
Further, the GSK 4/400 Rule (FAF-Drug3) Pfizer 3/75 Rule and Golden triangle rule were also implemented to evaluate the drug safety profiling, wherein, all these compounds were found to be fit with high confidence (fig. 3 and fig. 4).
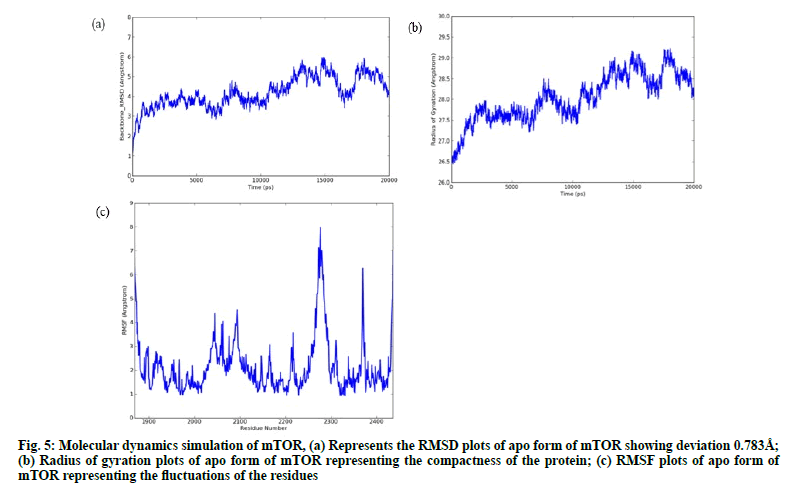
From the trajectory analysis of the apoenzyme (apo) form, it was noted that the backbone Root Mean Square Deviation (RMSD) of mTOR (fig. 5a) protein has maintained deviations ranging ~4.0-5.98 Ǻ with a standard deviation of 0.783 Å for 20 ns simulation without any convergence and has shown varying conformational changes. It is inferred from the radius of gyration plot (Rg) (fig. 5b) that the protein has not attained any compactness during 20 ns of simulation showing the open conformation of the protein since it has increased Rg value. The RMSF plot (fig. 5c) shows that His2277, Lys1867, Asp2276, Pro2273, Asp2274, Thr2279, Lys1868, Leu2278, Thr2436 of the kinase domain has attained the maximum fluctuations around ~7.5-6.5 Ǻ.
Figure. 5: Molecular dynamics simulation of mTOR, (a) Represents the RMSD plots of apo form of mTOR showing deviation 0.783Å; (b) Radius of gyration plots of apo form of mTOR representing the compactness of the protein; (c) RMSF plots of apo form of mTOR representing the fluctuations of the residues
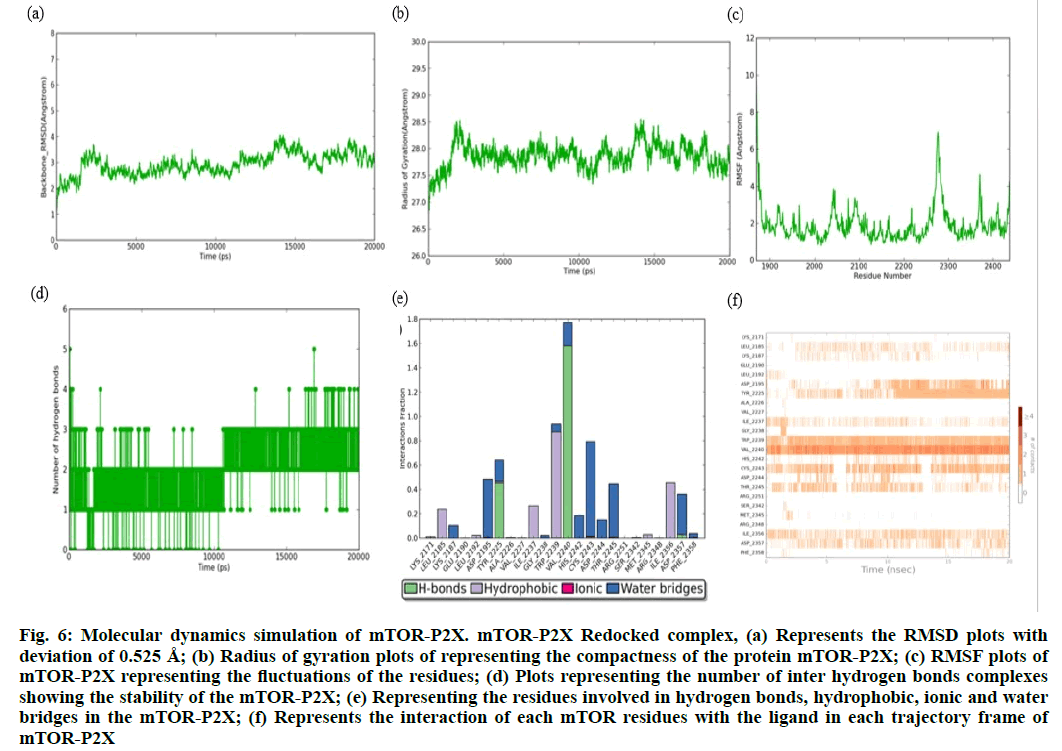
The RMSD plot of mTOR-P2X complex (fig. 6a) showed a maximum deviation of ~4.83 Ǻ initially, yet it has tried to converge and has maintained it throughout the simulation run with minimum deviation of 0.525 Å for 20 ns. Moreover, the radius of gyration plot (fig. 6b) also showed that the complex has maintained its compactness within the range of ~28 Å with a minimum of 0.25 Å deviation From the RMSF plot (fig. 6c) it was noted that the residue Thr2436 has fluctuations of about 7.2 Å, apart from the C-terminal residues conferring the loop region. The number of inter hydrogen bonds of the mTOR-P2X complex (fig. 6d) showed 6 hydrogen bonds initially where only 3-4 hydrogen bonds were maintained throughout the 20 ns simulation. From the interaction analysis (fig. 6e and fig. 6f), it is noted that the Asp2195, Gly2238, Val2240 has constantly maintained its interactions with P2X, apart from that Trp2239 has maintained its hydrophobic contact with P2X.
Figure. 6: Molecular dynamics simulation of mTOR-P2X. mTOR-P2X Redocked complex, (a) Represents the RMSD plots with deviation of 0.525 Å; (b) Radius of gyration plots of representing the compactness of the protein mTOR-P2X; (c) RMSF plots of mTOR-P2X representing the fluctuations of the residues; (d) Plots representing the number of inter hydrogen bonds complexes showing the stability of the mTOR-P2X; (e) Representing the residues involved in hydrogen bonds, hydrophobic, ionic and water bridges in the mTOR-P2X; (f) Represents the interaction of each mTOR residues with the ligand in each trajectory frame of mTOR-P2X
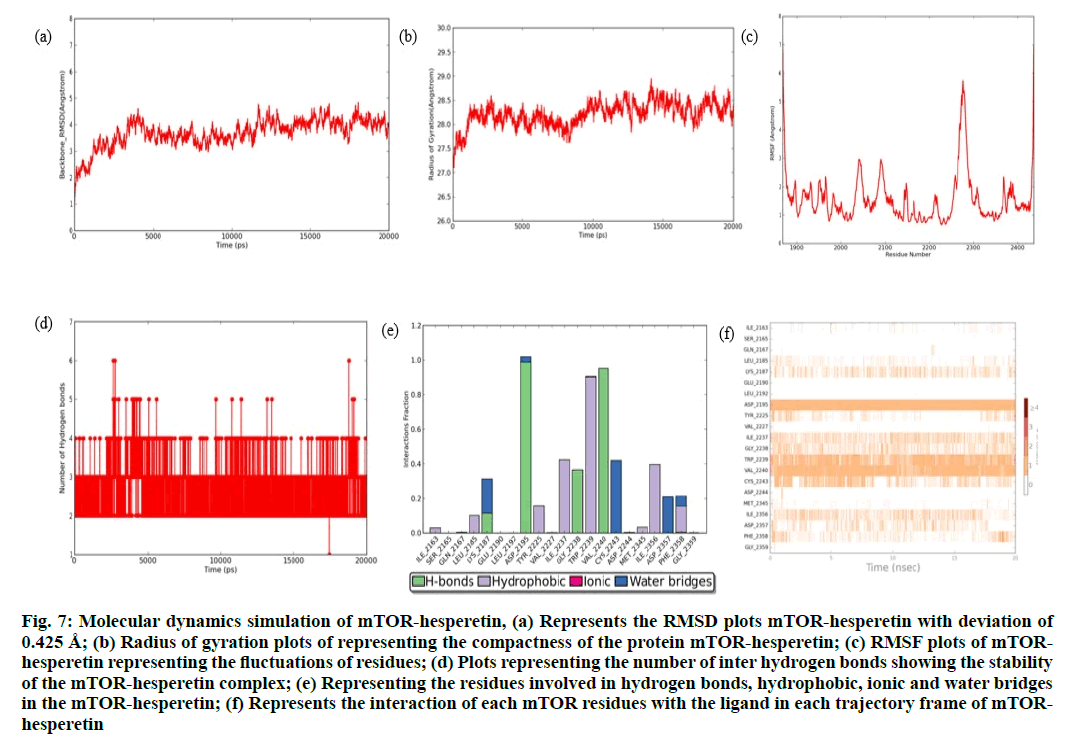
The RMSD plot of this complex (fig. 7a) has maintained a range of ~2.95 Å -3.5 Å with minimum deviations of ~0.425 Å. The protein has tried to converge from 3-10 ns initially, yet they showed gradual increase at ~14 ns and have tried to remain stable till 20 ns. The complex has tried to maintain its compactness of 27.857 Å as shown in the radius of gyration plot, with the minimum Rg value (fig. 7b). The RMSF plot (fig. 7c) revealed that only Asp2276 residue has showed maximum fluctuations of 6.2 Å, whereas overall all the residues have showed minimum fluctuations when compared to the apo form of mTOR. The mTOR-hesperetin complex stability is maintained by 5 hydrogen bonds among which only 2-3 inter hydrogen bonds were maintained throughout the simulation as shown in (fig. 7d). From the interaction analysis (fig. 7e and fig. 7f), it is noted that residues Val2240, cys2243 has constantly maintained its interaction with hesperetin, whereas interactions formed by residues Trp2239 and Asp2195 are partial initially and has maintained it after 10 ns till the end of MD production run. From the trajectory analysis on both apo and holo forms of mTOR, it is revealed that the mTOR-hesperetin complex has showed a minimum deviation among the apo and other holo forms. Moreover, the mTORhesperetin complex also had lowest Rg value thereby highlighting the compactness of the protein complex. In order to understand the stability of predicted proteinligand complexes, the inter hydrogen bond formation during the course of 20 ns simulation was analyzed and it was inferred that the mTOR-hesperetin complex also has maintained its stable interactions throughout the simulation. Overall, the Asp2195, Val2240, the important residues involved in interaction with the well-known inhibitor P2X is also well maintained throughout the md production run. Based on all the analysis performed, we strongly propose that mTOR– hesperetin to be more stable complex.
Fig. 7: Molecular dynamics simulation of mTOR-hesperetin, (a) Represents the RMSD plots mTOR-hesperetin with deviation of 0.425 Å; (b) Radius of gyration plots of representing the compactness of the protein mTOR-hesperetin; (c) RMSF plots of mTORhesperetin representing the fluctuations of residues; (d) Plots representing the number of inter hydrogen bonds showing the stability of the mTOR-hesperetin complex; (e) Representing the residues involved in hydrogen bonds, hydrophobic, ionic and water bridges in the mTOR-hesperetin; (f) Represents the interaction of each mTOR residues with the ligand in each trajectory frame of mTORhesperetin
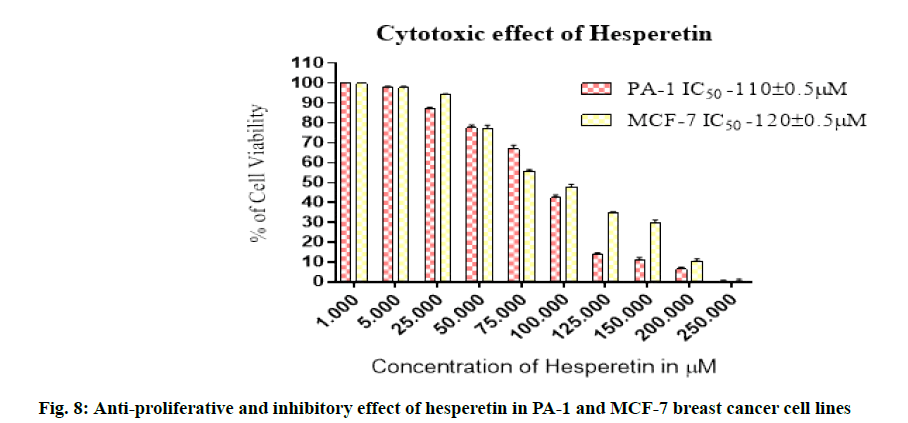
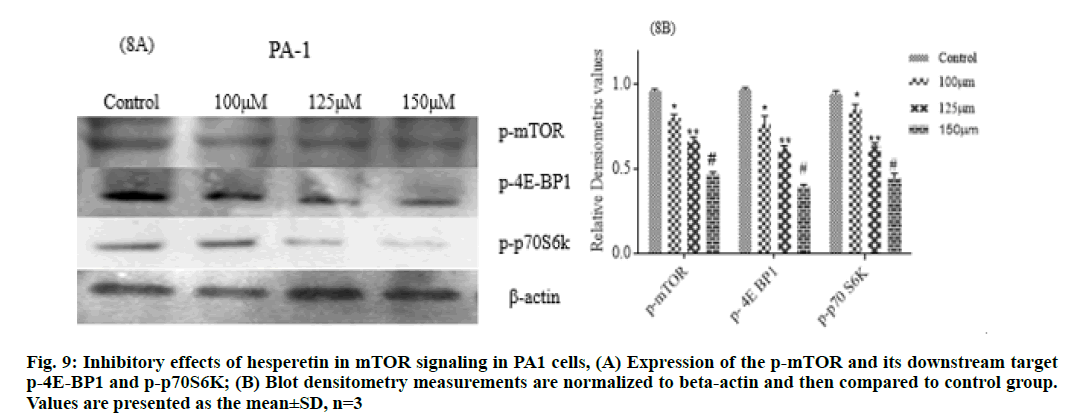
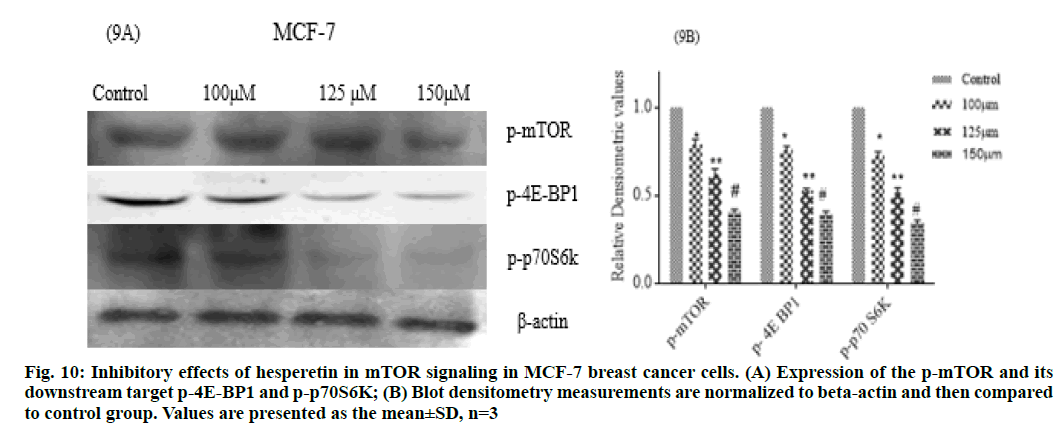
Further we studied the cytotoxic effect of hesperetin in two different types of cancer cell lines PA-1 and MCF- 7 breast cancer cells. We found the anti-proliferative activity of hesperetin ranged from 110-150 μm in these tumor cell lines (fig. 8). This data provides evidence that hesperetin can be a potent anticancer agent but the exact signaling pathways through which it possesses the antitumor activity are yet to be explored. In this study we analyzed whether the anti-cancer activity might be through the inhibition of mTOR. To enumerate the findings of mTOR inhibition by docking, we followed up an in vitro analysis of mTOR regulation by hesperetin in PA-1 and MCF-7 cell lines. As expected, p-mTOR was down regulated dose-dependently when treated with increasing concentrations of hesperetin. Therefore, we also analyzed the downstream effector of mTOR upon hesperetin treatment and the protein, P-4E-BP1 and P-p70 S6k was also significantly down regulated when compared to control (fig. 9 and fig. 10), suggesting that hesperetin inhibits the mTOR axis. Flavonoids, like fisetin also has been studied for its similar action in mTOR inhibition in lungs [37] prostate [38] multiple myeloma [39] and melanoma[40]. Hence, natural flavonoid, hesperetin could involve in controlling cancer growth and proliferation, in part, through retarding the mTOR signaling. On the basis of these in silico and in vitro results, it is conclusive that hesperetin could be a promising therapeutic agent in a wide range of cancers, yet detailed in vitro and in vivo investigations are required to unravel the other pathways involved in its anti-cancer effect. This study further explores on the mechanism of inhibiting mTOR by the action of hesperetin. Therefore, these results may lead to the development of natural compounds used as therapeutic inhibitors forh cancer. However in vivo experiments will be an additional validation for the findings based on the data from in silico and in vitro study.
Fig. 10: Inhibitory effects of hesperetin in mTOR signaling in MCF-7 breast cancer cells. (A) Expression of the p-mTOR and its downstream target p-4E-BP1 and p-p70S6K; (B) Blot densitometry measurements are normalized to beta-actin and then compared to control group. Values are presented as the mean±SD, n=3
In this study the potential inhibitor of mTOR hesperetin a plant derived compound was determined based on the in silico and in vitro studies. From the molecular docking analysis, it was inferred that the compound hesperetin showed significant scoring in terms of Glide score, Prime/MMGBSA score and significant catalytic interactions formed by the residues Asp2195, Val2240 and Trp2239 (π-π interaction) of mTOR similar to that of well-known inhibitor P2X. Moreover, based on comparative trajectory analysis, it was also revealed the hesperetin complex showed minimal deviations, least fluctuations and stable interactions overall than the apo and other holo forms. Therefore, from the overall in silico and in vitro studies on the apo and holo forms of mTOR protein it is conclusively suggested that hesperetin is a potent molecule of natural flavonoid origin that could inhibit the dysregulation of mTOR. Therefore, this work significantly contributes to the perception of the anticancer activity of hesperetin through mTOR inhibition, for the first time and exemplified that hesperetin merits additional consideration as a natural anticancer agent for human cancers and metabolic diseases.
Acknowledgements
We would like to thank, The Centre for Bioinformatics, Kamalnayan Bajaj Institute for Research in Vision and Ophthalmology, Vision Research Foundation, Sankara Nethralaya, Chennai 600006, Tamil Nadu, India for assisting us in the Molecular Docking Studies. The financial assistance from VRR Institute of Biomedical Science, Chennai is gratefully acknowledged.
Conflict of interests
The authors declared no conflicts of interest.
References
- Hanahan D, Weinberg RA. Hallmarks of cancer: the next generation. Cell 2011;144(5):646-74
- Siegel RL, Miller DK, Jemal A. Cancer statistics, 2016. CA Cancer J Clin 2016;66(1):7-30.
- Seto M, Honma K, Nakagawa M. Diversity of genome profiles in malignant lymphoma. Cancer Sci 2010;101(3):573-8.
- Saxton RA, Sabatini DM. mTOR Signaling in Growth, Metabolism and Disease. Cell 2017;168(6):960-76.
- Brown EJ, Albers M, Tae BS, Ichikawa K, Keith CT, Lane WS. A mammalian protein targeted by G1-arresting rapamycin-receptor complex. Nature 1994;369(6483):756-8.
- Chiu MI, Katz H, Berlin V. RAPT1, a mammalian homolog of yeast Tor, interacts with the FKBP12/rapamycin complex. Proc Natl Acad Sci 1994;91(26):12574-8.
- Benjamin D, Colombi M, Moroni C, Hall MN. Rapamycin passes the torch: a new generation of mTOR inhibitors. Nat Rev Drug Discov 2011;10(11):868-80.
- Laplante M, Sabatini DM. An emerging role of mTOR in lipid biosynthesis. Curr Biol 2009;19(22):R1046-52.
- Paquette M, El-Houjeiri L, Pause A. mTOR pathways in cancer and autophagy. Cancers 2018;10(1):18.
- Wullschleger S, Loewith R, Hall MN. TOR signaling in growth and metabolism. Cell 2006;124(3):471-84.
- Jacinto E, Loewith R, Schmidt A, Lin S, Rüegg MA, Hall A, et al. Mammalian TOR complex 2 controls the actin cytoskeleton and is rapamycin insensitive. Nat Cell Biol 2004;6(11):1122-8.
- Zhou H, Huang S. Role of mTOR signaling in tumor cell motility, invasion and metastasis. Curr Protein Pept Sci 2011;12(1):30-42.
- Zoncu R, Efeyan A, Sabatini DM. mTOR: from growth signal integration to cancer, diabetes and ageing. Nat Rev Mol Cell Biol 2011;12(1):21-35.
- Amin A, Gali-Muhtasib H, Ocker M, Schneider-Stock R. Overview of major classes of plant-derived anticancer drugs. Int J Biomed Sci 2009;5(1):1-11.
- Cornblatt BS, Ye L, Dinkova-Kostova AT, Erb M, Fahey JW, Singh NK, et al. Preclinical and clinical evaluation of sulforaphane for chemoprevention in the breast. Carcinogenesis 2007;28(7):1485-90.
- Gil-Izquierdo A, Gil MI, Ferreres F, Tomás-Barberán FA. in vitro availability of flavonoids and other phenolics in orange juice. J Agric Food Chem 2001;49(2):1035-41.
- Cai Y, Luo Q, Sun M, Corke H. Antioxidant activity and phenolic compounds of 112 traditional Chinese medicinal plants associated with anticancer. Life Sci 2004;74(17):2157-84.
- Choi EJ. Hesperetin induced G1-phase cell cycle arrest in human breast cancer MCF-7 cells: involvement of CDK4 and p21. Nutr Cancer 2007;59(1):115-9.
- Garg A, Garg S, Zaneveld LJ, Singla AK. Chemistry and pharmacology of the citrus bioflavonoid hesperidin. Phytother Res 2001;15(8):655-69.
- Alshatwi AA, Ramesh E, Periasamy VS, Subash‐Babu P. The apoptotic effect of hesperetin on human cervical cancer cells is mediated through cell cycle arrest, death receptor and mitochondrial pathways. Fundam Clin Pharmacol 2013;27(6):581-92.
- Nalini N, Aranganathan S, Kabalimurthy J. Chemopreventive efficacy of hesperetin (citrus flavonone) against 1,2-dimethylhydrazine-induced rat colon carcinogenesis. Toxicol Mech Methods 2012;22(5):397-408.
- Sambantham S, Radha M, Paramasivam A, Anandan B, Malathi R, Chandra SR, et al. Molecular mechanism underlying hesperetin-induced apoptosis by in silico analysis and in prostate cancer PC-3 cells. Asian Pac J Cancer Prev 2013;14(7):4347-52.
- Ye L, Chan FL, Chen S, Leung LK. The citrus flavonone hesperetin inhibits growth of aromatase-expressing MCF-7 tumor in ovariectomized athymic mice. J Nutr Biochem 2012;23(10):1230-7.
- Patel PN, Yu XM, Jaskula-Sztul R, Chen H. Hesperetin activates the Notch1 signaling cascade, causes apoptosis, and induces cellular differentiation in anaplastic thyroid cancer. Ann Surg Oncol 2014;21(4):497-504.
- Smina TP, Mohan A, Ayyappa KA, Sethuraman S, Krishnan UM. Hesperetin exerts apoptotic effect on A431 skin carcinoma cells by regulating mitogen activated protein kinases and cyclins. Cell Mol Biol 2015;61(6):92-9.
- Wang L, Chen L, Yu M, Xu LH, Cheng B, Lin YS, et al. Discovering new mTOR inhibitors for cancer treatment through virtual screening methods and in vitro assays. Sci Rep 2016;6(1):1-3.
- Sneader. W. The discovery of aspirin: a reappraisal. BMJ 2000;321(7276):1591-4.
- Rastelli G, Rio AD, Degliesposti G, Sgobba M. Fast and accurate predictions of binding free energies using MM‐PBSA and MM‐GBSA. J Comput Chem 2010;31(4):797-810.
- Lagorce D, Sperandio O, Baell JB, Miteva MA, Villoutreix BO. FAF-Drugs3: a web server for compound property calculation and chemical library design. Nucleic Acids Res 2015;43(W1):W200-7.
- Bracht F, de Alencastro RB. Dynamical study, hydrogen bond analysis and constant pH simulations of the beta carbonic anhydrase of Methanobacterium thermoautotrophicum. J Biomol Struct Dyn 2016;34(2):259-71.
- Guttikonda V, Raavi D, Maadwar SK, Gade DR. Molecular insights of benzodipyrazole as CDK2 inhibitors: combined molecular docking, molecular dynamics and 3D QSAR studies. J Recept Signal Transduct 2015;35(5):439-49.
- Idrees D, Prakash A, Haque MA, Islam A, Ahmad F, Hassan MI. Spectroscopic and MD simulation studies on unfolding processes of mitochondrial carbonic anhydrase VA induced by urea. J Biomol Struct Dyn 2016;34(9):1987-97.
- Katari SK, Natarajan P, Swargam S, Kanipakam H, Pasala C, Umamaheswari A. Inhibitor design against JNK1 through e-pharmacophore modeling docking and molecular dynamics simulations. J Recept Signal Transduct 2016;36(6):558-71.
- Banks JL, Beard HS, Cao Y, Cho AE, Damm W, Farid R, et al. Integrated modeling program, applied chemical theory (IMPACT). J Comput Chem 2005;26(16):1752-80.
- Guo Z, Mohanty U, Noehre J, Sawyer TK, Sherman W, Krilov G. Probing the α‐helical structural stability of stapled p53 peptides: molecular dynamics simulations and analysis. Chem Biol Drug Des 2010;75(4):348-59.
- John A, Umashankar V, Krishnakumar S, Deepa PR. Comparative modeling and molecular dynamics simulation of substrate binding in human fatty acid synthase: enoyl reductase and β-ketoacyl reductase catalytic domains. Genomics Inform 2015;13(1):15.
- Khan N, Afaq F, Khusro FH, Adhami VM, Suh Y, Mukhtar H. Dual inhibition of PI3K/AKT and mTOR signaling in human non-small cell lung cancer cells by a dietary flavonoid fisetin. Int J Cancer 2012;130(7):1695.
- Suh Y, Afaq F, Khan N, Johnson JJ, Khusro FH, Mukhtar H. Fisetin induces autophagic cell death through suppression of mTOR signaling pathway in prostate cancer cells. Carcinogenesis 2010;31(8):1424-33.
- Jang KY, Jeong SJ, Kim SH, Jung JH, Kim JH, Koh W, et al. Activation of reactive oxygen species/AMP activated protein kinase signaling mediates fisetin-induced apoptosis in multiple myeloma U266 cells. Cancer Lett 2012;319(2):197-202.
- N Syed D, M Adhami V, Imran Khan M, Mukhtar H. Inhibition of Akt/mTOR signaling by the dietary flavonoid fisetin. Anticancer Agents Med Chem 2013;13(7):995-1001.
