- *Corresponding Author:
- Xiaofeng Zhu
Mudanjiang Medical University, Mudanjiang, Heilongjiang Province, 157011, China
E-mail: zhuxiaofeng1227@163.com
| This article was originally published in a special issue, “Modern Applications in Biomedical Research and Pharmaceutical Sciences” |
| Indian J Pharm Sci 2022:84(3) Spl Issue “88-98” |
This is an open access article distributed under the terms of the Creative Commons Attribution-NonCommercial-ShareAlike 3.0 License, which allows others to remix, tweak, and build upon the work non-commercially, as long as the author is credited and the new creations are licensed under the identical terms
Abstract
Transforming growth factor-beta/Smad pathway plays an important role in the pathogenesis of neurological diseases. This study investigated the effects of high fat diet and alcohol dependence on memory and expression of transforming growth factor-beta/Smad in the prefrontal lobe, hippocampus and cerebellum of rats. Sixty male Sprague Dawley rats were randomly divided into control group, alcohol group and alcohol+highfat diet group. Morris water maze test was performed at 4 w, 8 w and 12 w after modeling, respectively. The prefrontal cortex, hippocampus and cerebellum were dissected for hematoxylin and eosin staining and transforming growth factor-beta 1 levels were detected by enzyme-linked immunosorbent assay. Western blotting was used to detect phospho-Smad3 and Smad4 levels. At 4 w, 8 w and 12 w of modeling, compared with the control group, the incubation period of rats in the alcohol group and the alcohol+high-fat diet group was prolonged and the prefrontal cone cells and Purkinje cells in the cerebellum were reduced to varying degrees and the cells were deformed. The expression levels of transforming growth factor-beta 1, phospho-Smad3 and Smad4 were significantly higher than those of the control group at 8 w and 12 w of modeling (p<0.05). High fat diet and alcohol may affect the function of cerebellum transforming growth factor-beta 1, phospho-Smad3 and Smad4 by enhancing the expression of transforming growth factor-beta 1, phospho-Smad3 and Smad4, leading to the decrease of spatial learning and memory ability in rats.
Keywords
High-fat diet, prefrontal lobe, cerebellum, cognitive function, transforming growth factor-beta/ Smad
High-Fat Diet (HFD) and alcohol dependence affect more than 100 million people worldwide, can lead to pathological changes in the central nervous system, accompanied by severe cognitive dysfunction and behavioral abnormalities, and is associated with significant morbidity and mortality, has become a significant public social problem worldwide[1,2]. Epidemiological studies have shown that HFD and alcohol dependence are associated with the risk of dementia[3], in particular by affecting prefrontalhippocampal neural circuits[4]. Previous studies have confirmed the cerebellum as a brain region associated with motor balance, but recent studies have shown that it is also involved in a wide range of cognitive processes, for example, discrimination learning, spatial learning, working memory[5]; in anatomical studies on animals, the “cognitive” pathway, the prefrontal-hippocampal neural circuit, has been identified and in recent years numerous studies have confirmed that the cerebellum is interconnected with a wide range of limbic structures including the amygdala and hippocampus as well as the cerebral cortex including prefrontal regions, coregulating cognitive, motor and affective processes in animals[6]. Stanton et al.[7] studies have found that when alcohol is consumed during adolescence, prefrontalhippocampal circuits and cerebellum are particularly susceptible to adverse effects of alcohol, affecting longterm memory in animals, indicating that alcohol-related cognitive impairment has an important link with the prefrontal cortex, hippocampus and cerebellum, but the specific mechanism of this link remains unclear.
Transforming Growth Factor-beta (TGF-β) superfamily signaling is involved in diverse biological processes during embryogenesis and adult tissue homeostasis. New studies have confirmed the important role of aberrant TGF-β superfamily signaling in the pathogenesis of neurological diseases, revealing that dysregulation of TGF-β/Smad signaling pathway is involved in the pathogenesis of cognitive impairment and neurodegenerative diseases in animal models and patients[8]. Based on this, cognitive impairment caused by HFD and alcohol dependence may be related to dysregulation of TGF-β/Smad signaling pathway. In this study, we mainly studied the learning and memory problems of HFD and alcohol-dependent male Sprague–Dawley (SD) rats, and also focused on the detection of TGF-β1, Smad3 and Smad4 expression in the prefrontal cortex, hippocampus and cerebellum.
Materials and Methods
Experimental animals and groups:
Sixty 8 w old male SD rats (200±20) g (provided by the Comparative Medical Center of Mudanjiang Medical University, animal license no. SYXK (black) 2019-006), room temperature (20°±2°) and light/dark ratio 12:12. Individual rats with abnormal learning and memory ability were excluded according to the following water maze test method and then 12 rats were randomly divided into control group (n=12), alcohol group (n=24) and alcohol+HFD group (n=24). The alcohol group, the alcohol+HFD group, provided an initial supply of 3 % alcohol to the drinking bottle and then gradually increased the alcohol concentration by 3 % every week until it increased to 15 % at 5 w, after which 15 % alcohol was maintained until 12 w of the study[9].
Experimental methods:
Morris water maze test: This is used to determine the learning and memory ability of rats. Morris water maze (120 cm in diameter and 50 cm in height, Chengdu taimeng Software Co., Ltd.) was performed on rats in each group at 4 w, 8 w and 12 w respectively. The water tank was divided into four quadrants through the imaging line and the platform (15 cm in diameter) was placed 1 cm below the water level in the first quadrant (invisible). The time limit is 60 s. It is specified that the time when the rats enter the water to the standing platform is the incubation period and the movement track of the rats is recorded; if the rats do not stand on the platform beyond 60 s, they are manually guided and stay for 15 s-30 s. The whole experiment lasts for 7 d, repeated twice a day and the platform is taken on the last day to record the incubation period and time of the rats to the original platform area.
Microscopic observation of neuronal structure in the prefrontal cortex, hippocampus and cerebellum of rats: Every 4 w, 1 rat in the control group, 2 rats in the alcohol group and 2 rats in the alcohol+HFD group were anesthetized with intraperitoneal injection of 10 % chloral hydrate and decapitated. The prefrontal cortex, hippocampus and cerebellum were fixed with 4 % paraformaldehyde for 72 h and stained with Hematoxylin and Eosin (H&E). The neuronal structures of the prefrontal cortex, hippocampus and cerebellum of rats in each group were photographed and recorded under a microscope.
Enzyme-Linked Immunosorbent Assay (ELISA): TGF-β1 levels in the prefrontal cortex, hippocampus and cerebellar tissue were measured by ELISA method and the operating steps were performed in strict accordance with the ELISA kit instructions.
Immunoblotting: Every 4 w, 3 rats in the control group, 6 rats in the alcohol group and 6 rats in the alcohol+HFD group were anesthetized with intraperitoneal injection of 10 % chloral hydrate, decapitated and their brains were dissected, frozen in liquid nitrogen and stored in a −80° refrigerator. 10 % homogenates of the prefrontal cortex, hippocampus and cerebellum were prepared in Radio Immunoprecipitation Assay (RIPA) lysate, centrifuged at 12 000 revolutions for 15 min and the supernatant was taken to detect the protein concentration using a Bicinchoninic Acid (BCA) protein assay kit. Gel preparation (10 % separation gel and 5 % stacking gel), electrophoresis, membrane was transferred and milk was blocked for 1 h. Rabbit anti-rat phospho (p)-Smad3 (cell signaling #9520, 1:1000), Smad4 (cell signaling #46535, 1:1000) primary antibody and anti-rat antibody were used β-actin antibody (cell signaling #8457t, 1:1000) was incubated overnight. After washing the film, horseradish peroxidase labeled goat anti-rabbit Immunoglobulin G (IgG) (Biyuntian A0208, 1:1000) was incubated for 1 h. After washing the film, chromogenic reagent was coated and exposed.
Statistical analysis:
Statistical analysis of the experimental data was performed using Statistical Package for the Social Sciences (SPSS) 24.0 software. Data are expressed as mean±Standard Error of the Mean (SEM). One-way Analysis of Variance (ANOVA) followed by Tukey’s test was used for multiple group comparisons. With p<0.05 statistically significant.
Results and Discussion
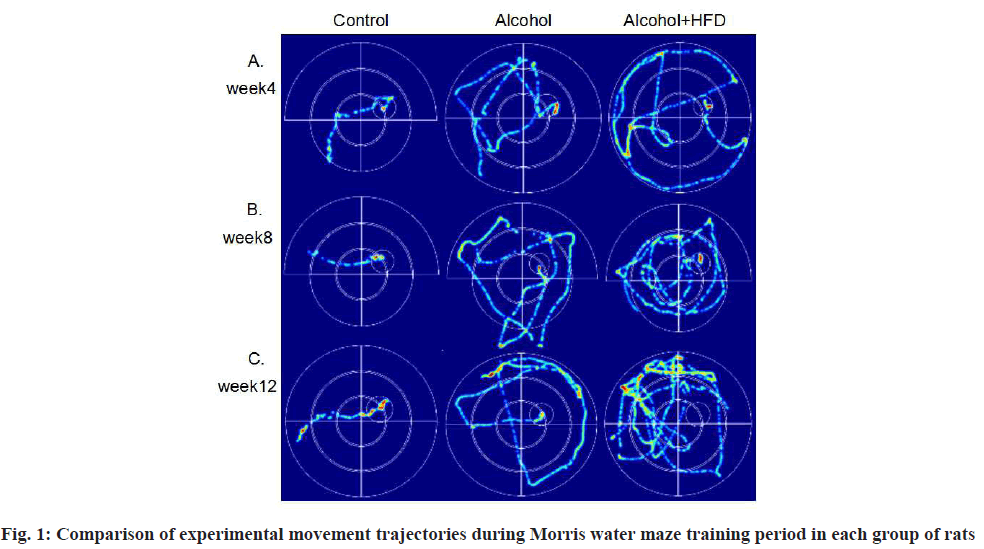
In the Morris water maze test, during the training period of the first 6 d, compared with the control group, the latency of the two model groups was significantly prolonged at 8 w and there were significant differences in the alcohol group (p<0.05) and alcohol+HFD group (p<0.01), the swimming path of the two model groups was significantly increased compared with the control group and there were significant differences in the alcohol group (p<0.01) and alcohol+HFD group (p<0.01); at 12 w, compared with the control group, the latency of the two model groups was also significantly prolonged. There was significant difference between the alcohol group (p<0.001) and the alcohol+HFD group (p<0.0001). The swimming path of the two model groups was also significantly increased. There was significant difference between the alcohol group (p<0.0001) and the alcohol+HFD group (p<0.0001). The swimming path of the alcohol+HFD group was significantly increased compared with the alcohol group (p<0.01). No matter in 4 w, 8 w and 12 w, the swimming speed of the three groups was the same, which was not statistically significant (p>0.05) as shown in Table 1; in the spatial exploration test when the platform was removed on the 7th d, compared with the control group, the latency of the two model groups was prolonged at 8 w, significantly prolonged in the alcohol+HFD group, with statistical significance (p<0.05) and the number of platform crossings was significantly reduced in the alcohol+HFD group (p<0.05); compared with the control group, the latency of the two model groups was prolonged at 12 w, with statistically significant differences in the alcohol+HFD group (p<0.001) and significantly reduced in the number of platform crossings in the alcohol+HFD group (p<0.001), with statistically significant differences as shown in Table 2. Through the movement track of rats recorded by video, after the 6 d training period, the movement track of rats in the three groups of 4 w, 8 w and 12 w was flat and short, with strong tropism and the platform was quickly found; the tendency of rats in the alcohol group was worse than that of rats in the control group, which took a long time to find the platform, indicating that the memory was damaged; the movement track of rats in the alcohol+HFD group was complex and confusing, with the worst tendency, mostly marginalized movement trajectory, the average time to find the platform was longer than that of rats in the control group and alcohol group, and more than 12 rats failed to reach the platform position in 12 w, indicating that the memory was severely damaged as shown in fig. 1.
| Category | Group | 4 w | 8 w | 12 w |
|---|---|---|---|---|
| Incubation period (s) | Control | 25.76±3.89 | 11.85±1.93 | 9.87±0.81 |
| Alcohol | 19.90±2.13 | 25.10±3.04a* | 26.98±3.32b** | |
| Alcohol+HFD | 27.18±3.49 | 29.50±2.50a** | 33.91±1.40b**** | |
| Path length to platform (m) | Control | 5.44±0.66 | 2.25±0.21 | 1.85±0.19 |
| Alcohol | 4.30±0.52 | 5.96±0.72a** | 5.92±0.53b**** | |
| Alcohol+HFD | 5.92±0.71 | 6.10±0.43a** | 8.44±0.37b****c** | |
| Swim speed (m/s) | Control | 0.20±0.01 |
18 (29.03) | 18 (29.03) |
| Alcohol | 0.21±0.01 | 0.22±0.01 | 0.23±0.02 | |
| Alcohol+HFD | 0.21±0.01 | 0.20±0.01 | 0.25±0.01 |
Note: Results are expressed as mean±SEM, *p<0.05; **p<0.01 and ***p<0.0001, a8 w control group, b12 w control group and c12 w alcohol group
Table 1: Latency, Swimming Path and Speed During The Water Maze Training Period In Each Group of Rats
| Category | Group | 4 w | 8 w | 12 w |
|---|---|---|---|---|
| Latency (s) | Control | 1.65±0.69 | 1.83±0.36 | 2.23±0.76 |
| Alcohol | 3.63±1.01 | 12.39±3.80 | 19.62±4.67 | |
| Alcohol+HFD | 4.71±3.79 | 26.60±8.69a* | 34.10±4.20b* | |
| Crossing platform (number of crossings) | Control | 5.00±1.08 | 4.25±0.48 | 6.00±0.71 |
| Alcohol | 4.75±0.59 | 3.25±0.41 | 3.88±0.58 | |
| Alcohol+HFD | 3.63±0.46 | 2.13±0.52a* | 2.25±0.49b* |
Note: Results are expressed as mean±SEM, *p<0.05; **p<0.01 and ***p<0.001, a8 w control group and b12 w control group
Table 2: Latency and Number of Platform Crossings During The Water Maze Exploration Period In Each Group of Rats
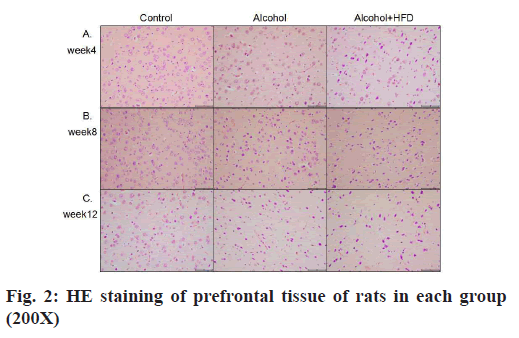
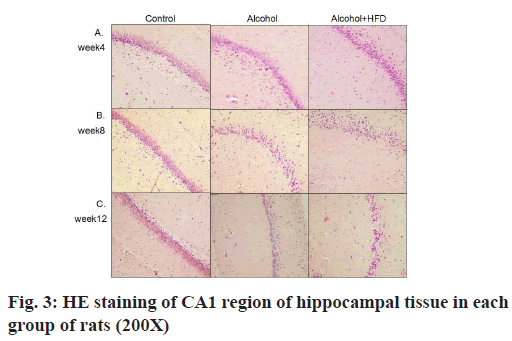
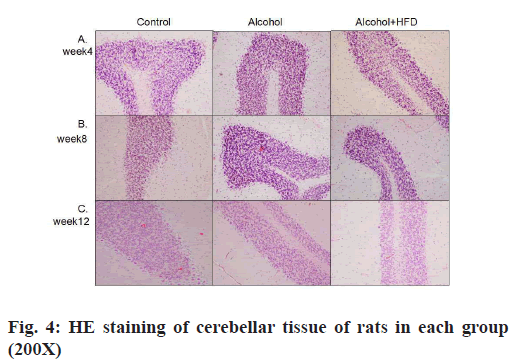
The results of HE staining observation of the prefrontal cortex of each group showed that in 4 w, the number of pyramidal cells in the prefrontal cortex layer of rats in the control group was large, neatly and tightly arranged, the cell structure was normal and the nuclei were round and large; the prefrontal cortex layer of rats in the alcohol group pyramidal cell number was reduced, some nerve cells showed dark staining, irregular structure and unclear nuclear staining; the number of pyramidal cells in the prefrontal cortex of rats in the alcohol+HFD group was reduced, sparsely arranged, the cell morphology was irregular and neuronal cells were more dark stained as shown in fig. 2A. In 8 w, the morphological structure of prefrontal cells in the control group was normal, neatly and evenly arranged; the arrangement of prefrontal cortex in the alcohol group was sparser than that in the control group and the dark staining of nerve cells was increased than before; the number of pyramidal cells in the prefrontal cortex of rats in the alcohol+HFD group decreased more severely than before, the cell morphology was irregular and the cell structure was incomplete as shown in fig. 2B. In 12 w, in the control group, the number of prefrontal pyramidal cells was morphologically normal and the cytoplasmic nuclei were clear and complete; in the alcohol group, the number of prefrontal pyramidal cells was significantly reduced and structurally normal cells were rare; in the alcohol+HFD group, the pyramidal cells were disorganized, the nuclei were deformed and the cytoplasm was almost completely dark stained as shown in fig. 2C. The results of hippocampal Carbonic Anhydrase (CA) 1 region observation in each group showed that in 4 w, the morphology and structure of hippocampal neurons in the control group were normal, arranged closely, the pyramidal cell band was neat and uniform, and the nucleus was round and large; the morphology of hippocampal neurons in the alcohol group was normal, the pyramidal cell band began to shed cells, arranged loosely and some cytoplasm was deeply stained; the morphology of hippocampal neurons in the alcohol+HFD group was abnormal, the pyramidal cell bands were loosely arranged, the cytoplasm was deeply stained and the cells were deformed as shown in fig. 3A. In 8 w, the morphology and structure of hippocampal neurons in the control group were normal and the pyramidal cell bands were closely arranged; in the alcohol group, the hippocampal neurons were reduced, arranged loosely, and the cytoplasmic hyperchromasia was increased; in the alcohol+HFD group, the morphology of hippocampal neurons was abnormal, the pyramidal cell bands were disordered, the nucleus was deformed and the cytoplasm was deeply stained as shown in fig. 3B. In 12 w, in the control group, the morphology and structure of hippocampal neurons and pyramidal cell bands in the alcohol group were normal, the hippocampal neuron cells in the alcohol group were significantly reduced, the arrangement of pyramidal cell bands was very loose, and some cells atrophied and deformed; the decrease of hippocampal neuron cells in the alcohol+HFD group was the most obvious, the distribution of pyramidal cell bands was extremely disordered, the cell deformation was serious and the cytoplasm was deeply stained as shown in fig. 3C. The results of cerebellar observation in each group showed that in 4 w, the Purkinje cells in the cerebellum of the control group were arranged. In the alcohol group, the morphology of cerebellar Purkinje cells was normal, but the number was reduced; in the alcohol+HFD group, the arrangement of cerebellar Purkinje cells was loose, the cytoplasm was dark stained and the cells were deformed as shown in fig. 4A. In 8 w, the cerebellar Purkinje cells in the control group had normal morphological structure and were neatly and evenly arranged; the cerebellar Purkinje cells in the alcohol group were significantly reduced, loosely arranged and the cytoplasm was hyperchromatic; the cerebellar Purkinje cells in the alcohol+HFD group were disorganized, the nuclei were deformed and the cytoplasm was hyperchromatic as shown in fig. 4B. In 12 w, Purkinje cells in the cerebellum remained densely and evenly arranged in the control group and significantly reduced and disorganized in the cerebellum in the alcohol group as shown in fig. 4C. Purkinje cells act as the only efferent neurons of the cerebellum involved in learning and memory and limb coordinated movements. Its reduction confirms the damaging effect of alcohol and HFD on brain memory.
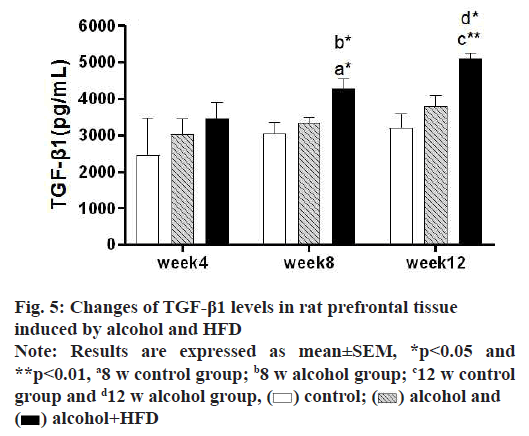
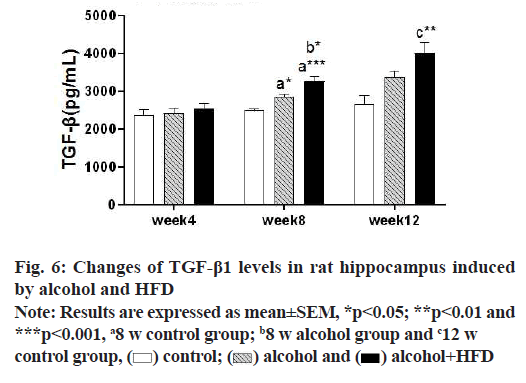
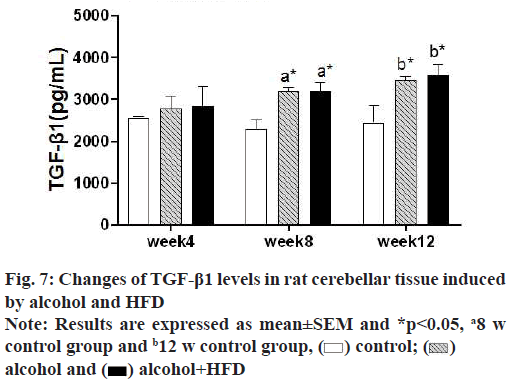
In this study, the detection results of TGF-β1 in prefrontal tissues showed that in 4 w, TGF-β1 was increased in the alcohol group and alcohol+HFD group compared with the control group, but it was not statistically significant (p>0.05); in 8 w, TGF-β1 levels in the prefrontal cortex were significantly increased in the alcohol+HFD group (p<0.05) both compared with the control group and compared with the alcohol group, with statistical significance. In 12 w, TGF-β1 was significantly increased in the alcohol+HFD group (p<0.01) compared with the control group and TGF-β1 levels in the prefrontal cortex were increased statistically significant in the alcohol+HFD group (p<0.05) compared with the alcohol group as shown in fig. 5. The results of TGF-β1 detection in hippocampal tissue showed that in 4 w, TGF-β1 was increased in alcohol and alcohol+HFD group rats compared with the control group, but it was not significant. In 8 w, TGF-β1 levels were significantly higher in the alcohol group (p<0.05) and alcohol+HFD group (p<0.001) compared with the control group and significantly higher in the alcohol+HFD group (p<0.05) compared with the alcohol group. In 12 w, rats in the alcohol+HFD group (p<0.01) had a statistically significant increase in TGF-β1 compared with the control group as shown in fig. 6. The results of TGF-β1 detection in cerebellar tissue showed that in 4 w, TGF-β1 was increased in alcohol and alcohol+HFD rats compared with the control group, but it was not significant. In 8 w, TGF-β1 levels were significantly higher in the alcohol group (p<0.05) and alcohol+HFD (p<0.05) group compared with the control group, which was statistically significant. In 12 w, TGF-β1 was significantly increased in rats in the alcohol group (p<0.05) and alcohol+HFD group (p<0.05) compared with the control group, which was statistically significant as shown in fig.7.
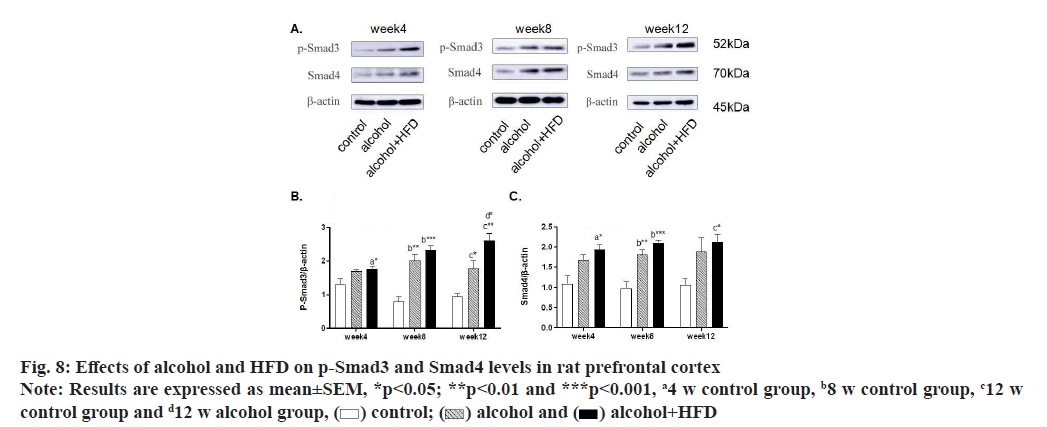
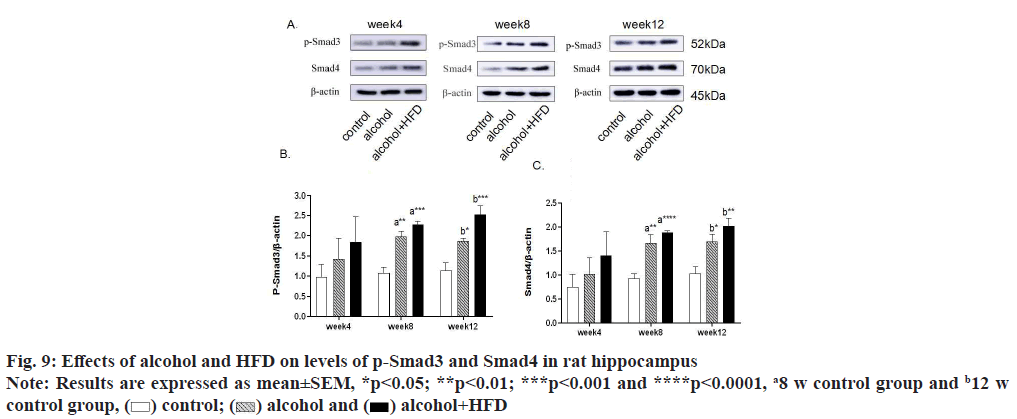
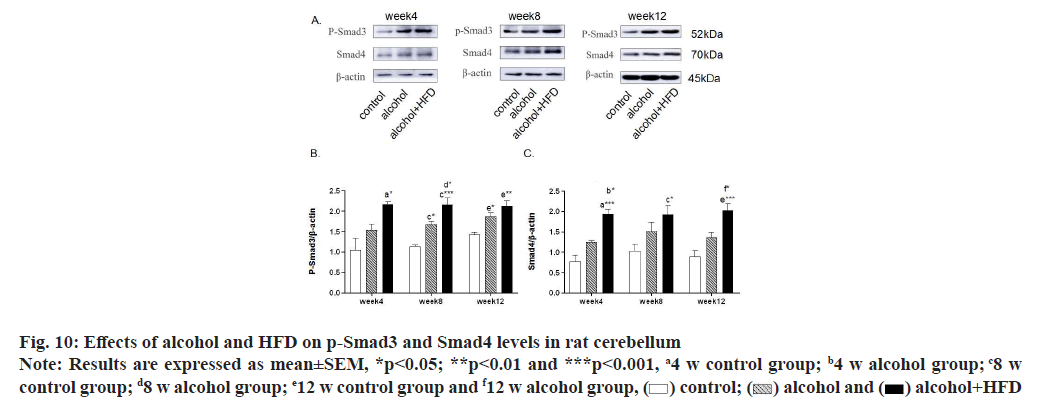
In this study, the expression levels of p-Smad3 and Smad4 in the prefrontal cortex of rats were detected by Western blotting. The results showed that in the detection of p-Smad3, the expression of p-Smad3 in the alcohol group and alcohol+HFD group increased in turn compared with the control group at 4 w, with statistical significance in the alcohol+HFD group (p<0.05); the expression of p-Smad3 in the alcohol group (p<0.01) and alcohol+HFD group (p<0.001) increased significantly compared with the control group at 8 w; at 12 w, compared with the control group, the expression of p-smad3 in the alcohol group (p<0.05) and the alcohol+HFD group (p<0.01) increased significantly and the expression of p-smad3 in the alcohol+HFD group was statistically significant (p<0.05) compared with the alcohol group as shown in fig. 8A and fig. 8B. In the detection of Smad4, compared with the control group, the expression of Smad4 in the alcohol+HFD group was significantly increased (p<0.05); at 8 w, compared with the control group, the expression of rats in alcohol group (p<0.01) and alcohol+HFD group (p<0.001) increased successively, which was statistically significant; at 12 w, compared with the control group, the expression of rats in the alcohol+HFD group (p<0.05) increased significantly and was statistically significant as shown in fig. 8A-fig. 8C. Detection of p-Smad3 in rat hippocampus showed that at 4 w, compared with the control group, the expression of p-Smad3 in alcohol group and alcohol+HFD group increased in turn, but it was not statistically significant; at 8 w, compared with the control group, the expression of p-Smad3 in alcohol group (p<0.01) and alcohol+HFD group (p<0.001) increased significantly, with statistical significance as shown in fig. 9A and fig. 9B. In the detection of Smad4 in hippocampus, the expression of Smad4 in alcohol group and alcohol+HFD group was observed to increase in turn compared with the control group at 4 w, but it was not statistically significant; the expression of Smad4 in alcohol group (p<0.01) and alcohol+HFD group (p<0.0001) was significantly increased compared with the control group at 8 w; the expression of Smad4 in alcohol group (p<0.05) and alcohol+HFD group (p<0.01) was significantly increased compared with the control group at 12 w as shown in fig. 9A-fig. 9C. In the detection of p-Smad3 in cerebellar tissue, at 4 w, compared with the control group, it was observed that the expression of p-Smad3 in the alcohol group and alcohol+HFD group increased in turn, with statistical significance in the alcohol+HFD group (p<0.05); at 8 w, compared with the control group, the expression of p-Smad3 in the alcohol group (p<0.05) and alcohol+HFD group (p<0.001) increased significantly and compared with the alcohol group, the expression of p-Smad3 in the alcohol+HFD group was statistically significant (p<0.05); at 12 w, compared with the control group, the expression of p-Smad3 in the alcohol group (p<0.05) and alcohol+HFD group (p<0.01) increased significantly, with statistical significance as shown in fig. 10A and fig. 10B. In the detection of Smad4 in cerebellar tissue, a significant increase in the expression of Smad4 was observed in the alcohol+HFD group compared with the control group at 4 w (p<0.001), and a significant increase in the expression of Smad4 was observed in the alcohol+HFD group compared with the alcohol group (p<0.05), with statistical significance; at w 8, compared with the control group, the expression of rats in alcohol group and alcohol+HFD group increased successively and the expression of rats in alcohol+HFD group (p<0.05) increased significantly, which was statistically significant; at 12 w, compared with the control group, the expression of rats in the alcohol+HFD group (p<0.001) increased significantly and compared with the alcohol group, the expression of rats in the alcohol+HFD group (p<0.05) increased significantly, which was statistically significant as shown in fig. 10A-fig. 10C.
As an amphiphilic substance, alcohol easily penetrates the blood-brain barrier and the free saturated fatty acids in food will affect the function of the blood-brain barrier. The above conditions affect the central nervous function and directly affect the neuronal plasticity and connectivity in the brain. The most common clinical symptom is dementia. The prefrontal cortex is responsible for emotional, cognitive, executive and other functions, and can regulate the addictive behavior of the body through the limbic reward system. Current data show that cognitive and motor impairment by alcohol dependence is the result of disturbed coordinated activity in multiple brain regions interacting with frontal lobe structures, rather than a single region in the prefrontal cortex[10]. The hippocampus is involved in cognitive and memory processing, and depending on the specific requirements of the task, bidirectionally modulates synaptic projections from the temporal part of the hippocampal formation to the ipsilateral prefrontal, known as the prefrontal-hippocampal pathway[11]. A growing body of research demonstrates that the cerebellum not only controls the role of coordinated movements but also extends to cognitive function and multiple lines of evidence from clinical, neuroimaging and anatomical studies in primates suggest that the cerebellum forms “closed-loop” connections with neocortical brain regions including the prefrontal cortex[12]. Interactions between various regions of the brain ensure information transmission and execution, including spatial processing, working memory and emotion regulation, therefore, the prefrontal-hippocampal-cerebellar circuit is considered to be an important component of behavior from motor coordination to cognition[13,14]. During critical stages of pubertal development, the central nervous system is susceptible to alcohol and HFD, and leads to irreversible abnormalities in brain structure and function during brain ontogeny, resulting in behavioral and cognitive deficits[15]. The formation of drinking habits can be regarded as a form of reinforcement learning and continuous alcohol consumption leads to an increased sense of rewarding experience in the body[16]. Berre et al.[17] emphasized that in alcohol-dependent patients, there are extensive gray matter atrophy at the key nodes of the reward system (such as prefrontal lobe, dorsal anterior cingulate cortex and hippocampus), abnormal changes in synaptic plasticity and remodeling and function of neuronal connections[18], seriously damaging the prefrontal hippocampal loop, which is related to the severity of cognitive and executive impairment. The developing cerebellum is particularly sensitive to alcohol toxicity. The developing cerebellum is particularly sensitive to alcohol toxicity and Granule Cell Parallel Fiber-Purkinje cells (GPP) synaptic sites and Mossy Fiber-Granule Cell-Golgi cells (MGG) synaptic sites in the cerebellum are targets of alcohol[19]. Alternatively, alcohol activates double-stranded RNAactivated Protein Kinase (PKR), which activates alcohol-induced neuroinflammation and neurotoxicity in the developing cerebellum. Alcohol alters the connectivity of the cerebellum with other regions of the brain after reduced Purkinje cell damage[20]. Voxel- Based Morphometry (VBM) studies have shown an atrophic pattern involving tissues such as the prefrontal cortex, cingulate cortex, thalamus, hiappocampus and cerebellum in alcohol-dependent patients[21]. Rogers et al.[22] studies have also found reduced connectivity between the prefrontal cortex (Brodmann area 9) and inferior cerebellar lobe VIII and between premotor areas (Brodmann area 6) and superior cerebellar lobe VI in alcohol-dependent patients. Evidence supports the hypothesis that the cognitive alterations observed in alcohol dependence involve prefrontal–hippocampal– cerebellar circuits, including key nodes of memory and executive networks. In addition to reduced connectivity in the prefrontal–hippocampal-cerebellar circuitry, irreversible changes also occur in various brain regions involved in cognition. Smaller hippocampal and cerebellar volumes and thinner medial prefrontal cortex have been found in alcohol-dependent patients and the volumes of hippocampus and cerebellum are related to impaired cognitive function as well as disease duration[23]. The prefrontal cortex appears to be particularly sensitive to alcohol-induced neurodegeneration; it has been shown that chronic alcohol intake and overeating in rats lead to a reduction in the extent of prefrontal astrocyte processes[24]. In a study based on a stereological system, it was observed that chronic alcohol consumption resulted in reduced prefrontal and anterior cingulate volumes, reduced prefrontal mean neuronal volume and reduced total neuronal volume in rats[25]. Adolescent rats fed with HFD and alcohol showed astrogliosis in the granular layer of the dentate gyrus of the hippocampus and a decrease in the number of mature neuronal cells in the CA3 region [26,27]. Under the same conditions, both the area and volume of the cerebellum became smaller, alcohol consumption had the greatest effect on the cerebellar vermis and smaller cerebellar measurements were positively associated with poorer performance in cognitive performance[28]. Lucas et al. [29] reported that Purkinje cells were atrophic in rabbits given a HFD and maternal hypercholesterolemia significantly induced a pleomorphic shape of granule cells associated with demyelination in the cerebellum of offspring. This study was consistent with the previous study. Compared with the control group, the pyramidal cells of prefrontal cortex and hippocampus, Purkinje cells of cerebellum were significantly reduced and apoptotic cells were gradually increased in the alcohol group and alcohol+HFD group at 4 w, 8 w and 12 w after model establishment. With the change of central neuronal cells, the longer the model establishment time, the more severe the degree of cognitive impairment in the alcohol group and alcohol+HFD group. These findings supported that the cognitive impairment related to HFD and alcohol dependence was related to the damage of prefrontal-hippocampal-cerebellar circuit.
Oxidative stress, microglial activation and inflammatory response are three closely linked mechanisms, which are responsible for neurodegenerative diseases associated with alcohol dependence[30]. Alcohol is primarily metabolized by alcohol dehydrogenase and the cytochrome P450 system[31]. Acetaldehyde produced by these oxidative pathways is due to its oxidase aldehyde dehydrogenase of slow kinetics and accumulation[32]. Ethanol and acetaldehyde affect the liver and brain through direct production of Reactive Oxygen Species (ROS) and indirect production of TGF-β[33]. TGF-β1 acts as an effective immunomodulator and its overexpression is associated with neuroinflammation, accumulation of extracellular matrix compounds and cerebrovascular fibrosis as well as neuronal apoptosis development[8]. By activating the Smad pathway, TGF-β binds to the TGF-β type II receptor (TGF-βRII) and recruits and phosphorylates TGF-βRI, which activates Smad2 and Smad3 by phosphorylation, followed by binding to Smad4 to form a complex that translocates to the nucleus and further regulates the expression of various target genes involved in cell proliferation. The TGF-β1/Smad pathway plays a central role in the brain’s response to inflammation and injury, but the specific role of the TGF-β1/Smad pathway in the pathogenesis of cognitive impairment remains unclear. Alcohol exposure can alter the morphology and phenotype of astrocytes and microglia, suggesting that glia are target cells for alcohol[34]. Some previous studies have shown that TGF-β1 may play a protective role in Alzheimer’s Disease (AD) through its neuropromoting function and promoting Amyloid-β (Aβ) clearance by activating microglia[35]. However, it has recently been found that TGF-β1 expression is upregulated in the brains of both AD patients and AD animal models[36]. Some studies further reported that TGF-β1 enhances/triggers an increase in β-amyloid production in mouse and human astrocyte cultures and transgenic mice over-expressing TGF-β1 in astrocytes cause Aβ[37]. Emma et al. found that after chronic intermittent alcohol exposure, the specific transcriptional genes of astrocytes and microglia in mouse prefrontal cortex were changed by in microglia. The steady-state function mediated by TGF-β/Smad pathway signal transduction and the genes involved in inflammatory response are destroyed. Moreover, microglia activated by HFD and alcohol dependence lead to a sustained inflammatory response and a surge of related proinflammatory factors (such as tumor necrosis factor-alpha, interleukin-1β and interleukin-6) and damage to the brain persists[38].
TGF-β1 is central to the fibrotic response of the cerebrovascular system, which is significantly increased in the brain, cerebrospinal fluid or blood and cerebrovascular[39] AD patients[40]. In animal experiments, TGF-β1 characteristics of the cerebral vasculature in mice include thickening of the vessel wall, impaired dilation and contractility, chronic cerebral hypoperfusion, neurovascular coupling and cerebral microbleeds[41]. From young mice to old mice, the levels of vascular fibrosis related growth factors (vascular endothelial growth factor and connective tissue growth factor) and several fibrinogen levels increased, such as type I collagen and type IV collagen, these factors leading to vasodilation and systolic dysfunction lead to cognitive impairment in rats[42]. In addition, further studies have shown that TGF-β messenger RNA (mRNA) levels at cortical sites are associated with intracerebrovascular Aβ. The degree of deposition presents a positive relationship[43]. In a study on the pathomechanism of astrocytes on AD, it was found that amyloid degeneration was associated with TGF-β/ Smad signaling activation is associated with promoting astrogliosis, amyloid plaque formation and aggravated cognitive impairment, indicating that TGF-β/Smad signaling activation is inevitably linked to cognitive impairment and amyloid plaque accumulation[44]. In this experiment, consistent with the results of previous studies, significant impairment of cognitive function was caused by alcohol and alcohol+HFD in rats, and significant reduction of neurogenic cells was observed in the brain tissue of prefrontal-hippocampal-cerebellar circuits. Through the detection of TGF-β1, p-Smad3 and Smad4, the results showed that with the superposition of risk factors, the high expression of TGF-β1, p-Smad3 and Smad4 in the prefrontal cortex, hippocampus and cerebellum was directly proportional to the severity of cognitive impairment. The expression of TGF-β1, p-Smad3 and Smad4 in the prefrontal-hippocampalcerebellar circuit of rats gradually increased, which may be that alcohol and diet stimulate the overexpression of TGF-β/Smad pathway and promote neuroinflammation, accumulation of extracellular matrix compounds and cerebrovascular atherosclerosis and Aβ accumulation, leading to cognitive impairment.
In this study, we observed the changes of cognitive behavior and the changes of nerve cells in prefrontal hippocampal-cerebellar circuits in rats fed with alcohol, alcohol+HFD for 4 w, 8 w and 12 w at different times, and observed that the expression of inflammatory factors TGF-β1, p-Smad3 and Smad4 in prefrontal hippocampal-cerebellar circuits was positively correlated with the degree of cognitive impairment, indicating that prefrontal hippocampal-cerebellar circuits mediate motor memory and working memory deficits, which may be related to Aβ deposition and neuritic plaque accumulation in the brain caused by TGF-β/Smad activation. Therefore, this study also provides a new idea for the current anti-cognitive impairment, which may inhibit the signal of abnormally increased TGF-β/Smad in peripheral and central nervous tissues, is a favorable way to treat dementia.
Funding:
This article was supported by the National Key R&D Program of China (2018YFC1314400).
Conflict of interests:
The authors declared no conflicts of interest.
References
- Qiao X, Sun M, Chen Y, Jin W, Zhao H, Zhang W, et al. Ethanol-induced neuronal and cognitive/emotional impairments are accompanied by down-regulated NT3-TrkC-ERK in hippocampus. Alcohol Alcohol 2021;56(2):220-9.
[Crossref] [Google Scholar] [PubMed]
- King JA, Nephew BC, Choudhury A, Poirier GL, Lim A, Mandrekar P. Chronic alcohol-induced liver injury correlates with memory deficits: Role for neuroinflammation. Alcohol 2020;83:75-81.
[Crossref] [Google Scholar] [PubMed]
- Samant NP, Gupta GL. Adiponectin: A potential target for obesity-associated Alzheimer's disease. Metab Brain Dis 2021;36:1565-72.
[Crossref] [Google Scholar] [PubMed]
- Gibula-Tarlowska E, Kotlinska JH. Kissorphin improves spatial memory and cognitive flexibility impairment induced by ethanol treatment in the Barnes maze task in rats. Behav Pharmacol 2020;31(2-3):272-82.
[Crossref] [Google Scholar] [PubMed]
- Van Overwalle F, Manto M, Cattaneo Z, Clausi S, Ferrari C, Gabrieli J, et al. Consensus paper: Cerebellum and social cognition. Cerebellum 2020;19:833-68.
[Crossref] [Google Scholar] [PubMed]
- Sui R, Zhang L. Cerebellar dysfunction may play an important role in vascular dementia. Med Hypotheses 2012;78:162-5.
[Crossref] [Google Scholar] [PubMed]
- Stanton ME, Murawski NJ, Jablonski SA, Robinson-Drummer PA, Heroux NA. Mechanisms of context conditioning in the developing rat. Neurobiol Learn Mem 2021;179:107388.
[Crossref] [Google Scholar] [PubMed]
- Zhang X, Huang WJ, Chen WW. TGF-β1 factor in the cerebrovascular diseases of Alzheimer's disease. Eur Rev Med Pharmacol Sci 2016;20:5178-85.
[Google Scholar] [PubMed]
- Pandey SN, Kwatra M, Dwivedi DK, Choubey P, Lahkar M, Jangra A. 7,8-Dihydroxyflavone alleviated the high-fat diet and alcohol-induced memory impairment: Behavioral, biochemical and molecular evidence. Psychopharmacology (Berl) 2020;237:1827-40.
[Crossref] [Google Scholar] [PubMed]
- Zahr NM, Pfefferbaum A, Sullivan EV. Perspectives on fronto-fugal circuitry from human imaging of alcohol use disorders. Neuropharmacology 2017;122:189-200.
[Crossref] [Google Scholar] [PubMed]
- Soltani Zangbar H, Ghadiri T, Seyedi Vafaee M, Ebrahimi Kalan A, Fallahi S, Ghorbani M, et al. Theta oscillations through hippocampal/prefrontal pathway: Importance in cognitive performances. Brain Connect 2020;10:157-69.
[Crossref] [Google Scholar] [PubMed]
- Watson TC, Becker N, Apps R, Jones MW. Back to front: Cerebellar connections and interactions with the prefrontal cortex. Front Syst Neurosci 2014;8:4.
[Crossref] [Google Scholar] [PubMed]
- Engelhardt E. Cerebrocerebellar system and Türck's bundle. J Hist Neurosci 2013;22:353-65.
[Crossref] [Google Scholar] [PubMed]
- Ernst TM, Thürling M, Müller S, Kahl F, Maderwald S, Schlamann M, et al. Modulation of 7 T fMRI signal in the cerebellar cortex and nuclei during acquisition, extinction and reacquisition of conditioned eyeblink responses. Hum Brain Mapp 2017;38(8):3957-74.
[Crossref] [Google Scholar] [PubMed]
- Zou G, Su J, Zhang Y, Li F, Li C, Meng X. Effects of environmental enrichment on cognitive behavior and the expression of adenosine triphosphate binding cassette transporter A7 in hippocampus of adolescent mice with high fat diet. Zhong Nan Da Xue Xue Bao Yi Xue Ban 2020;45(8):892-900.
[Google Scholar] [PubMed]
- Newlin DB, Strubler KA. The habitual brain: An "adapted habit" theory of substance use disorders. Subst Use Misuse 2007;42:503-26.
[Crossref] [Google Scholar] [PubMed]
- Le Berre AP, Rauchs G, La Joie R, Mézenge F, Boudehent C, Vabret F, et al. Impaired decision-making and brain shrinkage in alcoholism. Eur Psychiatry 2014;29:125-33.
[Crossref] [Google Scholar] [PubMed]
- Guerri C, Pascual M. Mechanisms involved in the neurotoxic, cognitive and neurobehavioral effects of alcohol consumption during adolescence. Alcohol 2010;44(1):15-26.
[Crossref] [Google Scholar] [PubMed]
- Dar MS. Ethanol-induced cerebellar ataxia: Cellular and molecular mechanisms. Cerebellum 2015;14(4):447-65.
[Crossref] [Google Scholar] [PubMed]
- Luo J. Effects of ethanol on the cerebellum: Advances and prospects. Cerebellum 2015;14(4):383-5.
[Crossref] [Google Scholar] [PubMed]
- Galandra C, Basso G, Manera M, Crespi C, Giorgi I, Vittadini G, et al. Salience network structural integrity predicts executive impairment in alcohol use disorders. Sci Rep 2018;8(1):1-3.
[Crossref] [Google Scholar] [PubMed]
- Yoon EJ, Choi JS, Kim H, Sohn BK, Jung HY, Lee JY, et al. Altered hippocampal volume and functional connectivity in males with internet gaming disorder comparing to those with alcohol use disorder. Sci Rep 2017;7(1):1-2.
[Crossref] [Google Scholar] [PubMed]
- Rogers BP, Parks MH, Nickel MK, Katwal SB, Martin PR. Reduced fronto-cerebellar functional connectivity in chronic alcoholic patients. Alcohol Clin Exp Res 2012;36(2):294-301.
[Crossref] [Google Scholar] [PubMed]
- West RK, Maynard ME, Leasure JL. Binge ethanol effects on prefrontal cortex neurons, spatial working memory and task-induced neuronal activation in male and female rats. Physiol Behav 2018;188:79-85.
[Crossref] [Google Scholar] [PubMed]
- Conte R, Ladd FV, Ladd AA, Moreira AL, le Sueur-Maluf L, de Barros Viana M, et al. Behavioral and stereological analysis of the prefrontal cortex of rats submitted to chronic alcohol intake. Behav Brain Res 2019;362:21-7.
[Crossref] [Google Scholar] [PubMed]
- Vilpoux C, Fouquet G, Deschamps C, Lefebvre E, Gosset P, Antol J, et al. Astrogliosis and compensatory neurogenesis after the first ethanol binge drinking-like exposure in the adolescent rat. Alcohol Clin Exp Res 2022;46(2):207-20.
[Crossref] [Google Scholar] [PubMed]
- Chiazza F, Bondi H, Masante I, Ugazio F, Bortolotto V, Canonico PL, et al. Short high fat diet triggers reversible and region specific effects in DCX+ hippocampal immature neurons of adolescent male mice. Sci Rep 2021;11(1):1-4.
[Crossref] [Google Scholar] [PubMed]
- Cardenas VA, Hough CM, Durazzo TC, Meyerhoff DJ. Cerebellar morphometry and cognition in the context of chronic alcohol consumption and cigarette smoking. Alcohol Clin Exp Res 2020;44(1):102-13.
[Crossref] [Google Scholar] [PubMed]
- Lucas EK, Reid CS, McMeekin LJ, Dougherty SE, Floyd CL, Cowell RM. Cerebellar transcriptional alterations with Purkinje cell dysfunction and loss in mice lacking PGC-1α. Front Cell Neurosci 2015;8:441.
[Crossref] [Google Scholar] [PubMed]
- Triviño JJ, von Bernhardi R. The effect of aged microglia on synaptic impairment and its relevance in neurodegenerative diseases. Neurochem Int 2021;144:104982.
[Crossref] [Google Scholar] [PubMed]
- Paquot N. The metabolism of alcohol. Rev Med Liege 2019;74(5-6):265-7.
[PubMed]
- Mackus M, van de Loo AJ, Garssen J, Kraneveld AD, Scholey A, Verster JC. The role of alcohol metabolism in the pathology of alcohol hangover. J Clin Med 2020;9(11):3421.
[Crossref] [Google Scholar] [PubMed]
- Bjørkhaug ST, Neupane SP, Bramness JG, Aanes H, Skar V, Medhus AW, et al. Plasma cytokine levels in patients with chronic alcohol overconsumption: Relations to gut microbiota markers and clinical correlates. Alcohol 2020;85:35-40.
[Crossref] [Google Scholar] [PubMed]
- Erickson EK, Blednov YA, Harris RA, Mayfield RD. Glial gene networks associated with alcohol dependence. Sci Rep 2019;9(1):1-3.
- Kashima R, Hata A. The role of TGF-β superfamily signaling in neurological disorders. Acta Biochim Biophys Sin 2018;50(1):106-20.
[Crossref] [Google Scholar] [PubMed]
- Hamel E. Cerebral circulation: Function and dysfunction in Alzheimer's disease. J Cardiovasc Pharmacol 2015;65(4):317-24.
[Crossref] [Google Scholar] [PubMed]
- Siqueira M, Francis D, Gisbert D, Gomes FC, Stipursky J. Radial glia cells control angiogenesis in the developing cerebral cortex through TGF-β1 signaling. Mol Neurobiol 2018;55(5):3660-75.
[Crossref] [Google Scholar] [PubMed]
- Akhtar F, Rouse CA, Catano G, Montalvo M, Ullevig SL, Asmis R, et al. Acute maternal oxidant exposure causes susceptibility of the fetal brain to inflammation and oxidative stress. J Neuroinflammation 2017;14(1):1-7.
- Gengler S, Hamilton A, Hölscher C. Synaptic plasticity in the hippocampus of a APP/PS1 mouse model of Alzheimer's disease is impaired in old but not young mice. PLoS one 2010;5(3):e9764.
[Crossref] [Google Scholar] [PubMed]
- Zhang ZY, Li C, Zug C, Schluesener HJ. Icariin ameliorates neuropathological changes, TGF-β1 accumulation and behavioral deficits in a mouse model of cerebral amyloidosis. PloS one 2014;9(8):e104616.
[Crossref] [Google Scholar] [PubMed]
- Gorelick PB, Scuteri A, Black SE, DeCarli C, Greenberg SM, Iadecola C, et al. Vascular contributions to cognitive impairment and dementia: A statement for healthcare professionals from the American Heart Association/American Stroke Association. Stroke 2011;42(9):2672-713.
[Crossref] [Google Scholar] [PubMed]
- Nicolakakis N, Aboulkassim T, Aliaga A, Tong XK, Rosa-Neto P, Hamel E. Intact memory in TGF-β1 transgenic mice featuring chronic cerebrovascular deficit: Recovery with pioglitazone. J Cereb Blood Flow Metab 2011;31(1):200-11.
[Crossref] [Google Scholar] [PubMed]
- Flores B, von Bernhardi R. Transforming growth factor β1 modulates amyloid β-induced glial activation through the Smad3-dependent induction of MAPK phosphatase-1. J Alzheimers Dis 2012;32(2):417-29.
[Crossref] [Google Scholar] [PubMed]
- Zheng JY, Sun J, Ji CM, Shen L, Chen ZJ, Xie P, et al. Selective deletion of apolipoprotein E in astrocytes ameliorates the spatial learning and memory deficits in Alzheimer's disease (APP/PS1) mice by inhibiting TGF-β/Smad2/STAT3 signaling. Neurobiol Aging 2017;54:112-32.
[Crossref] [Google Scholar] [PubMed]
