- *Corresponding Author:
- Jiang Liu
Department of Neurology, The First People’s Hospital of Yunnan Province, Kunming City- 650034, China
E-mail: liujiang1e2e@126.com
| This article was originally published in Special issue“Trends in Therapeutic Management of Various Clinical Conditions-II” |
| Indian J Pharm Sci 2020:83(2)Spl issue;72-75 |
This is an open access article distributed under the terms of the Creative Commons Attribution-NonCommercial-ShareAlike 3.0 License, which allows others to remix, tweak, and build upon the work non-commercially, as long as the author is credited and the new creations are licensed under the identical terms
Abstract
This paper aims to research the expression of forkhead box O3 transcription factor in the brain of Alzheimer’s rats. First, the rats were selected as subjects and divided into Alzheimer’s disease group and normal control group to establish the Alzheimer model. Then the positive forkhead box O3 immunoreactivity was observed in the posterior thalamus, cortex and hippocampus of rats, together with the changes of positive neurons in these locations. Results have shown that the number of positive cells in the cortex, thalamus and hippocampus of the experimental group was significantly higher than that of the control group, and the difference between the groups was statistically significant (p<0.05). Also, the optical density of the experimental group in the carbonic anhydrase 2, cortex, and carbonic anhydrase 1 regions was significantly higher than that of the control group, with the inter-group of statistical significance (p<0.05). It is concluded that forkhead box O3 is highly related to Alzheimer’s disease. The expression of forkhead box O3, whether leading to endoplasmic reticulum protein apoptosis or protection, will affect Alzheimer’s disease.
Keywords
Foxo3a transcription factor, expression changes, alzheimer’s model
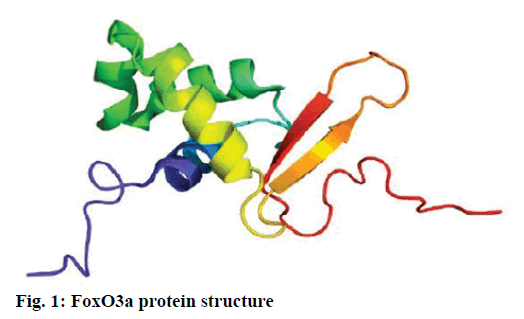
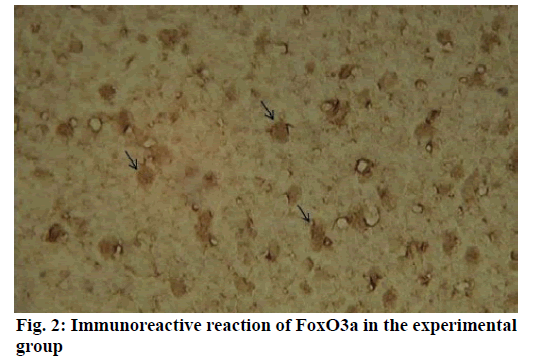
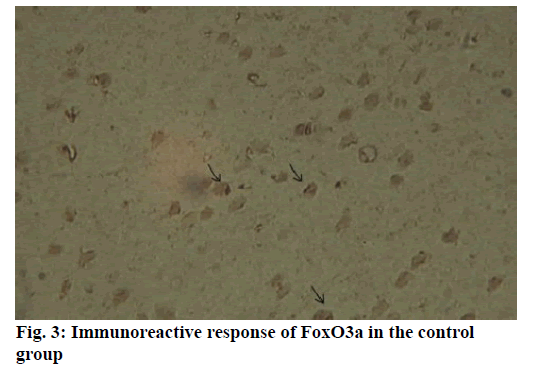
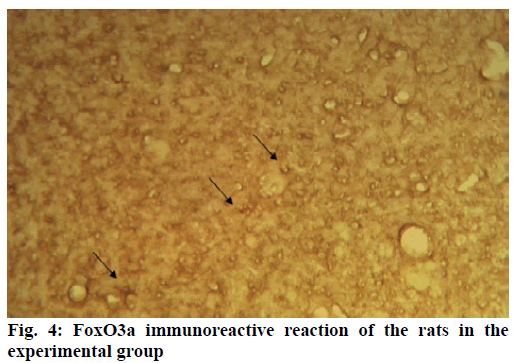
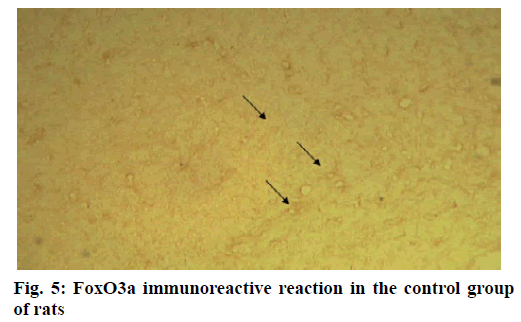
Alzheimer’s disease is a disease in the central nervous system that may cause problems in patient’s memory and cognitive functions with a certain mortality rate. Alzheimer’s disease, pathologically featuring extracellular senile plaques, has high in the elderly population. There is currently no cure for the disease and therefore poses a great threat to human life and health. According to relevant statistics in 2006, the number of patients with Alzheimer’s disease in the world reached 26 million. It is estimated that by 2050, one out of 85 people on average will have this disease, and such disease highly prevails in developing countries [1]. According to the relevant domestic forecasts, the number of Alzheimer’s patients will increase threefold from 2001 to 2040 to about 15 million. Alzheimer’s disease, also known as presenile dementia, is a disease of the central nervous system caused by the brain’s nervous system and spinal cord. Despite of many researched, the pathogenesis of Alzheimer’s disease has not been unified. The hypotheses include microtubule-associated protein hypothesis, hypocholesterolemic hypothesis, and starch-like protein hypothesis [2]. In the fifties of last century, British scholars proposed a free radical aging theory that free radicals are the root cause of aging. When free radicals begin to supply macromolecules and cause damage to tissue cells, the body will suffer aging issues, and is thus prone to malignancy. Based on the theory of free radical aging, oxidative stress has also been proposed as a response to the imbalance between the collective antioxidant system and reactive oxygen species [3]. When the oxidative stress reaction occurs in the body, many free radicals and peroxides appear, causing serious damage to human cells. Therefore, there is a close relationship between oxidative stress reaction and Alzheimer’s disease. The transcription factor Fox can control the expression of genes and regulate the metabolism, development or differentiation of the human body by adjusting the expression of target genes. Forkhead box O3 (Foxo3a) is a transcription factor in mammals. This protein molecule can resist oxidative stress by regulating the expression of target genes so as to regulate apoptosis. Therefore, Foxo3a may pose certain effect on Alzheimer’s disease. In the study of the mechanism of foxo3a transcription factors, the researches on brain nerve cells have increased. It has been found from relevant studies that this transcription factor can not only promote nerve cell proliferation and cell survival, but also induce the apoptosis of nerve cells [4]. Alzheimer’s disease is a type of disease in the central nervous system. There is no definitive study showing whether foxo3a transcription factors interact with Alzheimer’s Disease (AD). Therefore, it is necessary to explore the expression changes of foxo3a transcription factor in Alzheimer’s disease. This article, with rats as the research object that were divided into AD group and Normal Control (NC), studied the changes in the expression of the foxo3a transcription factor in the Alzheimer’s rat brain. Specifically, this article mainly analyzed the immunoreactivity, which mainly exists in the hippocampus, parafascicular nucleus and cortex. When the oxidative stress reaction occurs in the body, the damage of the brain nerve cells in the hippocampus and cortex is more obvious. The 3rd α helix of several major Fox protein families recognizes the shared Deoxyribonucleic acid (DNA) sequence as 5’-TTGTTTAC-3’, and the binding of amino acid residues on both sides to DNA is also specific. 5 amino acids (SNSSA) are inserted between the 2nd and 3rd α helices of the forkhead box (FoxO) protein, which is the difference between FoxO and other Fox groups. The FoxO gene is highly conserved in evolution. FoxO has three highly conserved regions in its amino acid sequence, including the protein kinase B (PKB) phosphorylation motif. The first phosphorylation motif is located after the start codon, the second phosphorylation motif in the Forkhead region, and the third in the Forkhead region. However, the third conserved region of FoxO6 is missing, including four serine phosphorylation sites: PKB phosphorylation site, CK1 phosphorylation sites and DYRK1A phosphorylation site [5]. The amino acid sequence identified by PKB (RXRXXS/T) is highly consistent in FoxO1 and FoxO4. FoxO contains more Ser (11.7 %) and Gln (13.4 %) at the C-terminus, which is consistent with the structural characteristics of the transcription factor. (The protein structure of FoxO3a is shown in (fig. 1). FoxO controls cell fate by regulating gene expression, involving cell apoptosis, cell cycle switching, DNA repair, oxidative stress, cell differentiation, and glucose metabolism. PKB/FoxO is a regulatory switch for the transcription of many genes. Accompanied by phosphorylation and dephosphorylation of FoxO and dissociation and binding of DNA, the expression of certain genes can be turned off or activated. Under different conditions, FoxO can induce different physiological responses. There are two main modes of action: FoxO directly interacts with gene promoters; FoxO regulates target genes by interacting with other transcription factors. (Target genes for FoxO in mammals are shown in Table 1 below.) For example, in the differentiation of uterine endothelium stromal cells, FoxO1 can interact with C/EBP β transcription factors to regulate the expression of target genes. FoxO can induce both apoptosis and cell cycle arrest by inhibition of the expression of protein P27K1P1 in the cell cycle. Also, FoxO can regulate the expression of mitotically associated cyclin B and polo-like kinases. Recent studies have found that FoxO4 can also directly regulate Gadd45 (Gadd45 can induce DNA damage and cell growth arrest) and manganese superoxide dismutase (MnSOD) gene expression, protect resting cells from oxidative damage, and promote DNA repair [6]. Model grouping: After one week of adaptive feeding, rats were randomly divided into three groups: control group, experimental group, and blank group, with 5 rats in each group. Place them in different cages, with number and mark added. (2) Modeling method: intraperitoneal injection and intragastric administration. (3) Establishment process: 15 male young rats (200g) were purchased and divided into experimental group (5), control group (5) and blank group (5). All rats freely drank water with 200g of food provided per day, and were kept at a constant temperature of 20 degrees. Rats in the experimental group were given intraperitoneal injection of D-galactose (100 mg/kg) and stomach-fed AlCl3 (2 ml, 20 mg/ml) daily for 8 weeks; rats in the control group were injected intraperitoneally physiological saline with the same amount as that of D-galactose in the experimental group and physiological saline in the stomach (2ml); blank group rats freely had food. The rats’ hair condition, physical changes, activity and mental status were observed daily and recorded. Body weight and food intake (food intake=total foodfood balance) were measured every 3 d. The open-field experiment is an experiment that detects the degree of curiosity and activity of an experimental subject in an unfamiliar environment as well as its attention to selfimage. The opaque open-end device made of black material on the perimeter wall and the bottom surface was adopted with the length of the bottom side of 100 cm. It was divided into 25 equal areas by white line, with each of 40 cm in height. Rats were placed in the center square to observe their central grid residence time within 5 min, the number of erection of the hind limbs (the two forepaws lifted or climbed the siding wall), the number of squares crossed (four claws all entered the squares), and the number of cleaning activities. The test was conducted every seven days at 17:00. After two months of modeling, the tissue (brain) was taken by paraffin embedding and preserved at -80° [7]. As for the silver staining method, Bielshowsky nerve fiber staining was used. The FoxO3a immunopositive reaction (fig. 2) is mainly distributed in the cortex, hippocampus, posterior lateral nucleus, parafascicular nucleus and septal nucleus. The dentate gyrus staining is the most obvious. Compared with the control group, most of the positive cells in the experimental group swelled and deformed, with many cavities. Cortex: FoxO3a positive immunoreactivity (fig. 3) is mainly distributed in the outer pyramidal layer and the inner pyramidal layer. In the experimental group, the positive cells are mostly cone-shaped and round, and the positive substance mainly localizes the cytoplasm with deeper staining. While in the control group, the cells are cone-shaped, round or triangular, and the positive substance is only slightly distributed in the nucleus and lightly colored. In addition, there were individual cells stained in the inner and outer granular layers and polymorphic layers, while the staining in the molecular layer was not obvious [8]. Thalamus and hypothalamic nucleus: Positive reaction cells were distributed in both the experimental group and the control group, and darker in the experimental group than in the control group, especially in the posterolateral thalamus, parafascicular nucleus, and septal nucleus (fig. 4). The number of positive cells in the experimental group was relatively large, round or triangular, and the positive substance was evenly distributed in the cytoplasm with deeper color. However, there were less positive cells in the control group, round or triangular, and the positive substance was located in the nucleus and lightly colored (fig. 5). Hippocampus: FoxO3A immunoreactivity was mainly distributed in the Carbonic Anhydrase (CA) 1 and CA2 pyramidal regions and dentate gyrus. In the experimental group with obvious coloring, the positive cells were mostly cone-shaped, and the positive substance was located in the cytoplasm with less nucleus and more dead cells in the area. In addition, a small amount of FoxO3a immunostaining positive cells were also distributed in the radioactive layer and polytype layer. However, in the control group, the staining was significantly weaker, and the cells were normal in the morphology and size, conical, round, or triangular, with a small amount of positive substances distributed in the nucleus and no large empty holes. Densitometric statistics (as shown in Table 2 below) showed that in the cortex, CA1, and CA2 areas, the density of the experimental group was significantly greater than that of the control group. The D-gal and AlCl3 induced AD rats are an ideal AD animal model, whose brains showed more swelling and even apoptosis. There was a significant difference in expression levels between AD and NC groups. FoxO3a expression was increased in AD, especially in regions rich in cholinergic neurons. As for the subcellular distribution of FoxO3a, nuclear translocation of FoxO3a occurred in the AD group, and the distribution of FoxO3a shifted from the nucleus to the cytoplasm. However, the experiments still need to be improved. In modeling, rats showed higher mortality, indicating the necessity of the doses of D-gal and AlCl3 to be explored. In behavioral tests, the number of rats can be further expanded to obtain better statistical data. Considering the exploration of the FoxO3a distribution, the systematic research was not conducted according to the modeling time course. Also, the relationship between cell morphology changes in the cerebral cortex and hippocampus of AD rats and AD pathology requires further study.
| Target genes | Biological function |
|---|---|
| Bcl-2 | Induce apoptosis |
| Bcl-6 | Transcription inhibition |
| Bim | Induce the apoptosis pathway of endogenous source |
| Catalase | Inhibits oxidative stress and protects cells from peroxide damage |
| CyclinB | Promote cell cycle completion |
| FasL | Apoptosis induced by cell death receptor mediated apoptosis |
| Gadd45 | Repair of DNA damage |
| MnSOD | Inhibits oxidative stress and protects cells from peroxide damage |
| p27KIP1 | Inhibit proliferation and induce apoptosis |
| Pik | Promote cell cycle completion |
| TRAIL | Induce apoptosis |
Table 1: Target Genes of Foxo in the Mammalian
References
- Ramalingam M, Kim SJ. Reactive oxygen/nitrogen species and their functional correlations in neurodegenerative diseases. J Neural Transm 2012;119(8):891-910.
- Bartzokis G. Alzheimer’s disease as homeostatic responses to age-related myelin breakdown. Neurobiol Aging 2009;32(8):1341-71.
- Alstott J, Timberlake W. Effects of rat sex differences and lighting on locomotor exploration of a circular open field with free-standing central corners and without peripheral walls. Behav Brain Res 2009;196(2):214-9.
- Brookmeyer R, Johnson E, Ziegler-Graham K, Arrighi HM. Forecasting the global burden of Alzheimer’s disease. Alzheimers Dement 2007;3(3):186.
- Gould TD, Dao DT, Kovacsics CE. The Open Field Test. Neuromethods 2009;83(2):1-20.
- Anderson KG, Woolverton WL. Effects of clomipramine on self-control choice in Lewis and Fischer 344 rats. Pharmacol Biochem Behav 2005;80(3):387-93.
- Sureda FX, Gutierrez-Cuesta J, Romeu M, Canudas AM, Camins A, Mallol J, et al. Changes in oxidative stress parameters and neurodegeneration markers in the brain of the senescence-accelerated mice SAMP-8. Exp Gerontol 2006;41(4):360-7.
- Chen B, Cheng M, Hong DJ, Sun FY, Zhu CQ. Okadaic acid induced cyclin B1 expression and mitotic catastrophe in rat cortex. Neurosci Lett 2006;406(3):178-82.
