- *Corresponding Author:
- MD, Sarfaraz
Department of Pharmaceutics
NET Pharmacy College
Raichur- 584103
Karnataka, India
E-mail: sarfindia@gmail.com
| Date of Received | 08 April 2020 |
| Date of Revision | 15 December 2020 |
| Date of Acceptance | 18 December 2020 |
| Indian J Pharm Sci 2020;82(5):787-798 |
This is an open access article distributed under the terms of the Creative Commons Attribution-NonCommercial-ShareAlike 3.0 License, which allows others to remix, tweak, and build upon the work non-commercially, as long as the author is credited and the new creations are licensed under the identical terms
Abstract
Hydroxyzine hydrochloride is a histamine H1 receptor antagonist used in the treatment for chronic urticaria, dermatitis, and histamine-mediated pruritus. Hydroxyzine hydrochloride has a bitter taste. The bitter taste of drug was masked by using a combination of flavor and complexing with β-cyclodextrines adopting solid dispersion technique. The taste masking ability of solid dispersions was evaluated by in vivo taste evaluation in healthy human volunteers. The Optimized taste masked solid dispersion of drug was developed as fast dissolving tablets by direct compression method using superdisintegrants like sodium starch glycolate, croscarmellose sodium and crospovidone in different concentration as per 23 factorial design model. Tablets were evaluated for their physico-chemical properties, in vitro release studies. The hardness (3.8-4.2 kg/cm2), friability (0.22 %-0.43 %), drug content (91.7 %-99.5 %) and disintegration time (3.24-4.22 min) of fast dissolving tablets were found uniform and within the specified limits. Analysis of variance was used to identify significant effect on disintegration time, Coefficient of determination R2=0.995. Obtained value of F was larger than critical F-value, and the result was found to be significant at that level of probability (p<0.05). Similar R2=0.9023 value was obtained in case of dissolution rate for F value and the result was found to be significant at that level of probability (p<0.05). From the statistical results, optimized formula F9 was developed which gave disintegration time of 3.58±0.87 min and in vitro drug release of 95.89 %. The formulations followed first order mechanism of release (r2=0.953-0.991). Hence taste masked Hydroxyzine hydrochloride fast dissolving tablets could be successfully developed using factorial design modele.
Keywords
Fast dissolving tablets, Hydroxyzine hydrochloride, solid dispersion, cyclodextrin, Factorial design, In vitro release
Hydroxyzine hydrochloride, is a histamine H1 receptor antagonist, it is effective in the treatment of chronic urticaria, dermatitis, and histamine-mediated pruritus. It does cause drowsiness, it is used in symptoms of itching and is also effective as an antiemetic, for relief of anxiety and tension, and as a sedative[1]. Hydroxyzine Hydrochloride is the hydrochloride salt form of hydroxyzine, a piperazine histamine H1- receptorantagonist. Hydroxyzine hydrochloride is extremely bitter in taste, its half-life is 20-25 h, PKA protein binding is 93 %, and it is rapidly absorbed in Gastrointestinal Tract (GIT)[2]. Oral route of drug administration have wide acceptance and hence up to 50-60 % of total dosage forms are administered orally. The most popular dosage forms being tablets and capsules[3]. About 35 % of the general population in addition to 30-40 % of elderly institutionalized patients and 18-22 % of all persons in long term care facilities suffer from dysphagia, i.e. difficulty in swallowing[4]. Often times people experience inconvenience in swallowing conventional dosage forms such as tablet when water is not available, in the case of the motion sickness (kinetosis) and sudden episodes of coughing during the common cold. For these reasons, tablets that can rapidly dissolve or disintegrate in the oral cavity have attracted a great deal of attention[5]. Fast dissolving tablets (FDT) are also called as mouth-dissolving tablets, melt-in mouth tablets, orodispersible tablets, rapimelts, porous tablets, quick dissolving system etc. According to European pharmacopoeia, the FDT should disperse/ disintegrate in less than three min. Fast dissolving tablets are those when put on tongue disintegrate instantaneously releasing the drug which dissolve or disperses in the saliva. The faster the drug into solution, quicker the absorption and onset of clinical effect[6]. If the drug is bitter in taste, then taste masking becomes a prerequisite for bitter drugs to improve the patient compliance especially in the pediatric and geriatric population. Formulating buccal tablet and other formulations which come in contact with tastebuds, taste is one of critical factor to be considered that decides the commercial success of the product. Different methods to mask undesirable taste of the drugs are available, like adding sugars, flavors, sweeteners, coating drug, solid dispersion etc. Solid dispersion involves a dispersion of one or more active ingredients in an inner carrier or matrix in solid state prepared by melting, dissolution in solvent or melting-solvent method. The technique has been used for a wide variety of poorly aqueous soluble drug and for taste masking[7,8]. A common method used to investigate the effects of the values of the operational parameters (factors) on a process is the usual approach of changing the value of one factor at a time and noting its influence on a given characteristic of the final product (response). However, this method has some disadvantages: it requires a large number of trials and it does not reveal the possible interactions between factors. Factorial experimental designs can be efficient when several factors (more than two) are under study. By factorial design, in each complete trial, all possible combinations of the levels of the factors are investigated. The factors are commonly used at two levels. Normally, it is assumed that the response is approximately linear over the range of the factor level chosen[9]. One method of optimizing such experiments is to use factorial experimental designs (FEDs) to discover which factors influence the outcome of the experiment and what levels of these factors lead to an experiment with the greatest sensitivity.
Hence in the present research an attempt is made to develop FDT of taste masked hydroxyzine hydrochloride by 23 factorial design method.
Materials and Methods
Hydroxyzine hydrochloride was obtained as a gift sample from Mylan Laboratories limited, Bangalore. Cyclodextrine was obtained from Ajanta Pharmaceuticals, Mumbai. Crospovidone (CP), Sodium starch glycolate (SSG) and Croscaramellose sodium (CCS) were received from Helios Pharmaceuticals, Gujarat. Potassium dihydrogen orthophosphate and Micro crystalline cellulose were purchased from S.D Fine Chemicals Pvt Ltd, Mumbai. All other chemicals used were of analytical grade.
Preparation of Hydroxyzine hydrochloride-β Cyclodextrine Solid Dispersion:
Solid dispersion of Hydroxyzine hydrochloride was prepared by conventional fusion method using drug and β Cyclodextrine in different ratio 1:1, 1:2, 1:3, and 1:4 respectively (Table 1). Drug and β Cyclodextrine were heated at 60° and continuously mixed with a glass rod to form homogenous mixture and cooled at room temperature. The resultant mass was passed through sieve no.22 and stored in desiccators.
| CODE | RATIO | DRUG (mg) |
CARRIER (mg) |
|---|---|---|---|
| SD1 | 1:1 | 500 | 500 |
| SD2 | 1:2 | 500 | 1000 |
| SD3 | 1:3 | 500 | 1500 |
| SD4 | 1:4 | 500 | 2000 |
SD-Solid dispersion of drug and β cyclodextrine
Table 1: Composition of Hydroxyzine Hydrochloride-β Cyclodextrine Solid Dispersion
Drug content analysis:
An accurately weighed quantity of solid dispersion equivalent to 25 mg of Hydroxyzine hydrochloride was taken into 100 ml volumetric flask, dissolved in phosphate buffer of pH 6.8 and the solution was filtered through whatman filter paper no.41. The filtrate was collected and suitably diluted with buffer. The drug content was determined at 231 nm by UVspectrophotometer (UV-1700 Shimadzu Corporation, Japan) against blank.
In vivo Taste Evaluation[10-12]:
At the outset, the study was initiated after obtaining the Institutional Research Ethical Clearance from the Institutional Research Ethical Committee of Navodaya Medical College, Raichur. The subjects were included in the study after obtaining Informed consent from them. Sensory evaluation of taste of solid dispersions of drug was carried out by six healthy adult volunteers. Solid dispersions of Hydroxyzine hydrochloride prepared by using β Cyclodextrine in different ratio were tested for taste masking. The volunteers rinsed their mouth cavities sufficiently before and after tasting with distilled water. The prepared solid dispersion was kept in the volunteer’s mouth for 30 s and then spit out. Mouth was thoroughly rinsed before the next test. The taste score was set to the range of 0-4 based on the degree of taste masking (0-Pleasant, 1-Tasteless, 2-Slightly bitter, 3-Moderately bitter, 4- Extremely bitter.) Then based on scores, the best taste masked solid dispersion was selected as optimized. Pure drug Hydroxyzine hydrochloride was used as control.
Scanning electron microscopy (SEM):
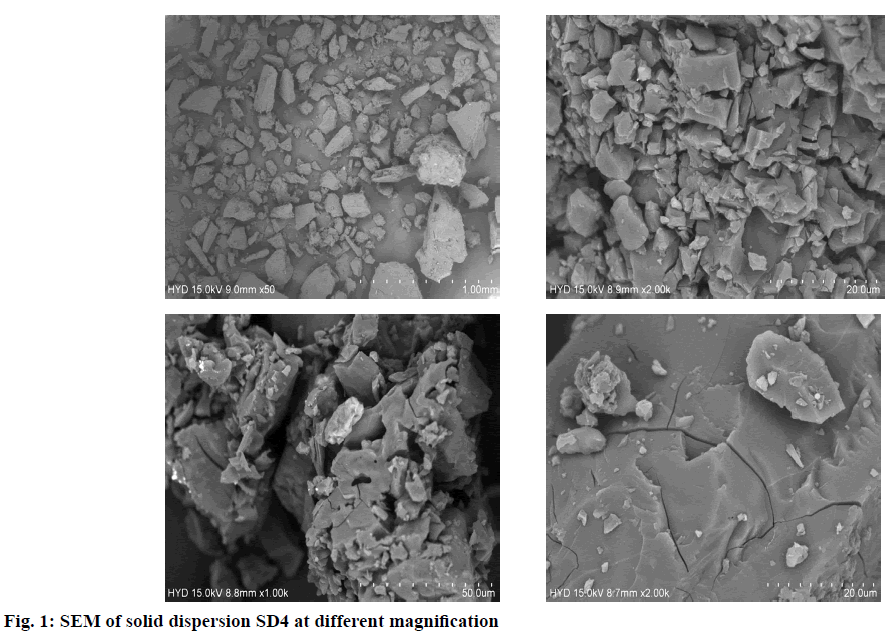
The morphology of Optimized solid dispersion was examined using SEM. Dried samples were attached to specimen stubs using double-sided copper tape and sputter coated with gold palladium in the presence of argon gas using a Hummer I sputter coater (Anatech Ltd., Denver, NC). The samples were imaged with scanning electron microscope (JEOL USA Inc.,Peabody, MA) using a 5kv accelerating voltage.
Application of 23 factorial designs to develop Hydroxyzine hydrochloride FDTs:
A factorial design was applied in this experiment where the effects of different conditions or factors, on experimental results are to be elucidated. 23 randomized full factorial designs were applied by using concentration of superdisintegrants SSG, CCS and CP as factors or independent variables. The dependent variables were disintegration time and percentage drug release. For each of these factors, 2-levels were used (low and high level) (Table 2). Nine formulations employing selected combinations as per 23 Factorial designs were formulated.
| 3 factors | 2 levels | |
|---|---|---|
| 1 | +1 | |
| Concentration of SSG (%) | 3.5 | 6.5 |
| Concentration of CCS (%) | 1.62 | 3.87 |
| Concentration of CP (%) | 2.75 | 4.25 |
Table 2: 23 Factorial Design with Upper & Lower Limits of all Three Factors
Preparation of Hydroxyzine hydrochloride FDT’s:
Solid dispersion (SD4) equal to 126 mg containing drug was taken. The Solid dispersion, diluents, super disintegrants and sweeting agents were passed through sieve no.40 and mixed together in a plastic container. Magnesium stearate and aerosol passed through mesh no.80 were mixed and blended with the above mixture followed by compression of the blend. The tablets were prepared by direct compression method using 4 mm flat punches on a 10 station rotary compression machine. The composition of FDT’s (F1-F9) is shown in the Table 3.
| Ingredients (mg) | Formulation Code | ||||||||
|---|---|---|---|---|---|---|---|---|---|
| F1 | F2 | F3 | F4 | F5 | F6 | F7 | F8 | F9 (OPT) | |
| Hydroxyzine hydrochloride SD * | 126 | 126 | 126 | 126 | 126 | 126 | 126 | 126 | 126 |
| Sodium starch glycolate | 13 | 7 | 13 | 13 | 7 | 7 | 7 | 13 | 10 |
| Croscarmellose sodium | 7.5 | 7.5 | 3.25 | 3.25 | 3.25 | 7.5 | 3.25 | 7.5 | 5.49 |
| Crospovidone | 8.5 | 8.5 | 5.5 | 8.5 | 5.5 | 5.5 | 8.5 | 5.5 | 7.0 |
| MCC | 36 | 42 | 43.25 | 40.25 | 49.25 | 45 | 46.25 | 39 | 42.51 |
| Magnesium stearate | 2 | 2 | 2 | 2 | 2 | 2 | 2 | 2 | 2 |
| Aerosol | 1 | 1 | 1 | 1 | 1 | 1 | 1 | 1 | 1 |
| Talc | 2 | 2 | 2 | 2 | 2 | 2 | 2 | 2 | 2 |
| Sucrose | 4 | 4 | 4 | 4 | 4 | 4 | 4 | 4 | 4 |
*126 mg of Hydroxyzine hydrochloride SD contains 25 mg of pure drug Hydroxyzine hydrochloride.
Table 3: Factorial Design Composition of Hydroxyzine Hydrochloride FDT’s
Evaluation of Hydroxyzine hydrochloride FDT’s
Thickness and diameter:
Thickness and diameter of prepared tablets (10 no’s) were tested using Vernier calipers.
Hardness[13]:
The hardness of prepared tablets (5 no’s) was determined by using Monsanto hardness tester and measured in terms of kg/cm2.
Friability:
The test was performed to assess the effect of friction and shocks, which may often cause tablet to chip, cap or break. Roche friabilator was used for testing the friability of prepared fast dissolving tablets. 10 tablets were accurately weighed and placed in the friabilator and operated for 100 revolutions. The tablets were de-dusted and reweighed. Friability (F) was calculated using the following formula. F= (1-W0 / W)×100 (1)
Where, W0 and W are the weight of the tablets before after the test respectively. The test was done in triplicate. The tablets that loose less than 1 % weight were considered to be compliant.
Weight Variation:
The weight variation test was done by (Shimadzu digital balance) weighing 20 tablets individually, calculating the average weight and comparing the individual tablet weights to the average. The percentage difference in the weight variation should be within the permissible limits (7.5 %). The percent deviation was calculated using the following formula[14]. % Deviation=Individual weight- Average weight/Average weight× 100 (2)
Drug Content:
Weighed tablets (5 no’s) were powdered using a glass mortar and pestle. An accurately weighed quantity of powder equivalent to 25 mg of Hydroxyzine hydrochloride was taken into 50 ml volumetric flask, dissolved in phosphate buffer of pH 6.8 and the solution was filtered through whatman filter paper no.41. The filtrate was collected and suitably diluted with phosphate buffer of pH 6.8. The drug content was determined at 231 nm by UV-spectrophotometer (UV-1700 Shimadzu Corporation, Japan) against blank.
Wetting time:
A piece of tissue paper folded twice was placed in a small Petri dish (internal diameter=6.5 cm) containing 5 ml of distilled water. A tablet was placed on the paper, and the time for complete wetting of the tablet was measured.
Water absorption ratio:
A piece of tissue paper folded twice was placed in a small Petri dish (internal diameter=6.5 cm) containing 5 ml of distilled water. A preweighed tablet was placed on the tissue paper. The tablet was allowed to wet and then was weighed again. The test was done in triplicate. The water absorption ratio (R) was determined according to the following equation. R= (Wa – Wb)/ Wa×100 (3). Where, Wb is the weight of the tablets before the test and Wa is the weight of the tablet after water absorption.
Disintegration test:
Six tablets along disc were introduced in each tube of basket of disintegration test apparatus (Lab care instruments). The basket was positioned into a beaker containing 900 ml of distilled water and operated at 37±0.5o. The time of disintegration of tablet was recorded[15,16].
In vitro drug release studies:
The prepared FDT’s were subjected to in vitro dissolution studies using an 8 station USP (Type-II) dissolution apparatus (Electro Lab, TDT-O8L, Mumbai). The dissolution studies were carried out in 900 ml of phosphate buffer pH 6.8 at 37±0.5o. The speed of the paddle was set at 50 rpm. Sampling was done every 2 min interval. For each sample, 5 ml of sample was withdrawn from the dissolution medium and replaced with equal volume of fresh medium. The samples withdrawn after suitable dilution were analyzed in the UV spectrophotometer at 231 nm.
Analysis of Data:
The disintegration time and dissolution rate values were analyzed as per Analysis of variance (ANOVA) of 23 Factorial designs to find out the significance of the individual and combined effects of the three Factors involved on the disintegration time and dissolution rate of Hydroxyzine hydrochloride tablets formulated.
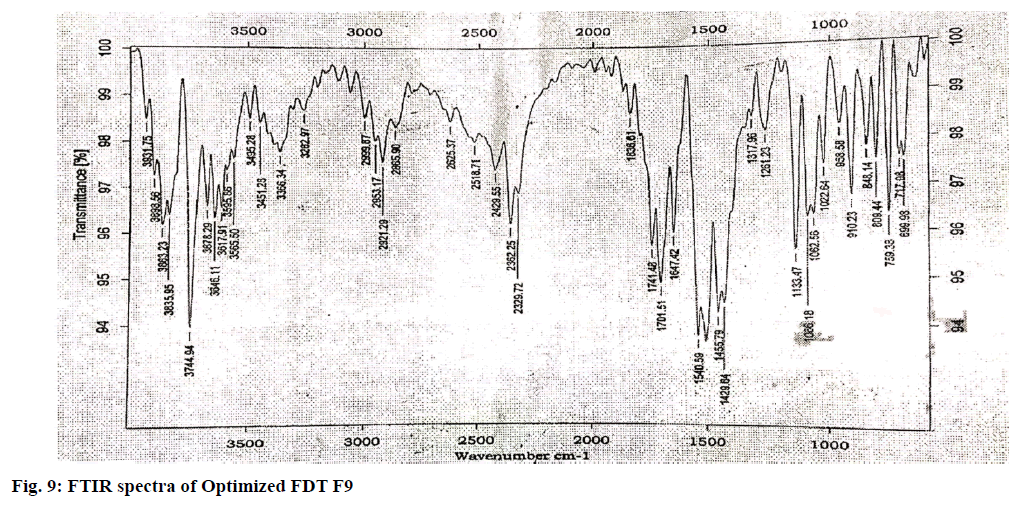
Fourier transform infrared spectroscopy studies (FTIR):
The pure drug, selected SD and optimized formulation were subjected for FTIR analysis. The samples were prepared on KBr-press (Agilent Technologies Hyderabad, INDIA). The samples were scanned over a range of 4000-600 cm-1 using Fourier transformer infrared spectrophotometer (8600, Shimadzu Corporation, Japan). Spectra were analyzed for drug carrier interactions.
In order to analyze the release mechanism, release models were tested such as:
Zero order: Qt =Q0+K0t (4)
Where Qt is the amount of drug released at time t, K0 is the apparent dissolution rate constant or zero order release constant and Q0 is the initial concentration of the drug in the solution resulting from a burst effect; in this case the drug release runs as a constant rate.
First order: 1n Qt = 1n Q0 + K1t (5)
Where K1 is the first order release constant; in this case the drug released at each time is proportional to the residual drug inside the dosage form.
Results and Discussion
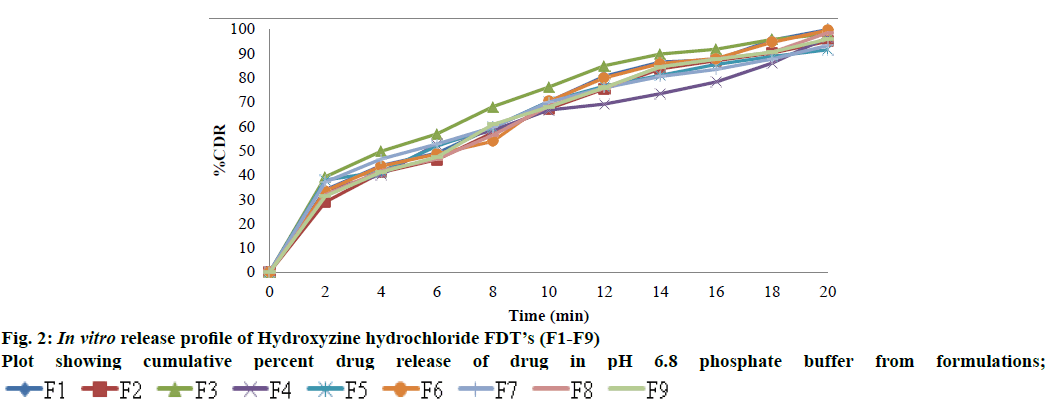
The present investigation was undertaken to mask the bitter taste of drug Hydroxyzine hydrochloride by solid dispersion technique and later formulate FDT’s using 23 factorial design methods. Solid dispersion of Hydroxyzine hydrochloride was prepared by conventional fusion method using drug and β Cyclodextrine in different ratio 1:1, 1:2, 1:3, and 1:4 respectively to mask the bitter taste of drug. Drug content of Solid dispersion was in the range of 11.74 to 24.8 mg which was within acceptable limits. The Solid dispersions were given to panel of six healthy human volunteers for taste masking evaluation using time intensity method. Bitterness was recorded immediately according to the bitterness intensity scale from 0 to 4. The in vivo taste masking evaluation study showed that SD4 had a total score=0, indicating it was pleasant and masked the bitter taste of drug. Table 4 gives the taste masking evaluation results of the solid dispersions. The selected taste masked solid dispersion SD4 was further used to develop fast dissolving tablets of Hydroxyzine hydrochloride. Fig. 1 shows surface features of solid dispersion SD4 at different magnifications. Particles appear as irregular shaped agglomerates with rough surface indicating as amorphous nature. The surface topography shows presence of less crystalline drug, uniformly and finely dispersed or adhered to the carrier surface in solid dispersion. The prepared FDT were evaluated for various parameters. Hardness of tablets was between 3.8-4.2 kg/cm2 for all the formulations. The thickness was found in the range of 4 mm. The diameter of tablets was found to be 7 mm and was uniform for all tablets. Friability was found in between 0.22-0.43 %. The value below 1 % was an indication of good mechanical resistance of the tablet. The weight variation of tablets was within the specified limits. The drug content was found to be 91.7-99.5 % which was within the acceptable limits. The most important parameter that is needed to optimize during the development of fast dissolving tablet is disintegration time. Disintegration time is very important for the FDT which is desired to be less than 4 min for orally disintegrating tablet. Disintegration time was in the range of 3.24±0.68 to 4.22±0.32 min. In case of formulation F5, all the three variables are in low concentration (-1) and the disintegration time was 3.43±0.84 min, and in formulation F1 all three variables at high level (+1) and the disintegration time was 3.24±0.68 min, indicating disintegration time of tablets is decreased by increasing superdisintegrant concentration. This rapid disintegration assists swallowing and also plays a role in drug absorption in buccal cavity. Dissolution of a tablet is dependent on wetting and disintegration time. Measurement of wetting time may be another confirming test for evaluation of FDTs thus promoting bioavailability. Wetting time is related to inner structure of tablet and hydrophobicity of components[19]. Wetting time is used as an indication for the ease of tablet disintegration in buccal cavity. Wetting time of tablets was in the range of 47.52±0.17 to 79.08 ±0.12 s. The disintegration time is shorter with quick wetting properties at the core of the tablets. Water absorption ratio was in the range of 3.60±1.53 to 11.2±1.14 %. The tablet F1 and F6 prepared disintegrated in 3.24 and 3.30 min respectively. The results are shown in Table 5 and 6. The in vitro dissolution of Hydroxyzine hydrochloride tablets was studied in pH 6.8 phosphate buffer using USP XXIV dissolution test apparatus by paddle method. The cumulative percentage release for different formulations is shown in fig. 2. FDT’s F1 and F6 showed maximum drug release 99.80 % and 99.48 % respectively at the end of 20 min. In case of formulation F5, all the three variables are in low concentration (-1) and the drug release is 91.50 %, and in formulation F1 all three variables at high level (+1) and the drug release is 99.80 % indicating release of drug from tablet is influenced by superdisintegrant concentration. Formulations F3, F6 & F7 have any one of three variables at high level and drug release was found to be 98.00 %, 99.48 % and 93.26 % respectively. Formulations F2, F4, & F8 have any two of three variables at high level and the drug release is 94.96 %, 96.91 % and 98.51 %. The main goal of optimization techniques is to follow systemic way for the optimum values of the variables such that the response is maximized. In the present study Hydroxyzine hydrochloride fast dissolving tablet formulations were optimised using 23 Factorial designs. Different amount of three superdisintegrants SSG, CCS and CP were considered as factors. The two levels of all the three factors are given in Table 2. Eight Hydroxyzine hydrochloride fast dissolving tablet formulations employing selected combinations of the three Factors i.e., superdisintegrants as per 23 Factorial design were prepared. The tablets were prepared by direct compression method as per the formula given in Table 3. The disintegration time and dissolution rate values were analysed as per ANOVA of 23 Factorial design to find out the significance of the individual and combined effects of the three Factors involved. Hydroxyzine hydrochloride FDT’s disintegrated rapidly within 5 min. As SSG level was increased the disintegration time decreased, whereas as CCS concentration is increased the disintegration time is increased and as CP concentration increased disintegration time decreased. Full factorial design was used to investigate the effect of 3 factors; the effects of independent variables upon responses were modelle d from polynomial equation for disintegration time and % drug release. The regression equations draw conclusions after considering the magnitude of the coefficient and the mathematical equation carries positive sign in the polynomial equation indicating that the response increases with increase in the value and negative sign represents the decrease in response with increase in the value. The interaction terms showed how the response changes when two factors were simultaneously changed.
| Solid dispersion code | Scores* given by | Total Score | |||||
|---|---|---|---|---|---|---|---|
| First | Second | Third | Fourth | Fifth | Sixth | ||
| Volunteer | |||||||
| SD1 | 3 | 3 | 3 | 3 | 3 | 3 | 18 |
| SD2 | 2 | 2 | 2 | 2 | 2 | 2 | 12 |
| SD3 | 1 | 1 | 1 | 1 | 1 | 1 | 6 |
| SD4 | 0 | 0 | 0 | 0 | 0 | 0 | 0 |
| Pure drug (Control) | 4 | 4 | 4 | 4 | 4 | 4 | 24 |
*Scores: 0-Pleasant, 1-Tasteless, 2-Slightly bitter, 3-Moderately bitter, 4- Extremely bitter
Table 4: Scores of Taste Masking of Hydroxyzine Hydrochloride SD’s
| Formulation Code |
Thickness (mm)** |
Diameter (mm)* |
Hardness Test (kg/cm2)* |
Friability (%)** |
Weight Variation (%)*** |
|---|---|---|---|---|---|
| F1 | 4 | 7 | 04.0±0.1 | 0.23±0.14 | 4.50±0.12 |
| F2 | 4 | 7 | 3.9±0.14 | 0.43±0.32 | 2.93±0.79 |
| F3 | 4 | 7 | 4.1±0.11 | 0.30±0.41 | 3.90±0.51 |
| F4 | 4 | 7 | 4.0±0.23 | 0.22±0.61 | 4.41±0.82 |
| F5 | 4 | 7 | 4.2±0.13 | 0.27±0.66 | 4.06±0.26 |
| F6 | 4 | 7 | 3.8±0.17 | 0.38±0.21 | 5.39±0.77 |
| F7 | 4 | 7 | 4.1±0.14 | 0.23±0.29 | 1.48±0.88 |
| F8 | 4 | 7 | 4.0±0.17 | 0.22±0.81 | 5.57±0.13 |
| F9 (OPT) | 4 | 7 | 3.9±0.15 | 0.31±0.34 | 5.73±0.21 |
*All values are expressed as mean± SD, n=5*/10**/20***
Table 5: Evaluation of Hydroxyzine Hydrochloride FDT’s
| Formulation Code |
Wetting Time (sec)* |
Water Absorption Ratio (%)* |
Drug Content (%)* |
Disintegration time (min)** |
|---|---|---|---|---|
| F1 | 57.14±0.24 | 5.53±1.41 | 98.5±0.36 | 3.24±0.68 |
| F2 | 54.62±0.12 | 8.05±1.70 | 93.6±0.52 | 3.56±0.42 |
| F3 | 74.93±0.18 | 7.59±1.52 | 94.6±0.34 | 4.22±0.32 |
| F4 | 79.08±0.12 | 7.69±1.94 | 95.6±0.12 | 3.54±0.51 |
| F5 | 61.02±0.29 | 3.69±1.32 | 91.7±0.47 | 3.43±0.84 |
| F6 | 59.47±0.26 | 3.60±1.53 | 99.5±0.14 | 3.30±0.38 |
| F7 | 47.52±0.17 | 11.2±1.14 | 94.5±0.36 | 3.41±0.28 |
| F8 | 70.58±0.38 | 5.22±1.21 | 96.5±0.88 | 3.35±0.31 |
| F9 (OPT) | 58.41±0.36 | 5.31±1.37 | 92.6±0.81 | 3.58±0.87 |
*Average of 3*, 6** determinations (±SD).
Table 6: Evaluation of Hydroxyzine Hydrochloride FDT’S
Effect of independent factors on disintegration time (Y1): Y1=128.6667-2.62 X1+14.75 X2-30.875 X3- 6.25 X1X2-2.5 X1X3-90 X2X3- 4.5 X12+3.2917 X22+22.0417 X3 (6)
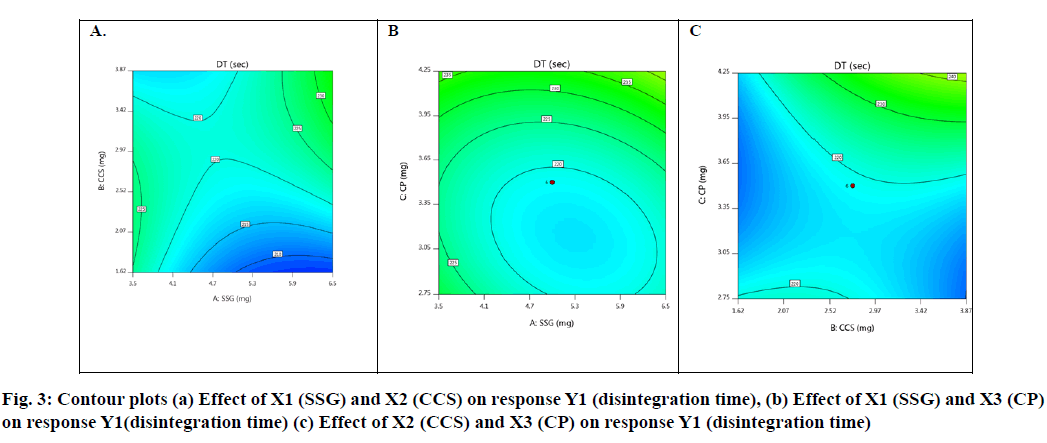
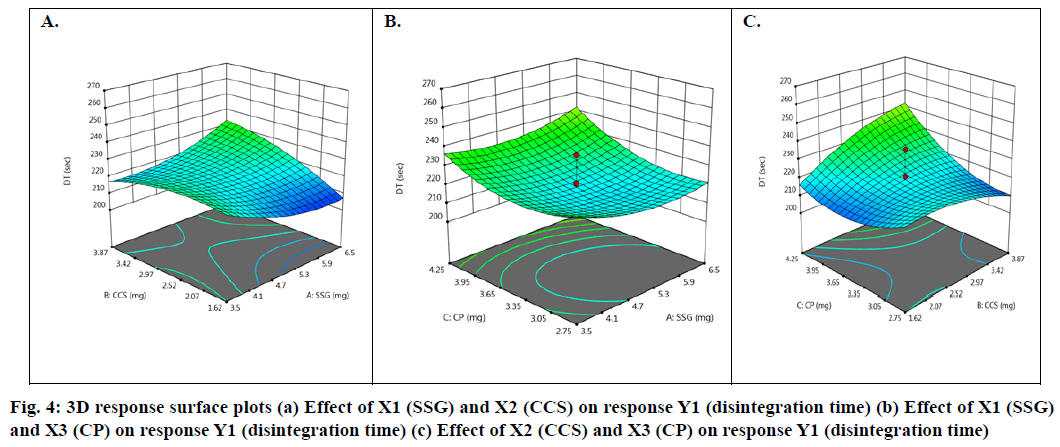
Basing on this polynomial equation we can conclude that factors X1 (SSG) & X3 (CP) decrease disintegration time with increase in concentration and factor X2 (CCS) increases disintegration time with increase in concentration. But it has a synergistic effect with X3 which can be observed with a negative sign of the coefficient (-90 X2X3). The contour plots and 3D surface model of the factors X1, X2 and X3 i.e., independent variables with dependent variable Y1 (disintegration time) is shown in Fig. 3-4. ANOVA was used to identify significant effect, Coefficient of determination R2=0.995. Obtained value of F is larger than critical F-value, the result was found to be significant at that level of probability (p<0.05). The critical value of F is 4.19, obtained F value (i.e. 9.22) is larger than critical value and so it can be concluded that obtained F value is likely to occur by chance with a p<0.05 i.e. indicates significance at that level of probability (Table 7-8). R2 model found to be significant hence this model has been used for predictions. Effect of independent factors on dissolution/percentage drug release (Y2): 2=83.0306+0.375 X1-0.975 X2+4.487 X3+0.825 X1X2+1.95 X1X3+11.6 X2X3+2.6806 X12+0.486X22+0.8306X32 (7)
| Std | Run | Variable factors | Measured Response ( Y1) |
||
|---|---|---|---|---|---|
| Factor 1 (X1) | Factor 2 (X2) | Factor 3 (X3) | |||
| A:SSG | B:CCS | C:CP | Disintegration time | ||
| (mg) | (mg) | (mg) | (sec) | ||
| 3 | 1 | 3.5 | 3.87 | 2.75 | 210 |
| 5 | 2 | 3.5 | 1.62 | 4.25 | 221 |
| 1 | 3 | 3.5 | 1.62 | 2.75 | 223 |
| 7 | 4 | 3.5 | 3.87 | 4.25 | 236 |
| 4 | 5 | 6.5 | 3.87 | 2.75 | 215 |
| 6 | 6 | 6.5 | 1.62 | 4.25 | 234 |
| 2 | 7 | 6.5 | 1.62 | 2.75 | 262 |
| 8 | 8 | 6.5 | 3.87 | 4.25 | 204 |
Table 7: Experimental Runs And Observed Values of Response (Y1 – Disintegration Time)
| Source | Sum of squares | Degree of freedom | Mean Square | F-value | p-value | F Std value |
|---|---|---|---|---|---|---|
| Model | 3587.0 | 3 | 1195.6667 | 9.2233720 | 0.1 | 4.19 |
| Residual | 0.0 | 4 | 0.0 | 0.05 | 6.59 | |
| Cor Total | 3587.0 | 7 | ------ | 0.01 | 16.7 |
p-values less than 0.0500 indicate model terms are significant. Values greater than 0.1000 indicate the model terms are not significant.
Table 8: Analysis of Variance (ANOVA) for Dependent Variable (Y1-Disintegration Time)
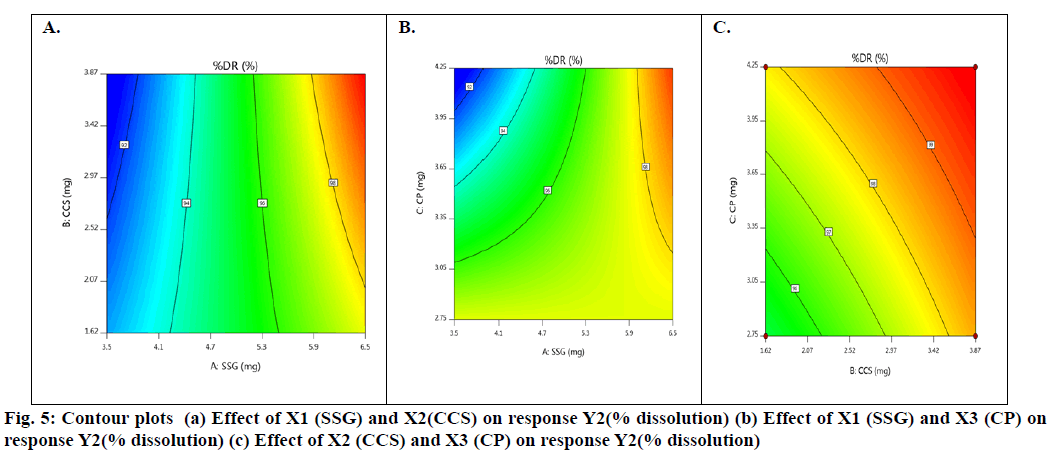
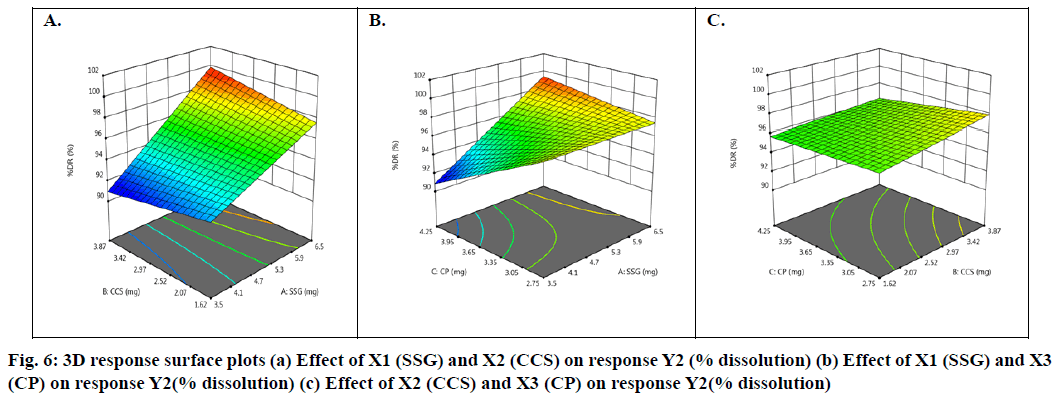
Basing on this polynomial equation we can conclude that factors X1 & X3 with positive sign of the coefficient, increases drug release with increase in concentration and factor X2 with negative sign of the coefficient, decreases drug release with increase in concentration. The contour plots and 3D surface model of the factors X1, X2 and X3 i.e., independent variables with dependent variable Y2 (dissolution) is shown in fig. 5-6. ANOVA was used to identify significant effect, Coefficient of determination R2=0.9023. Obtained value of F is larger than critical F-value, the result was found to be significant at that level of probability (p<0.05). The critical value of F is 4.95, obtained F value (i.e. 9.63) is larger than critical value and so it can be concluded that obtained F value is likely to occur by chance with a p<0.05 i.e. indicates significance at that level of probability (Table 9). R2 model found to be significant hence this model has been used for predictions.
| Source | Sum of squares | Degree of freedom | Mean Square | F-value | p-value | F Std value |
|---|---|---|---|---|---|---|
| Model | 143.8475 | 3 | 47.9492 | 9.6353650 | 0.1 | 4.95 |
| Residual | 0.0 | 4 | 0.0 | 0.05 | 6.59 | |
| Cor Total | 143.8475 | 7 | ------ | 0.01 | 16.7 |
p-values less than 0.0500 indicate model terms are significant. Values greater than 0.1000 indicate the model terms are not significant.
Table 9: Analysis of Variance (ANOVA) for Dependent Variable (Y2- % Dissolution)
From contour plots only, the formulation optimization for required response was predicted graphically. Constraints for optimization as desirability analysis were used and exact amount of SSG, CCS and CP for achieving desired response was found out from optimization; desirability 1.0 indicated optimum formulation was achieved at (10 mg of SSG, 5.49 mg of CCS and 7.0 mg of CP). To verify this tablet were formulated employing the optimized levels of SSG, CCS and CP. The formula of the optimized Taste Masked Hydroxyzine hydrochloride FDT (F9) is given in Table 3. The optimized Hydroxyzine hydrochloride FDT formulation was prepared by direct compression method and the tablets were evaluated. Disintegration time and in vitro drug release were carried out on the prepared optimized formulation to verify the theoretical prediction and were found to be (3.58±0.87 min and 95.89 %) respectively. The relative errors (%) between the predicted and experimental values for each response were calculated and the values found to be within limit. The experimental values were in agreement with the predicted values confirming the predictability and validity of the model.
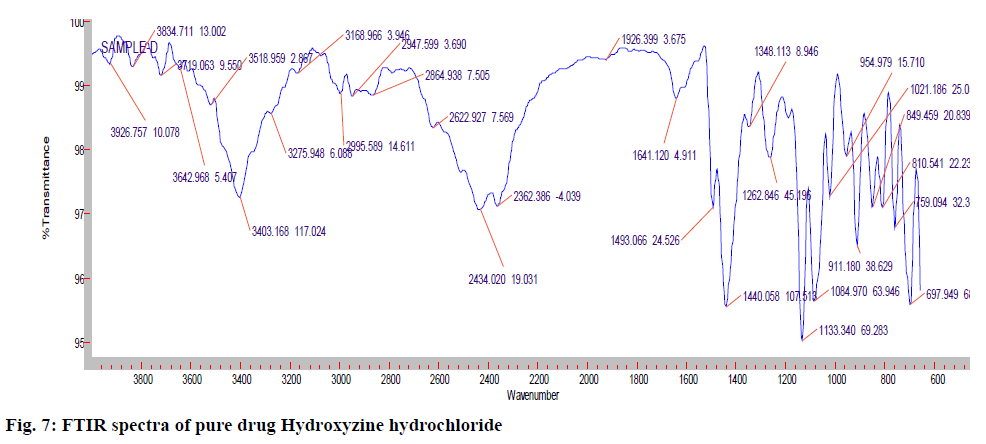
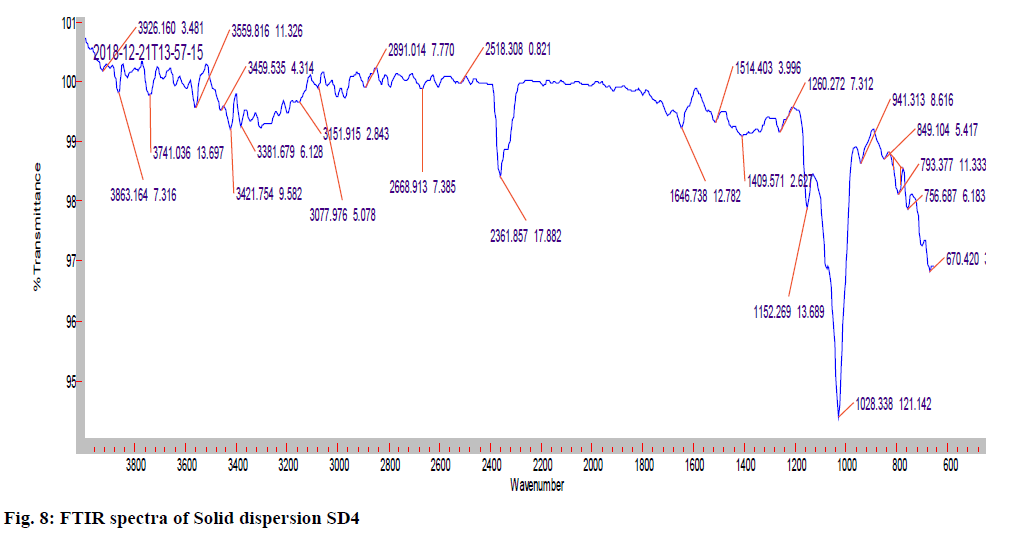
The IR (KBr) cm-1 spectrum of the pure drug Hydroxyzine hydrochloride showed characteristic absorption bands in the IR region. At 3403 cm-1 A Broad peak for –OH groups of pure drug and the carrier was observed. Broad peak indicates –OH is hydrogen bonded. 3060 cm-1 C-H Aromatic stretching. At 2954- 2862 cm-1 the C-H stretching of –CH2 groups of drug and polymers are both symmetric and asymmetric. 1497, 1605, 1642cm-1 Aromatic C=C stretching. 1350-1441 cm-1 C-H Bending of CH2 groups of drug and polymers are both symmetric and asymmetric. 1421 cm-1 C-N stretching. 1261 cm-1 O-H Bending. 1093 cm-1 C-O-C stretching. 700 cm-1 C-CI stretching. The IR spectrum of the pure drug when overlapped with the spectra of the solid dispersion and with Optimised formula (OPT) formulation F9 for the convenience of the characterization showed no significant change in the position of characteristic absorption bands. Even though a negligible shift is observed, it may due to different proportions of carriers/excipients used in present study. IR spectral studies showed there was no appreciable change in position of absorption bands of the major functional groups in solid dispersions and also in OPT formulation F9. The results are shown in fig. 7-9.
To study the release mechanism of fast dissolving tablets, the data obtained from In vitro dissolution studies were fitted in to zero order and first order equation indicated in Table 10. The first order plots were found to be fairly linear as indicated by their high regression values (0.953-0.991) and the value of n gives an indication of the release mechanism.
| Formulation code | Zero order | First order | ||
|---|---|---|---|---|
| n | r2 | n | r2 | |
| F1 | 4.417 | 0.924 | -0.066 | 0.958 |
| F2 | 4.321 | 0.931 | -0.059 | 0.971 |
| F3 | 4.201 | 0.866 | -0.077 | 0.966 |
| F4 | 3.972 | 0.883 | -0.040 | 0.972 |
| F5 | 3.945 | 0.886 | -0.050 | 0.991 |
| F6 | 4.707 | 0.927 | -0.063 | 0.953 |
| F7 | 3.867 | 0.879 | -0.051 | 0.972 |
| F8 | 4.602 | 0.931 | -0.055 | 0.980 |
| F9 | 4.296 | 0.923 | -0.062 | 0.961 |
Table 10: Kinetic Analysis of In Vitro Release Data of Hydroxyzine Hydrochloride FDT’s
The results suggest that bitter taste of hydroxyzine hydrochloride could be masked by solid dispersion technique. 23 factorial design revealed that the amount of superdisintegrants significantly affect the dependent variables, disintegration time, and percentage drug release.
It is thus concluded that by adopting factorial design approach, an optimum formulation can be developed in the shortest time with minimum efforts. Further FDT’s developed have the advantages such as administration without water, anywhere, anytime, lead to their suitability to geriatric and pediatric patients.
Acknowledgement:
Authors are thankful to Mr. Arshad Ahmed Khan. K and Durgesh Kumar Jha for helping us in carrying out this research work. Authors are also thankful to Dr. R. H. Udupi, Dr.Sunil Kumar B, NET Pharmacy College, Raichur for providing help to carry out this research.
Conflict of Interest:
The authors report no conflicts of interest.
References
- Rajendraprasad N, Basavaiah K, Vinay KB. Optimized and validated spectrophotometric methods for the determination of hydroxyzine hydrochloride in pharmaceuticals and urine using iodine and picric acid. J Serb Chem Soc 2011;76(11):1551-60.
- http://pubchem.ncbi.nlm.nih.gov/compound/histamine
- Mohire NC, Yadav AV. Novel approach to formulate β-cyclodextrin complexed mouth dissolving tablet of metronidazole and its in-vitro evaluation. J Pharm Res 2010;3(3):662-7.
- Wagh MA, Kothawade DP, Salunkhe KS, Chavan NV, Daga VR. Techniques used in orally disintegrating drug delivery system. Int J Drug Deliv 2010;2(2):98-107.
- Bhowmik D, Chiranjib B, Krishnakanth P, Chandira RM. Fast dissolving tablet: an overview. J Chem Pharm Res 2009;1(1):163-77.
- Kumari S, Visht S, Sharma PK, Yadav RK. Fast dissolving drug delivery system: Review article. J Pharm Research 2010;3(6):1444-9.
- Hirani JJ, Rathod DA, Vadalia KR. Orally disintegrating tablets: A Review. Trop J Pharm Res 2009;8(2):161-72.
- Singh S, Baghel RS, Yadav L. A review on solid dispersion. IJPLS 2011;2(9):1078- 95.
- Dzul-Cervantes M, Herrera-Franco PJ, Tabi T, Valadez-Gonzalez A. Using factorial design methodology to assess PLA-g-Ma and henequen microfibrillated cellulose content on the mechanical properties of poly (lactic acid) composites. Int J Polym Sci 2017;2017: 1-14.
- Nazia H, Sumera L, Hafsa A, Abbas N, Suriya N, Rabia K, et al. Taste masking of levofloxacin by microparticulate system using emulsion solvent evaporation technique. Indian J Pharm Sci 2019;81(5):843-50.
- Albertini B, Cavallari C, Passerini N, Voinovich D, González-Rodrı́guez ML, Magarotto L, et al. Characterization and taste-masking evaluation of acetaminophen granules: comparison between different preparation methods in a high-shear mixer. Eur J Pharm Sci 2004;21(2-3):295-303.
- Chilate Vikrant C, Godbole Mangesh D, Sonaye Harsha V, Doifode CA. To Mask the Bitter Taste of Rizatriptan Benzoate and Develop Water Dispersible Tablets. Int J Cur Res Rev 2017;9(12):39-48.
- Gupta AK. Introduction to pharmaceutics-I. New Delhi: CBS 1991.
- Banker GS, Anderson NR. Tablets In: Lachman N, Liberman HA, Kanig JL, editors. The theory and practice of industrial pharmacy. 3rd ed. Bombay: Varghese Publication House 1987;286.
- Aly AM, Semreen M, Qato MK. Superdisintegrants for solid dispersion: to produce rapidly disintegrating Tenoxicam tablets via camphor sublimation. Pharm technol 2005;29(1):68-78.
- Jacob S, Shriwaikar AA, Joseph A, Srinivasan KK. Novel co-processed excipients of mannitol and micro crystalline cellulose for preparing fast dissolving tablets of glipizide. Ind J Pharm Sci 2007;69(5): 633-39.
- Reza MS, Quadir MA, Haider SS. Comparitive evaluation of plastics, hydrophilic polymers as matrices for controlled-release drug delivery. J Pharm Pharmaceut sci 2003; 6(2):282-91.
- www.ich.org/LOB/media/MEDIA419.pdf
- Jain CP, Naruka PS. Formulation and evaluation of fast dissolving tablets of valsartan. Int J Pharm Pharm Sci 2009;1(1):219-26.
