- *Corresponding Author:
- Yuexin Zhang
Department of Infectious Disease
The First Affiliated Hospital
Xinjiang Medical University
Urumqi 830054, Xinjiang Uygur Autonomous Region
China
E-mail: gu30636693259282@163.com
| Date of Received | 27 August 2020 |
| Date of Revision | 10 February 2021 |
| Date of Acceptance | 28 March 2021 |
| Indian J Pharm Sci 2021;83(2):327-336 |
This is an open access article distributed under the terms of the Creative Commons Attribution-NonCommercial-ShareAlike 3.0 License, which allows others to remix, tweak, and build upon the work non-commercially, as long as the author is credited and the new creations are licensed under the identical terms
Abstract
Fasting can up regulate the expression of cytochrome P450 2E1 and induce glutathione levels to decrease, protecting the liver from hepatotoxic agents. The aim of this study was to research the mechanism of fasting aggravates isoniazid induced liver injury in mouse. 7 w old male C57 black 6 mice were randomly assigned to two groups: mice fed ad libitum on commercial chow (A group) and mice fasted for 12 h during the day and fed ad libitum on commercial chow (F group). All animals were administered with 100 mg/kg of isoniazid daily by gavage for 6 w (isoniazid levels were selected on basis of screening multiple concentrations). Sera were collected to measure biochemical parameters. Liver sections were stained with hematoxylin and eosin to evaluate hepatic histology. Cytokines was detected by cytometric bead array, flow cytometry. Isoniazid administration (100 mg/kg) daily for 6 w did not significantly induce histological damage in mice of A group. Compared with normal mice, there was no significant difference in serum alanine aminotransferase and aspartate aminotransferase. However, the level of alanine aminotransferase and aspartate aminotransferase levels in F group remained elevated for 6 w, reached its peak on the 3rd d and gradually returned to normal. The liver sections revealed hepatic edema around the central vein on the 3rd d. At 1st or 2nd w, hepatic edema around the central vein with inflammatory cell infiltration and focal necrosis was present. After 4 w, liver histology gradually recovered. Fasting condition influences the cytokine concentration in peripheral blood and liver tissue.
Keywords
Isoniazid, fasting, isoniazid induced liver injury, alanine aminotransferase, aspartate aminotransferase
With the increased use of immunosuppressive agents and increased incidence of human immunodeficiency virus infection, the rate of tuberculosis (TB) infection has also increased. Isoniazid or isonicotinic acid hydrazide (INH), a first line medication used for TB prevention, plays a very important role in the treatment of TB. However, there are concerns regarding the application of INH due to the potential for hepatotoxicity. Approximately 10 %-20 % patients who receive INH have untoward effect of transiently elevated liver enzymes. Most patients can adapt to it and liver enzyme levels return to normal without withdrawal, while 1 %-3 % of patients develop severe liver damage and even liver failure. Although this is well known and intense research has been conducted, the exact development mechanism of INH induced liver injury remains elusive[1-6]. Different experimental animal models have been used to research the hepatotoxicity of INH, including mice, rats and rabbits[7-9]. Unfortunately, no validated animal model was used to recapitulate the human patterns of INH induced liver injury[10-13].
As shown in previous studies, the generation of reactive oxygen species (ROS) results in oxidative stress, lipid peroxidation reaction, inflammatory reaction and apoptosis. Cytochrome P450 2E1 (CYP2E1), mainly expressed in the liver[14], plays a critical role in ROS generation. Due to poor coupling with nicotinamide adenine dinucleotide phosphate (NADPH) cytochrome P450 reductase, CYP2E1 enhanced NADPH oxidase activity and elevated rates of superoxide anion radical (O2-) and hydrogen peroxide (H2O2) production. Furthermore, in the presence of iron catalysts, it produces powerful oxidants, such as hydroxyl radical[15-17]. However, many enzymes or non-enzymatic antioxidants can maintain ROS at the physiological level to prevent ROS induced cell damage in the body, such as superoxide dismutase (SOD), catalase, glutathione peroxidase, glutathione (GSH) and vitamin C. In physiological conditions, ROS formation in cells and the antioxidant defense system are in equilibrium. It has been demonstrated that fasting induces CYP2E1 in the liver[18,19] and deletes hepatic GSH content. Multiple studies have shown that fasting enhances the hepatotoxicity of chemicals, such as carbon tetrachloride (CCl4), chloroform (CHCl3) and acetaminophen[20,21]. Therefore, we investigated whether fasting aggravates INH induced liver injury in mice and validated the molecular mechanism of INH induced liver injury.
Materials and Methods
Grouping of testing animals
7 w old male C57 black 6 (C57BL/6) mice (20±3 g) were purchased from the Animal Laboratory Center of Xinjiang Medical University (Urumqi, China). All animals were individually kept in a specific pathogen free (SPF) environment with a temperature of 23-25º, humidity of 50-60 % and a 12 h light/dark cycle. All animals were fed commercial chow (The Animal Laboratory Center of Xinjiang Medical University, Urumqi, China) ad libitum. After 1 w of adaptation, mice were divided into two groups (n=72, each group). Mice in A group were fed a diet ad libitum, while mice in F group were fasted daily for 12 h and fed ad libitum for 6 w. During the 8 w experimental period, all animals were administered with 100 mg/kg of INH (Article Number: I3377-5G, Sigma) daily by gavage. Tap water was freely available. Next, 8 mice in each group were euthanized on the 3rd d and others were euthanized on the 1st, 2nd, 3rd, 4th, 5th, 6th w separately after the first administration of INH. The body weight of the animals was measured. After overnight fasting, these animals were sacrificed for necropsy and the blood and liver were collected. The livers were weighed and fixed in 10 % neutral buffered formalin solution for light microscopy, fixed in ice cold 3% glutaraldehyde in 0.1 M cacodylate buffer for 30 min and observed through electron microscopy. Blood was centrifuged at 1000 g for 5 min.
All murine experiments were approved by the Ethics Committee of the First Affiliated Hospital of Xinjiang Medical University.
Biochemical examination of liver enzymes
Plasma alanine aminotransferase (ALT) and aspartate aminotransferase (AST) activities were determined using commercial test kits (Batch number: 140115018, 140216011; Mindray) and the concentrations were detected by an automatic biochemical analyzer (Mindray BS-120).
Histopathology and transmission electron microscopy (TEM)
The liver was embedded in paraffin and 5 μm sections were stained with hematoxylin and eosin. All sections were evaluated under a light microscope (LEICA DM 3000). Liver tissues were fixed for 30 min with ice cold 3% glutaraldehyde in 0.1 M cacodylate buffer, embedded in Epon (epoxy resin) and processed through transmission electron microscopy (TEM) using standard procedures. Representative areas were chosen for ultra-thin sectioning and examined using a TEM at 4000-12 000x magnification.
Detection of peripheral blood in mice by flow cytometry
Each flow test tube was added with 100 μl whole blood sample and then added with corresponding flow antibody and then incubated for 20 min by avoiding light. 1 ml red cell lysate was added to each tube (before preheating, resumed to room temperature) and mixed evenly and incubated for 5 min at room temperature. After 1200 rpm centrifuging was done for 5 min at room temperature and then the supernatant was discarded. The cells were washed with 2 ml phosphate buffered saline (PBS) once and centrifuged at 1200 rpm for 5 min. Cells were suspended with 500 μl PBS buffer for immune cell distribution by flow cytometry.
Detection of cytokines by cytometric bead array (CBD) flow cytometry
Tissue samples: The liver tissue precooled by liquid nitrogen was crushed into powder and it was carefully taken to the 1.5 ml Eppendorf (EP) tube. The weight of the EP tube was removed by the balance of weight (EP tube) and the weight of the liver tissue homogenate was obtained by the weight of PBS and the vortex oscillator was filled with a vortex of about 30 s with a vortex oscillator. After mixing, samples were processed overnight at -20º. After repeated 2 times of freezing and thawing, to destroy the cell membrane, the tissue was homogenized at 4º at 5000×g centrifuge 5 min to take the supernatant.
Serum direct detection without dilution
An EP tube and label was prepared for each sample and standard product. 25 μl matrix B was added to each standard tube. 25 μl assay buffer, 25 μl samples, 25 μl beads and 25 μl antibodies were added to all the tubes and then incubated with light avoidance for 30 min. All tubes were centrifuged for 5 min, discarded the supernatant and then mixed with 200 μl wash buffer (1x), centrifuged under 1000×g centrifugal force for 5 min and then discarded the supernatant. The test results were exported (Flow Cytometry Standard (FCS) format) and then the results of the software analysis were used to calculate the concentration of each inflammatory factor in the kit.
Statistical analysis
Data were expressed as mean±standard error (SE). Differences between two groups were analyzed by t test using the SPSS 17.0 software. Data from more than two groups were evaluated by one way analysis of variance (ANOVA), followed by the Newman Keuls test. p value of 0.05 was used as the criterion for significance.
Results and Discussion
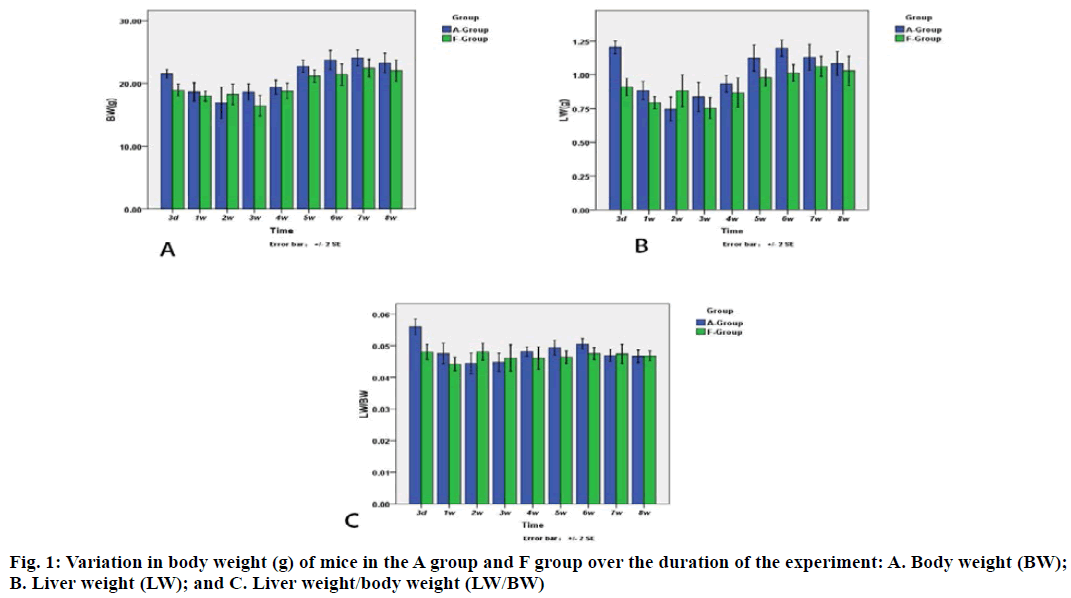
Results suggest that the body weight in the F group gradually decreased at 3rd d and subsequently increased after 3rd w (fig. 1). The body weight in A group began to increase 1 w earlier than that in F group. A similar trend was also observed for liver weight.
At each processing point, there was significant difference in body weight, liver weight and liver weight/body weight between two groups. Furthermore, there was a significant difference in body weight between the A group and F group at 3rd d (21.54 ±0.78 g and 18.94±1.09 g, respectively). At the 3rd d, the liver weight of mice in the A group and F group were 1.24±0.05 g and 0.91±0.07 g, respectively. At 5th d, the liver weight of A group and F group was 1.12±0.11 g and 0.98±0.07 g, respectively, whereas at 6th w, the liver weight was 1.20±0.07 g and 1.01±0.07 g, respectively, for both groups. The liver weight at 3rd d, 5th w and 6th w was significantly different between the two groups, the A group and F group. Furthermore, a significant difference in liver/ body weight on the 3rd d was observed between two groups.
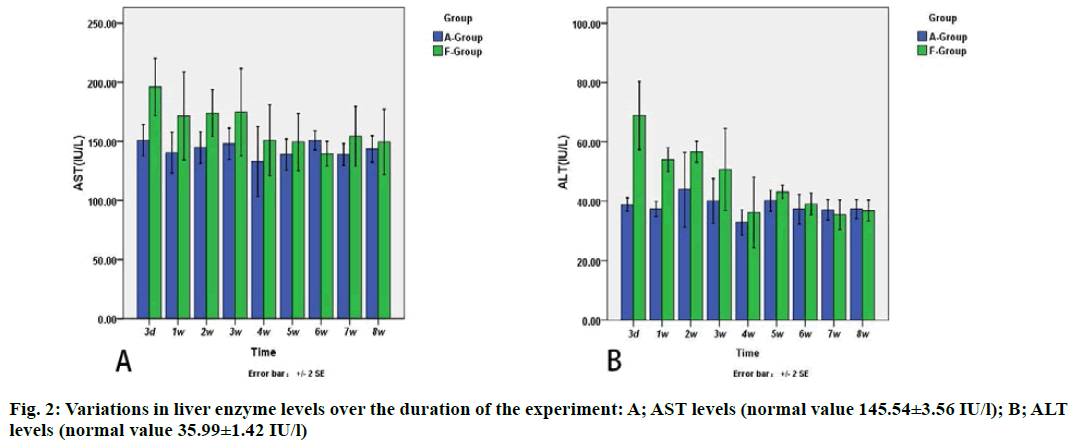
The results showed that there was significant difference in AST and ALT between each processing point in the F group, but no differences were found in A group (fig. 2). The value of ALT in A group and F group was 38.89±2.49 and 68.90±12.78 international units (IU)/l, respectively, on the 3rd d and 37.40±2.85 and 54.00 ±4.56 IU/L, respectively, on the 1st d, respectively (p<0.05).
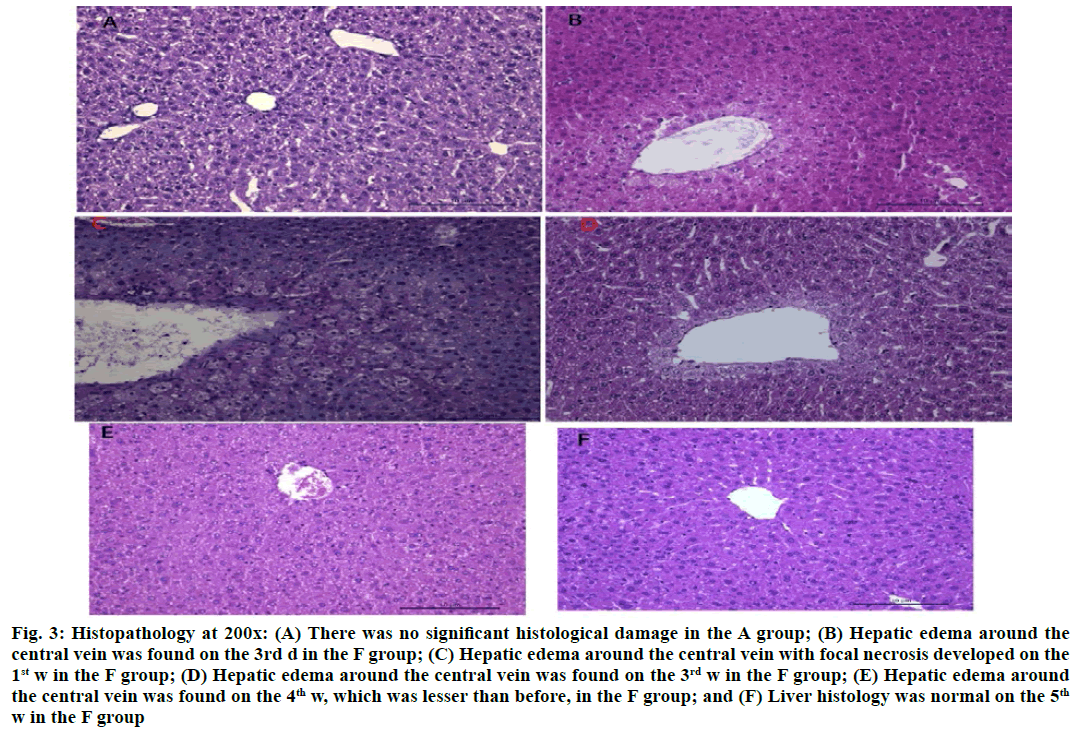
INH administration (100 mg/kg) daily for 6 w could not induce significant histological damage in the A group (fig. 3A). However, liver sections revealed hepatic edema around the central vein on the 3rd d in F group (fig. 3B), which was accompanied by inflammatory cell infiltration and focal necrosis on the 1st or 2nd w (fig. 3C). There were no inflammatory cells and necrosis and the hepatic edema around the central vein gradually decreased on the 3rd or 4th w (fig. 3D and fig. 3E). After 5 or 6 w, the liver histology was recovered (fig. 3F).
Figure 3: Histopathology at 200x: (A) There was no significant histological damage in the A group; (B) Hepatic edema around the central vein was found on the 3rd d in the F group; (C) Hepatic edema around the central vein with focal necrosis developed on the 1st w in the F group; (D) Hepatic edema around the central vein was found on the 3rd w in the F group; (E) Hepatic edema around the central vein was found on the 4th w, which was lesser than before, in the F group; and (F) Liver histology was normal on the 5th w in the F group
Some hepatocytes in A group revealed mild edema which also recovered subsequently. However, hepatocytes in F group were distinctly edematous on the 3rd d. On the 1st w, lymphocytes had a tendency to cross the sinus wall and attacked the hepatocytes. On the 2nd or 3rd w, phagocytotic vesicles were found in liver cells and after the 4th w, hepatic edema was alleviated and the intercellular space was widened. Fat storing cells and collagen increased and the microvilli of the hepatic sinusoidal surface thickened.
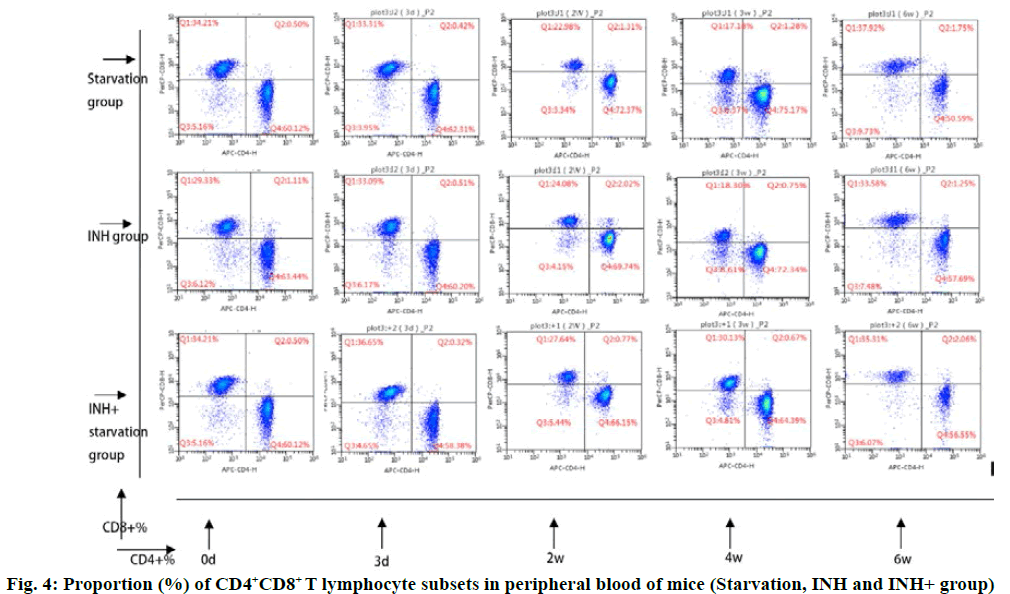
The cluster of differentiation 4 (CD4+) T cells in the INH+ starvation group increased gradually and reached the peak at 3rd w and then gradually decreased. The level of CD4+ T cells decreased to the lowest level at 4th w. The CD3+ and CD4+ % (56.87±2.49 and 54.29±1.42, respectively) at 4 w and 6 w were significantly lower than 3rd w (65.48 ±2.59) and 2nd w (65. 0.43) (p<0.05). At 4 w, INH+ starvation group (56.87±2.49) was significantly lower than that of INH group (65.00±2.11 (p<0.05) (fig. 4).
In INH+ starvation group, CD8+ and CD4+ T lymphocyte level was opposite to the change of treatment time. It decreased gradually to the lowest level in 3rd w (3 w) and then increased progressively. The CD3+ CD8+ % in 6 w (37.15±2.09) was significantly higher than that of 3 d (28.90±2.07) and 2 w (29.03±0.31) (p<0.01). At 4 w, CD3+ CD8+ % (34.09±1.49) in INH+ starvation group was significantly higher than that in starvation group (27.40±2.75) and INH group (26.02±2.17) (p<0.05).
The CD4+/CD8+ ratio of T cells in INH+ starvation group increased initially and then decreased gradually. It was significantly higher on 3 d (1.72±0.12) than that of 4 w (1.72±0.12) (p<0.05) and 6 w (1.55±0.11) (p<0.01), while the starvation group and the INH group showed the opposite tendencies. Performance gradually rose after a slight decrease. At 4 w, the ratio of CD4+/CD8+ % in INH+ starvation group (1.72±0.12) was significantly lower than that in starvation group (2.87±0.55) and INH group (2.68±0.32) (p<0.05).
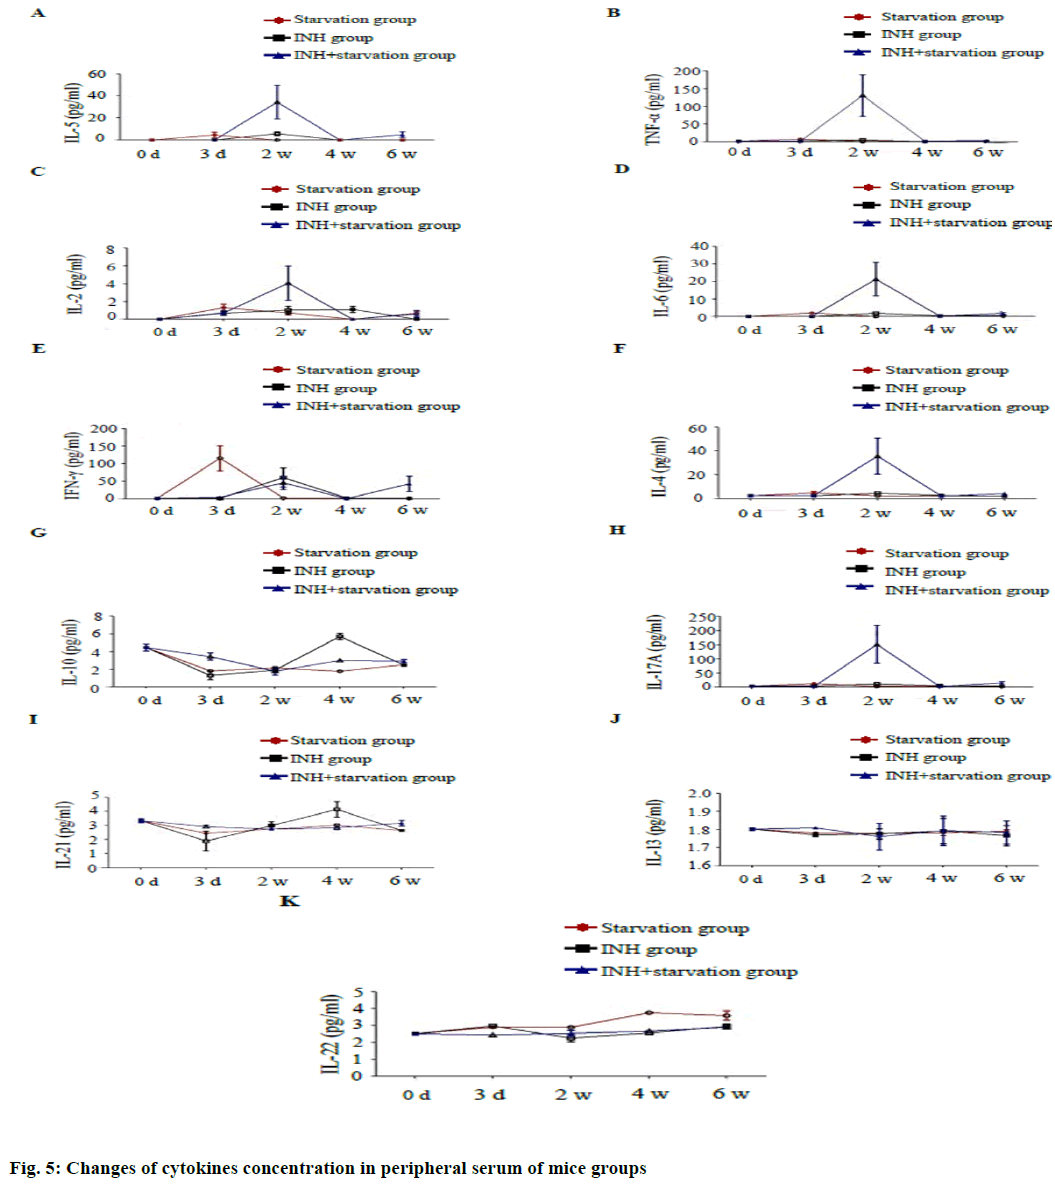
Serum concentrations of cytokines Interleukin (IL) 5, Tumor necrosis factor alpha (TNF-α), IL-2, IL-6, IL-4 and IL-17A were significantly higher in the INH+ starvation group than in the starvation group and the INH group at 2 w with statistical significance (p<0.05) (fig. 5). The serum IFN gamma concentration was significantly higher in the starvation group than in INH group and INH+ starvation group at 3 d.
The difference among the starving group and INH group and the starvation group and INH+ group was statistically significant (p<0.01) and the difference between the starving group and the INH group at 2 w was also significant (p<0.05). The concentration of IL-10 in the INH+ starvation group was considerably higher than the starvation group and the INH group at 3 d (p<0.01). At 4 w, the INH group was significantly higher than the starvation group and the INH+ starvation group. The difference was significantly higher in the INH+ starvation group than in the starvation group (p<0.05).
The concentration of IL-21 in the INH+ starvation group was significantly higher than the INH group at 3 d (p<0.05). At 4 w, the INH group was significantly higher than the starvation group and the INH+ starvation group (p<0.01). While, concentration of IL-22 in the group INH was higher than the INH+ starvation group at 3 d (p< 0.05). At 2 w, the difference between the starvation group and the INH group was significant (p<0.01); and at 4 w, the starvation group was significantly higher than the INH group and the INH+ starvation group (p<0.01). The concentration of IL-13 had no difference among different groups at different time points.
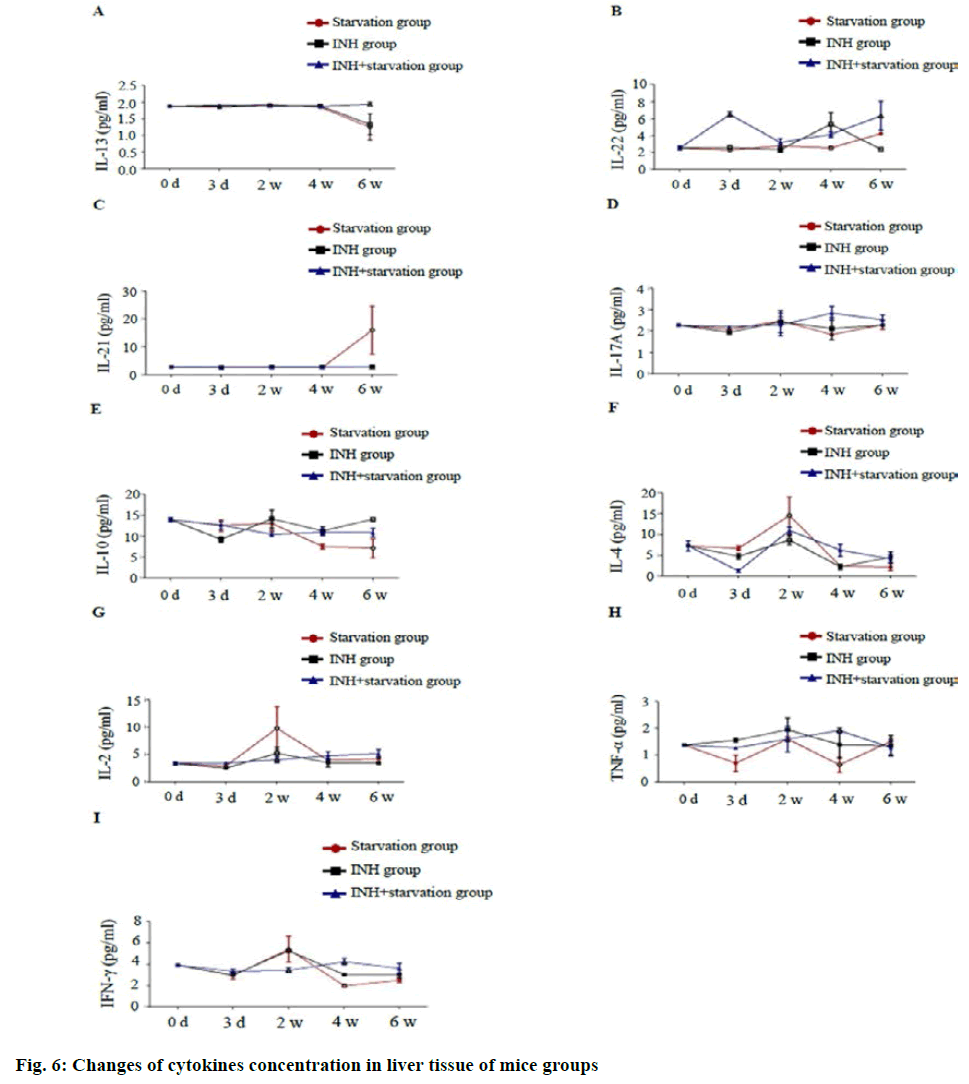
In liver tissue, IL-13 concentration in the INH+ starvation group was significantly higher than that of starvation group and INH group at 6 w (p<0.01). The concentration of IL-22 in the INH+ starvation group was significantly higher than that of starvation group and INH group at 3 d (p<0.01); The difference between the starving and the INH group was significant at 4 w (p<0.01) and at 6 w, the INH+ starvation group was significantly higher than the INH group (p<0.01). The concentration of IL-21 at the starvation group was significantly higher than that of INH group and INH+ starvation group at 6 w (p<0.01).
There was no difference in IL-17A concentration between different groups at different time points. IL-10 concentration was with a significant difference between starvation group and INH group at 6 w (p<0.01). The concentration of IL-4 in the starvation group was higher than that of the INH group at 2 w (p<0.05). The concentration of IL-2 in the starvation group at 2 w was significantly higher than that of INH group and INH+ starvation group (p<0.05). The concentration of TNF-α in the INH+ starvation group at 4 w was higher than that of the starvation group and the INH group and the difference between the starvation group and the INH+ starvation group was statistically significant (p<0.05). The concentration of Interferon gamma (IFN-γ) in the INH+ starvation group at 2 w was significantly lower than the INH group and INH+ starvation group (p<0.01). At 4 w, the INH+ starvation group was significant higher than the starvation group and the INH group, but the difference between the starving groups (p<0.05; fig. 6).
In this study, daily INH administration (100 mg/kg) for 6 w did not significantly induce histological damage in mice of A group. When compared with normal mice, no significant difference was observed in serum ALT and AST. However, the level of ALT and AST levels in F group remained elevated for 6 w and reached its peak on the 3rd d and gradually returned to normal. The liver sections revealed hepatic edema around the central vein on the 3rd d. At the 1st or 2nd w, hepatic edema around the central vein with inflammatory cell infiltration and focal necrosis was observed and after 4 w, liver histology gradually recovered.
The patterns of hepatic injury and the administration of INH were similar to those in clinical study in which late onset of liver injury was observed, which recovered without discontinuation of INH administration. The mice and humans developed good adaptability and tolerance to INH under fasting conditions. The information would be helpful in understanding the underlying mechanism of INH induced hepatotoxicity. Previous studies showed that clinical effects of INH are correlated with plasma levels and the food affects the gastrointestinal absorption of INH and decreases plasma level, especially meals that contain high fat levels[22,23]. In current study, it was demonstrated that fasting increased INH induced liver injury, therefore, determining the administration of INH would not only increase the concentration of plasma, but also reduce the incidence of INH induced liver injury.
T cells are derived from bone marrow lymphoid stem cells, mature in thymus, thus called as thymus dependent lymphocytes. Based on T cell receptors (TCR), T cells are divided into two groups: TCR alpha beta and TCR gamma delta T cells. TCR gamma delta T cells are mainly distributed in the skin and mucous membrane and participated in the inherent immunity[17]. It is the first line of anti-infection cells with a small number of CD4, CD8 T cells, most of which are CD8+ T cells. Phenotype of TCR alpha beta T cells is mainly CD3+ CD4+ CD8- (about 60-65 %) and CD3+ CD4- CD8+ (about 30-35 %). Thus, TCR alpha beta T cells are divided into two categories, CD4+ and CD8+ T cells[12]. CD4+ T cells are restricted by major histocompatibility complex class II (MHC II) molecules and mainly differentiate into auxiliary T cells. CD8+ T cells are restricted by MHC I molecules and are mainly differentiated into cytotoxic T cells (CTL).
CD8+ T cells can directly kill target cells by releasing perforin and granzyme and can mediate the apoptosis of specific target cells through fas and fas ligand (FasL)[19]. Currently, detection of T cell subsets can be used to understand the immune function level of the body in different diseases and to assist the diagnosis of clinical diseases. It is of great significance to explore the pathogenesis of the disease, judge the course and prognosis of the disease and guide the selection of clinical treatment plan. It is reported that in the chimpanzee animal model infected by hepatitis B virus (HBV), the CD4+T lymphocyte response appeared earlier in the peripheral blood[24]. The possible opportunistic infection can be judged according to the number of CD4+ T lymphocyte counts and the timing of antiviral therapy can be selected according to the number of CD4+ T lymphocyte counts.
In this study, the T lymphocyte subsets in the peripheral blood of the mice with INH drug induced liver injury were analyzed. The change trend of CD4+ T and CD8+ T lymphocytes in the INH+ starving group was contrary to that of the starving group and the INH group. The proportion of CD4+ T lymphocyte and CD4+/CD8+ in INH+ starvation group was higher than that in the starvation group and the INH group at the acute injury period (3 d) and the injury stage (2 w) and the stable stage (4 w) was lower than the starvation group and the INH group. The CD8+ T lymphocyte in the INH+ starving group was lower than the starvation group and the INH group in the acute injury period (3 d) and the injury stage (2 w), but in the stationary phase (4 w), it was higher than the famine in the starving group and the INH group. It is suggested that CD4+ T cells respond to INH+ starvation early and initiate immune function. The increase of CD4+ T lymphocytes will promote the release of a large number of inflammatory cytokines. Type 1 T helper (Th1) mainly secretes cytokines such as IL-2, IFN-γ and TNF-α, which mediates the immune response related to cytotoxic and local inflammation, assists antibody production and participates in cellular immunity and delayed hypersensitivity[24]. Studies have shown that TNF-α can induce hepatocyte apoptosis and induce up regulation of inflammatory gene expression by activating hepatic sinusoidal endothelial cells and NF kappa B, induction of hepatocytic injury[21]. Higher the level of TNF-α, the more serious the liver injury and the severity of liver disease is positively correlated[25]. IFN-γ is a cytokine with pro inflammatory effect. It can promote the proliferation, differentiation and maturation of B cells and promote the production of antibodies related to the humoral immunity. Among them, IL-6 has a wide biological activity, which can increase the formation of immune complex and induce the proliferation and differentiation of B cells and produce antibodies[17]. It can activate complement through classical or bypass pathway, cause inflammatory reaction and damage target cells. The synergistic stimulation of IL-2 and IFN-γ induces the differentiation of immature thymus cells into CTL, which enhances the ability of CTL to kill the target cells[26]. Thl7 is a newly discovered Th subgroup that secretes IL-17A, IL-17F and a amount of IL-22, IL-21, TNF and IL-6[27]. IL-17, IL-21 and IL-22 are often considered to be involved in inflammatory response. The mouse model of liver injury induced by intraperitoneal injection of halothane showed the infiltration of immune cells in the liver of mice and the level of IL-17 increased obviously. The level of ALT and AST decreased significantly after the injection of IL-17 antibody, while the TNF of pro inflammatory cytokines decreased significantly[28]. In vitro studies have reported that IL-17 can promote the occurrence and progression of liver fibrosis by activating hepatic stellate cells[29]. The IL-17 plays an important role in the process of autoimmune liver disease, non-alcoholic fatty liver, liver tumor and liver transplantation[30]. IL-21 receptor can be expressed on a variety of immune cells, such as CD4+ T cells, CD8+ T cells, natural killer (NK) cells and dendritic cells, which can activate Janus kinases signal transducer and activator of transcription proteins (JAK-STAT) pathway and downstream transcription factors to induce the proliferation, differentiation and functional expression of in immune cells[31]. Some studies have shown that the up regulated expression of IL-21 has a positive correlation with the clinical severity of hepatitis B and the expression of IL-21 protein in liver tissue is related to liver inflammation and fibrosis classification[32]. Th22 is also a new type of thymocytes which secretes IL-22 and TNF-α, but not IFN-γ, IL-4 or IL-17[33]. Some studies have shown that Th22 cells play an important role in autoimmune diseases and tumor[34], suggesting that Th22 may be involved in the immune and inflammatory response of the body.
In current study, it was found that concentration of peripheral blood cytokines IL-5, TNF- a, IL-2, IL-6, IL-4 and IL-17A in the liver damage model of INH+ hungry mice reached the peak at the time of injury (2 w) and then gradually decreased. The pathological damage of liver tissue was the most serious at 2 w, gradually decreased to baseline level in normal blank, control and INH+ starvation group was significantly higher than starvation and INH group. It is indicated that IL-5, TNF-α, IL-2, IL-6, IL-17A and other pro inflammatory factors play an important role in the inflammation and necrosis of hepatocytes during the drug induced liver injury and the anti-inflammatory factor IL-4 also reached to the peak in the injury period (2 w). It suggests that the mechanism of self-protection of the body is also mobilized in the process of the development of the inflammation, thus causing the liver injury process. In the acute injury period (3 d), the concentration of peripheral blood cytokine IL-21 and IL-10 in INH+ starving mice was significantly higher than that in the starvation group and the INH group, while the serum transaminase level of the INH+ hungry mice reached the peak at the same time.
In conclusion, fasting could enhance biochemical and histopathological changes of INH induced liver injury in mouse and this validated animal model can be used to study INH induced liver injury.
Acknowledgements:
None
Conflict of Interests:
The authors declared no conflict of interest.
References
- Nolan CM, Goldberg SV, Buskin SE. Hepatotoxicity associated with isoniazid preventive therapy: a 7-year survey from a public health tuberculosis clinic. JAMA 1999;281(11):1014-8.
- Boelsterli UA, Lee KK. Mechanisms of isoniazid‐induced idiosyncratic liver injury: Emerging role of mitochondrial stress. J Gastroenterol Hepatol 2014;29(4):678-87.
- Harrington T, Manangan L, Jereb J, Navin T, Powell K. Severe isoniazid-associated liver injuries among persons being treated for latent tuberculosis infection-United States, 2004-2008. MMWR Morb Mortal Wkly Rep 2010;59(8):224-9.
- Black M, Mitchell JR, Zimmerman HJ, Ishak KG, Epler GR. Isoniazid-associated hepatitis in 114 patients. Gastroenterology 1975;69(2):289-302.
- Maddrey WC, Boitnott JK. Isoniazid hepatitis. Ann Intern Med 1973;79(1):1-2.
- Metushi IG, Nakagawa T, Uetrecht J. Direct oxidation and covalent binding of isoniazid to rodent liver and human hepatic microsomes: humans are more like mice than rats. Chem Res Toxicol 2012;25(11):2567-76.
- Chowdhury A, Santra A, Bhattacharjee K, Ghatak S, Saha DR, Dhali GK. Mitochondrial oxidative stress and permeability transition in isoniazid and rifampicin induced liver injury in mice. J Hepatol 2006;45(1):117-26.
- Church RJ, Wu H, Mosedale M, Sumner SJ, Pathmasiri W, Kurtz CL, et al. A systems biology approach utilizing a mouse diversity panel identifies genetic differences influencing isoniazid-induced microvesicular steatosis. Toxicol Sci 2014;140(2):481-92.
- Cheng J, Krausz KW, Li F, Ma X, Gonzalez FJ. CYP2E1-dependent elevation of serum cholesterol, triglycerides and hepatic bile acids by isoniazid. Toxicol Appl Pharmacol 2013;266(2):245-53.
- Yue J, Peng RX, Yang J, Kong R, Liu J. CYP2E1 mediated isoniazid-induced hepatotoxicity in rats. Acta Pharmacol Sin 2004;25(5):699-704.
- Nelson SD, Timbrell JA, Snodgrass WR, Corcoran GB. Isoniazid and iproniazid: activation of metabolites to toxic intermediates in man and rat. Science 1976;193:901-3.
- Sarich TC, Zhou T, Adams SP, Bain AI, Wall RA, Wright JM. A model of isoniazid-induced hepatotoxicity in rabbits. J Pharmacol Toxicol Methods 1995;34(2):109-16.
- Metushi IG, Cai P, Zhu X, Nakagawa T, Uetrecht JP. A fresh look at the mechanism of isoniazid‐induced hepatotoxicity. Clin Pharmacol Ther 2011;89(6):911-4.
- Lieber CS. Cytochrome P-4502E1: its physiological and pathological role. Physiol Rev 1997;77(2):517-44.
- Boveris A, Fraga CG, Varsavsky AI, Koch OR. Increased chemiluminescence and superoxide production in the liver of chronically ethanol-treated rats. Arch Biochem Biophys 1983;227(2):534-41.
- Ekstrom G, Ingelman-Sundberg M. Rat liver microsomal NADPH supported oxidase activity and lipid peroxidation dependent on ethanol-inducible cytochrome P-450 (P-450IIE1). Biochem Pharmacol 1989;38(8):1313-9.
- Rashbastep J, Turro NJ, Cederbaum AI. Increased NADPH-and NADH-dependent production of superoxide and hydroxyl radical by microsomes after chronic ethanol treatment. Arch Biochem Biophys 1993;300(1):401-8.
- Hong J, Pan J, Gonzalez FJ, Gelboin HV, Yang CS. The induction of a specific form of cytochrome P-450 (P-450j) by fasting. Biochem Biophys Res Commun 1987;142(3):1077-83.
- Imaoka S, Terano Y, Funae Y. Changes in the amount of cytochrome P450s in rat hepatic microsomes with starvation. Arch Biochem Biophys 1990;278(1):168-78.
- Qin LQ, Wang Y, Xu JY, Kaneko T, Sato A, Wang PY. One-d dietary restriction changes hepatic metabolism and potentiates the hepatotoxicity of carbon tetrachloride and chloroform in rats. Tohoku J Exp Med 2007;212(4):379-87.
- Antoine DJ, Williams DP, Kipar A, Laverty H, Park BK. Diet restriction inhibits apoptosis and HMGB1 oxidation and promotes inflammatory cell recruitment during acetaminophen hepatotoxicity. Mol Med 2010;16(11):479-90.
- Melander AK, Danielson K, Hanson A, Jansson L, Rerup C, Schersten B, et al. Reduction of isoniazid bioavailability in normal men by concomitant intake of food. Acta Med Scand 1976;200(1):93-7.
- Peloquin CA, Namdar R, Dodge AA, Nix DE. Pharmacokinetics of isoniazid under fasting conditions, with food and with antacids. Int J Tuberc Lung Dis 1999;3(8):703-10.
- Moura AS, Carmo RA, Teixeira AL, Rocha MO. Soluble inflammatory markers as predictors of hepatocellular damage and therapeutic response in chronic hepatitis C. Braz J Infect Dis 2009;13(5):375-82.
- Kakumu S, Okumura A, Ishikawa T, Yano M, Enomoto A, Nishimura H, et al. Serum levels of IL‐10, IL‐15 and soluble tumour necrosis factor‐alpha (TNF‐α) receptors in type C chronic liver disease. Clin Exp Immunol 1997;109(3):458-63.
- Wong CK, Ho CY, Ko FW, Chan CH, Ho AS, Hui DS, et al. Proinflammatory cytokines (IL‐17, IL‐6, IL‐18 and IL‐12) and Th cytokines (IFN‐γ, IL‐4, IL‐10 and IL‐13) in patients with allergic asthma. Clin Exp Immunol 2001;125(2):177-83.
- Zheng Z, Li J, Jiang K. Relationship between Th17 cells and allograft rejection. Front Med China 2009;3(4):491-4.
- Paquissi FC. Immunity and fibrogenesis: the role of Th17/IL-17 axis in HBV and HCV-induced chronic hepatitis and progression to cirrhosis. Front immunol 2017;8:1195.
- Ni M, Gu J, Rao J, Zhang Y, Ding Z, Wang X, et al. Comment on “Exosome‐mediated activation of toll‐like receptor 3 in stellate cells stimulates interleukin‐17 production by γδ T cells in liver fibrosis”. Hepatology 2016;64(6):2271-2.
- Hammerich L, Heymann F, Tacke F. Role of IL-17 and Th17 cells in liver diseases. Clin Dev Immunol 2011:1740-2522.
- Slota C, Shi A, Chen G, Bevans M, Weng NP. Norepinephrine preferentially modulates memory CD8 T cell function inducing inflammatory cytokine production and reducing proliferation in response to activation. Brain Behav Immun 2015;46:168-79.
- Pelletier M, Bouchard A, Girard D. In vivo and in vitro roles of IL-21 in inflammation. J Immunol 2004;173(12):7521-30.
- Sabat R, Wolk K. Research in practice: IL‐22 and IL‐20: significance for epithelial homeostasis and psoriasis pathogenesis. JDDG: J Dtsch Dermatol Ges 2011;9(7):518-23.
- Zhang N, Pan HF, Ye DQ. Th22 in inflammatory and autoimmune disease: prospects for therapeutic intervention. Mol Cell Biochem 2011;353(1):41-6.
