- *Corresponding Author:
- T. Wang
Department of Otolaryngology, Plastic Surgery Hospital, Chinese Academy of Medical Sciences and Peking Union Medical College, Shijingshan District, Beijing 100144, China
E-mail: wangtongent@126.com
| This article was originally published in a special issue,“Clinical Advancements in Life Sciences and Pharmaceutical Research” |
| Indian J Pharm Sci 2024:86(5) Spl Issue “87-96” |
This is an open access article distributed under the terms of the Creative Commons Attribution-NonCommercial-ShareAlike 3.0 License, which allows others to remix, tweak, and build upon the work non-commercially, as long as the author is credited and the new creations are licensed under the identical terms
Abstract
The purpose of this study was to identify the ferroptosis-related long non-coding ribonucleic acid closely associated with the pathogenesis and prognosis of laryngeal squamous cell carcinoma through comprehensive bioinformatics analysis. In this study, 245 ferroptosis-related genes and 1 991 ferroptosis-related long noncoding ribonucleic acid were identified by co-expression network analysis. Then we obtained 67 differentially expressed ferroptosis-genes and 841 differentially expressed ferroptosis-related long non-coding ribonucleic acid. Gene ontology and Kyoto Encyclopedia of Genes and Genomes enrichment analysis of the 67 differentially expressed genes identified significant functions and pathways of LSCC, such as multicellular organismal homeostasis, iron ion binding, ferroptosis and microribonucleic acids in cancer. Multivariable Cox regression prognostic model was constructed for 11 prognostic ferroptosis-related long non-coding ribonucleic acid and 6 of them (LIM homeobox 1-divergent transcript, AL121899.1, LINC01063, LINC02454, LINC02154 and AC023043.3) were finally included in the prognostic model. Then, we performed survival analysis, risk analysis, independent prognostic analysis, co-expression network analysis and clinical correlation analysis to confirm the prognostic value and high correlation of the 6 prognostic ferroptosis-related long non-coding ribonucleic acid with clinical traits. Finally, we plotted the receiver operating characteristic curves and decision curve to verify the accuracy of the prognostic model for laryngeal squamous cell carcinoma. Our results will help clarify the molecular mechanism of laryngeal squamous cell carcinoma and provide new prognostic biomarkers for clinical diagnosis and treatment.
Keywords
Ferroptosis, long non-coding ribonucleic acid, prognostic model, laryngeal squamous cell carcinoma, biomarkers
Laryngeal carcinoma accounts for >95 % of which Laryngeal Squamous Cell Carcinoma (LSCC) is a common malignancy in the head and neck and its incidence rate is 3.5-5.5 per 100 000 people according to the epidemiological studies in North America and Europe[1,2]. LSCC appears to occur more frequently in males aged (40-70) y[3,4]. The etiology of LSCC is not very clear and is currently believed to be related to smoking, drinking, viral infection and environmental factors[5]. Although advances in medical technology have improved treatment options for LSCC, including surgery, radiation and chemotherapy, etc., the overall survival rate for patients at advanced stage remains not optimistic[6,7]. Therefore, it is of great significance to find accurate tumor biomarkers, provide targeted therapy and prognosis prediction of LSCC.
Long non-coding (lnc) Ribonucleic Acid (RNAs) contain >200 nucleotides and seem to be long in length. Studies have revealed that lncRNAs play an essential role in the regulation of epigenetic, cell cycle and differentiation[8]. Ferroptosis is a new type of iron-dependent programmed cell death, which is different from apoptosis, cell necrosis and autophagy[9,10]. Differential expression of lncRNAs and dysregulation in ferroptosis are frequent manifestations of tumor cell activity which are closely related to the development of tumors[11-14].
However, to our knowledge few studies have reported a direct link between them in LSCC. Therefore, the present research explores the biological function and prognostic outcomes of ferroptosis related lncRNAs in LSCC through comprehensive bioinformatics analysis, aiming to find new biomarkers to improve the clinical diagnosis and treatment thereby enhancing the patient prognosis.
Materials and Methods
Data collection:
LSCC transcriptome and its corresponding clinical information were downloaded through The Cancer Genome Atlas (TCGA) database[15] (https://portal. gdc.cancer.gov) via the R package of TCGA biolinks[16]. In total, 123 samples were acquired, including 111 LSCC and 12 normal paracancer tissue. Subsequently, we collated and cleaned all the data using the Practical Extraction and Reporting Language (PERL)[17] for further bioinformatics analysis.
Identification of ferroptosis related lncRNAs by co-expression analysis:
Primarily, full sample transcriptome expression matrix was genotyped using custom PERL scripts and configuration files to identify which genes were (m) messenger RNAs or lncRNAs. Then we extracted the expression levels of ferroptosis-genes from LSCC transcriptome matrix by R package Limma[18], and the list of ferroptosis-genes was obtained from the ferroptosis regulators and markers and Ferroptosisdisease associations Database (FerrDb)[19] (http://www.zhounan.org/ferrdb/). Finally, through coexpression analysis of ferroptosis-genes and ferroptosis-lncRNAs, we identified ferroptosislncRNAs by Pearson Correlation Coefficient (PCC) test. The criteria for filtering were set at a correlation coefficient >0.4 and p<0.001.
Differential expression analysis of ferroptosisgenes and ferroptosis lncRNAs between samples:
The expression matrices of ferroptosis genes and ferroptosis lncRNAs were incorporated into RStudio software. Then we performed differential expression analysis of the two expression matrices respectively between LSCC and normal samples, using the function Wilcox test. Finally, all the results were output in TXT file format; p<0.05 and |log Fold Change (FC)|>1 were considered to be statistically different.
Gene Ontology (GO) and Kyoto Encyclopedia of Genes and Genomes (KEGG) pathway enrichment analysis:
We observed the function and pathway of differential ferroptosis genes enrichment. GO and KEGG enrichment analysis were performed via R packages ClusterProfiler, Bioconductor (org.hs.eg.db), enrichplot and grammar of graphics (gg) plot2[20- 23]; p<0.05 or q<0.05 was regarded to statistically significant.
Univariate Cox analysis of ferroptosis-lncRNAs:
Firstly, we combined the clinical data with the differential ferroptosis-lncRNAs expression matrix. Normal tissue samples were deleted and only samples with complete clinical information were retained. Then, prognostic ferroptosis lncRNAs were identified via univariate Cox analysis[24] using the R package survival[25]. Finally, the prognostic ferroptosis lncRNAs were visualized by forest plot where p<0.01 was the criterion.
LSCC prognostic model construction:
We multiplied the amount of expression of each prognostic ferroptosis lncRNA in each sample by the risk factor, and then added it to get a risk score for each sample via R packages glmnet, survival and survminer[25,26]. All the samples were divided into high- and low-risk groups based on their comparison with the median risk score.
Survival and risk analysis of the prognostic model:
Survival analysis was performed to compare the outcomes of patients with LSCC at high- and lowrisk groups in the prognostic model by the R package survival and survminer[25,26] based on Kaplan Meier (KM) function. Subsequently, prognostic risk analysis was performed to assess risk score, survival status and expressions of prognostic ferroptosis lncRNAs in the high- and low-risk groups.
Independent prognostic analysis:
It was carried out to evaluate whether our prognostic model could predict the prognosis of patients with LSCC independently of existing clinical traits (age, gender, grade and stage). We performed an independent prognostic analysis where these clinical traits were compared with survival time and status, respectively, including univariate and multivariate Cox regression analysis[27]. Files containing clinical information and risk factors were organized and the samples having complete clinical information were only retained.
Testing the accuracy of the prognostic model:
To test the accuracy of the prognostic model, we drew the Receiver Operating Characteristic (ROC) curve[28] and decision curve[29] using R package, survminer, time-dependent ROC and gg Decision Curve Analysis (DCA)[30]. The survival time, status and risk score from the risk file and data of the clinical traits from the risk files were read and combined. Then the ROC curves of 1, 3 and 5 y survival rates and clinical traits were plotted respectively. Next, 5 clinical prognostic models (risk, age, gender, grade and stage) were established by DCA, and the result was visualized by the decision curve.
Construction of co-expression network of prognostic ferroptosis-lncRNAs:
The expression matrix of lncRNAs and ferroptosisgenes and patient risk scores in the prognostic model were transformed into co-expression relationship data of ferroptosis-genes and lncRNAs by PERL script. Then the co-expression network was visualized via Cytoscape software[31].
Clinical correlation analysis between high- and low-risk groups:
Clinical data including age, gender, LSCC grade stage and Tumour, Node and Metastasis (TNM) stage of each patient and the risk files including survival time, status, patient risk score, grouping, and lncRNAs expression matrix were read and combined. All the clinical traits were cycled through Chi-square test (χ2). Statistical differences in clinical traits were identified and the results were presented using a heat map via R packages Limma[18] and pheatmap[32].
Results and Discussion
Primarily ferroptosis-lncRNAs were identified. 56 461 transcriptome gene expression matrix data were downloaded and sorted out from TCGA database. Then, 245 ferroptosis-genes were obtained using R language based on FerrDb database and LSCC gene expression matrix. Finally, 1 991 ferroptosislncRNAs were identified by co-expression network analysis. The cut-off criteria were PCC>0.4 and p<0.001. If PCC>0.4, it was considered as positive regulation, if PCC<-0.4 it was considered as negative regulation. The expression matrix and co-expression data of ferroptosis-lncRNAs were studied.
Further, Differentially Expressed Ferroptosis (DEF) genes and ferroptosis-lncRNAs were identified. We analyzed 245 DEF genes and 1 991 ferroptosislncRNAs among 111 LSCC samples and 12 normal samples, respectively. Then we obtained 67 DEF genes and 841 DEF-lncRNAs.
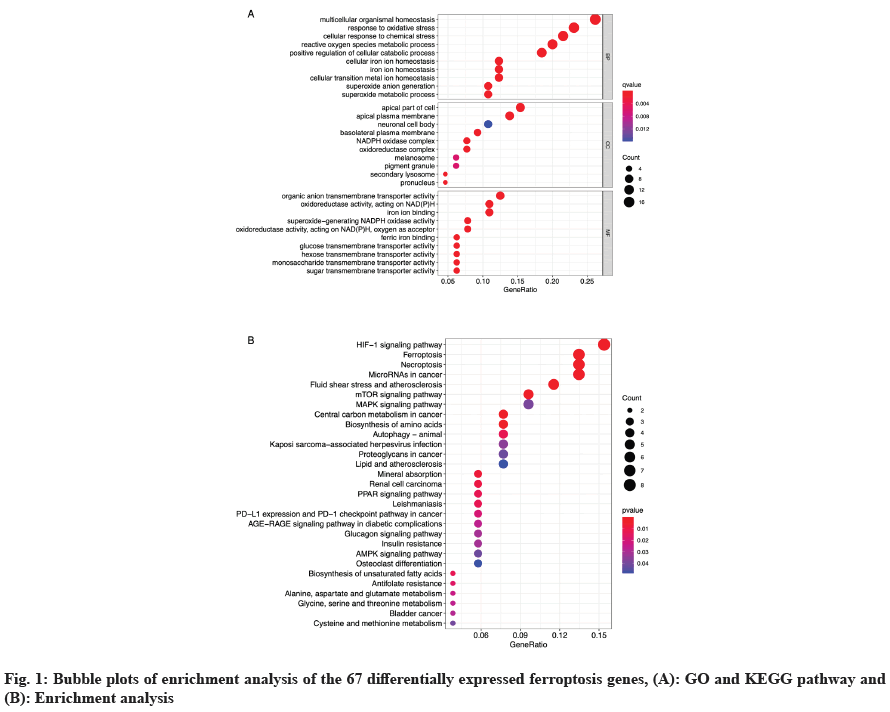
Enrichment analysis of DEF genes was carried out. Through GO functional and KEGG pathway enrichment analysis of 67 DEF genes, we obtained the following results. The enriched GO terms (fig. 1A) under the Biological Process (BP) category were mainly multicellular organismal homeostasis, response to oxidative stress and cellular response to chemical stress. Under the Cellular Component (CC) category, the enriched terms were primarily associated with apical part of cell, apical plasma membrane and neuronal cell body. Under the Molecular Function (MF) category, the enriched terms were mainly correlated with organic anion transmembrane transporter activity, oxidoreductase activity, acting on Nicotinamide Adenine Dinucleotide Phosphate Hydrogen (NADPH) and iron ion binding. KEGG pathway analysis revealed that Hypoxia Inducible Factor-1 (HIF-1) signaling pathway (fig. 1B), ferrosptosis, necroptosis and microRNAs in cancer, and fluid shear stress and atherosclerosis were significantly enriched.
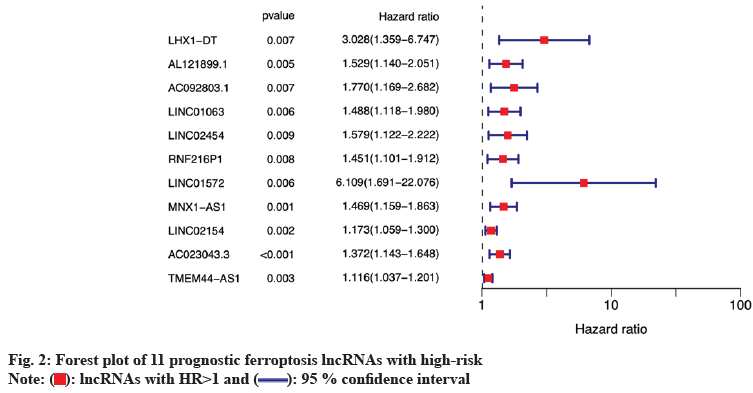
Subsequently, prognostic ferroptosis lncRNAs were identified. 11 prognostic ferroptosis lncRNAs were identified by univariate Cox analysis. The result was presented in a forest plot (fig. 2), showed that all lncRNAs with Hazard Ratio (HR)>1 were defined as High-Risk Prognostic Ferroptosis (HRPF)-lncRNAs, indicating that higher HRPF-lncRNAs expressions might worsen the prognosis for the LSCC patients; p<0.01 was considered to be statistically significant difference.
The prognostic model for HRPF-lncRNAs was constructed using a multivariable Cox regression predictive model for the 11 HRPF-lncRNAs. 6 among them LIM Homeobox 1-Divergent Transcript (LHX1-DT), AL121899.1, LINC01063, LINC02454, LINC02154 and AC023043.3 were finally included in the prognostic model. Risk score formula of the LSCC prognostic model and risk grouping (high- or low-risk group) of all LSCC patients was studied.
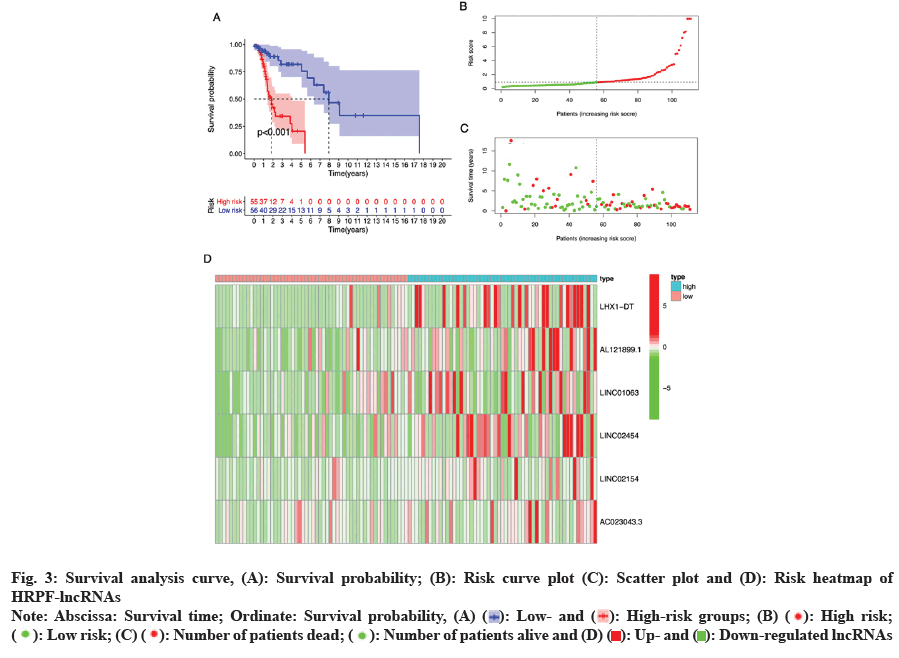
Survival and risk analysis between the risk groupings was carried out. The survival analysis curve was obtained by comparing the difference in the survival prognosis between high- and low-risk groups; fig. 3A, presents the survival probability of the high-risk group which was significantly lower than that of the low-risk group. This suggests that our prognostic model can accurately predict the difference between high- and low-risk patients based on HRPF-lncRNAs expressions. By analyzing the prognostic risk of LSCC patients in the high- and low-risk groups, we obtained a series of risk graphs. As shown in fig. 3B, the risk score of high-risk group was significantly higher than that of the low-risk group. Similarly, as shown in fig. 3C, the risk score increased, the survival time of patients decreased and the number of patients who died increased; fig. 3D, illustrated the DEG prognostic ferroptosis lncRNAs between high- and low-risk groups, from which it could be seen that all the 6 prognostic ferroptosis lncRNAs were HRPF-lncRNAs.
Fig. 3: Survival analysis curve, (A): Survival probability; (B): Risk curve plot (C): Scatter plot and (D): Risk heatmap of
HRPF-lncRNAs
Note: Abscissa: Survival time; Ordinate: Survival probability, (A) ( ): Low- and (
 ): High-risk groups; (B) (
 ): High risk;
(
 ): Low risk; (C) (
 ): Number of patients dead; (
 ): Number of patients alive and (D) (
 ): Up- and (
 ): Down-regulated lncRNAs
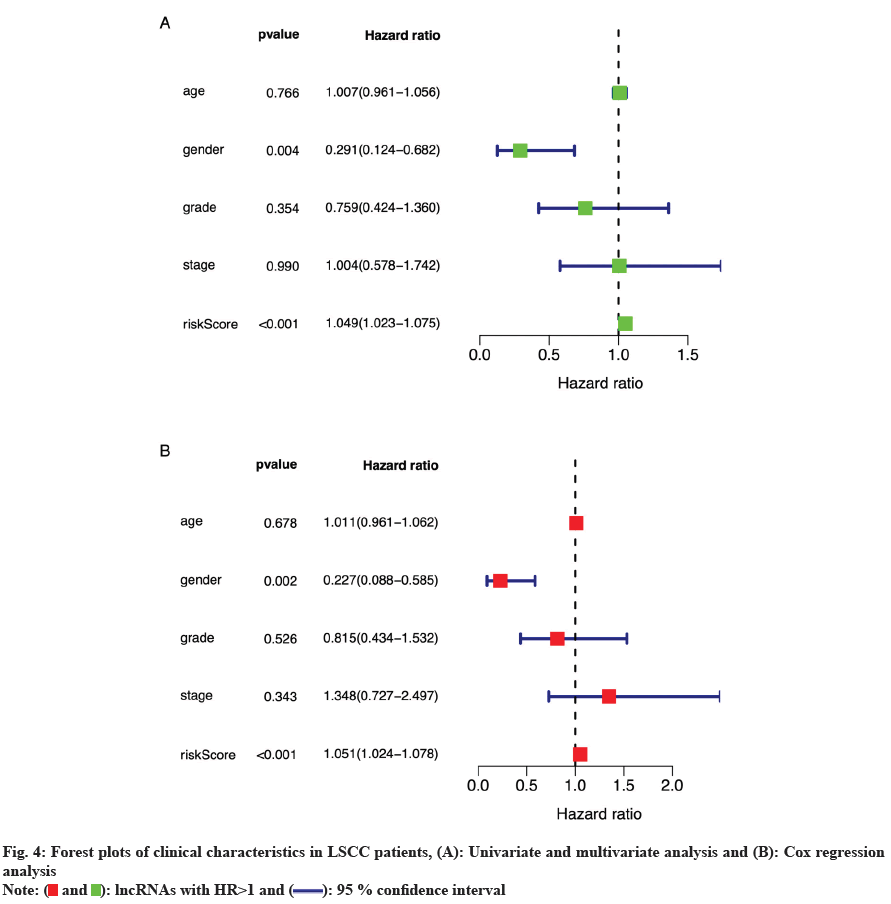
Visualization of independent prognostic factors in the prognostic model was then carried out. Through independent prognostic analysis, we drew forest plots of univariate and multivariate Cox regression analyses using R software. As shown in fig. 4A and fig. 4B, p<0.001 and HR>1 in both univariate and multivariate analyses of the risk score suggested that the risk score in the prognostic model might serve as a reliable clinically independent prognostic factor.
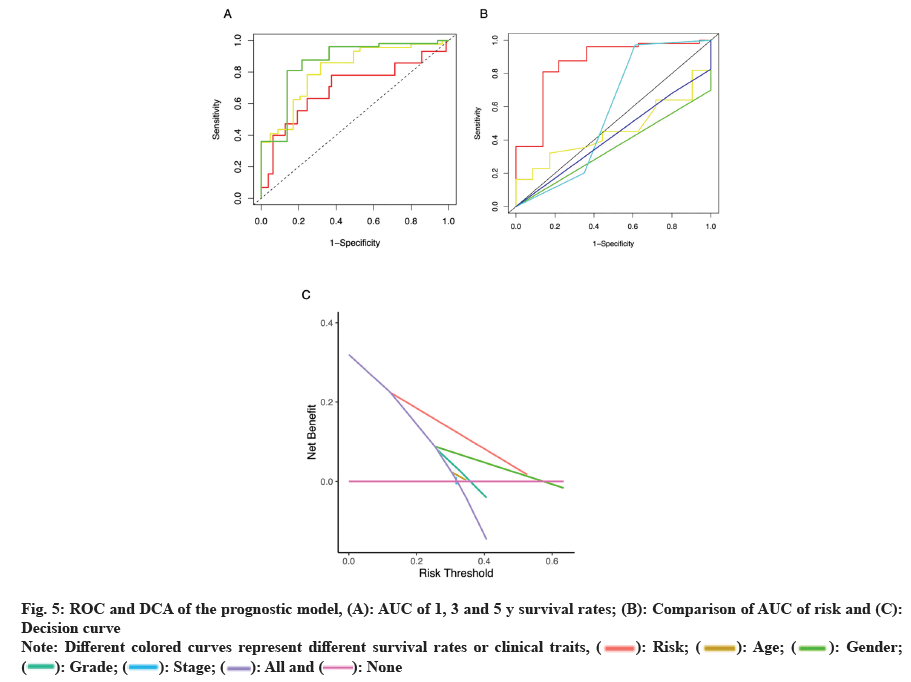
We also plotted ROC and decision curve to verify the accuracy of the prognostic model for LSCC patients with prognosis; fig. 5A, showed that the Area Under the Curve (AUC) of 1 y, 3 y and 5 y survival rates were 0.70, 0.81 and 0.86, respectively, indicating that our prognostic model had a relatively high accuracy in predicting patient survival rates. Similarly, fig. 5B, compared the AUC of risk, an independent prognostic factor in the prognostic model, with that of other clinical traits and found that the AUC (0.86) was significantly larger, which also indicated that our prognostic model had higher prognostic prediction accuracy compared with other clinical traits. From the decision curve (fig. 5C), we could see that the distance between the independent prognostic factor risk curve and the curve all was the longest, which illustrated that our prognostic model was better than other clinical traits in predicting the prognosis of LSCC patients.
Fig. 5: ROC and DCA of the prognostic model, (A): AUC of 1, 3 and 5 y survival rates; (B): Comparison of AUC of risk and (C):
Decision curve
Note: Different colored curves represent different survival rates or clinical traits, ( ): Risk; (
 ): Age; (
 ): Gender;
(
 ): Grade; (
 ): Stage; (
 ): All and (
 ): None
We visualized the co-expression network of 6 HRPFlncRNAs and prognostic ferroptosis genes by the software Cytoscape. As shown in fig. 6, red diamond square indicated the HRPF-lncRNAs involved in the construction of the prognosis model while the green ellipse indicated the prognostic ferroptosis genes and solid gray lines between them indicated the coexpression relationships.
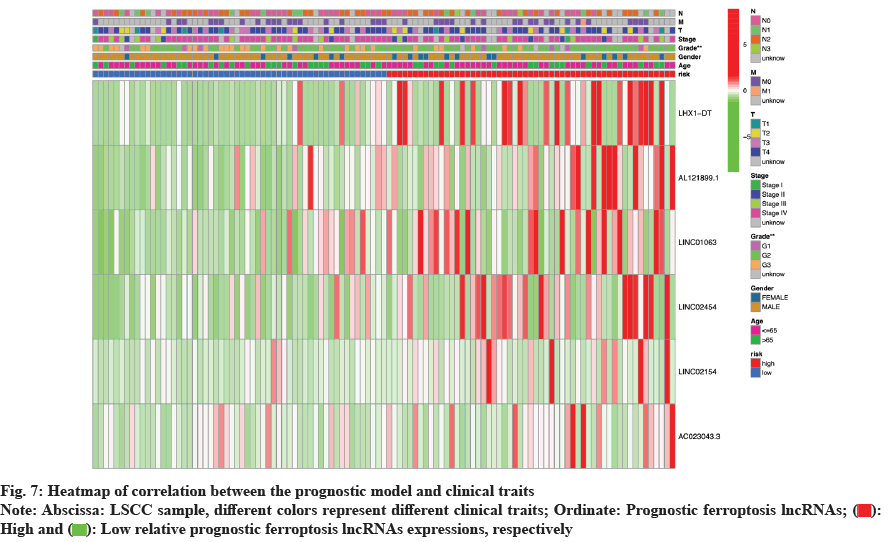
Further, correlation analysis between the prognostic model and clinical traits was also visualized by constructing a heatmap of clinical correlation analysis (fig. 7). It was clear which clinical traits differ significantly between the high- and low-risk groups, and the heatmap showed how prognostic ferroptosis lncRNAs were expressed differently in different groups. As could be seen from the fig. 7, the high-risk group had a higher cancer grade and the expression levels of the 6 prognostic ferroptosis lncRNAs were higher compared with the low-risk group.
Laryngeal carcinoma is a malignancy of the head and neck. LSCC is the most common histological type of laryngeal carcinoma, which is more common in middle-aged and elderly men. Its main symptoms are hoarse voice, dyspnea, dysphagia, cervical lymph node metastasis, etc. At present, comprehensive treatment for LSCC is mainly adopted, including surgical resection, radiotherapy and chemotherapy. However, due to the lack of effective therapeutic targets and accurate prognostic biomarkers, the efficacy and prognosis of LSCC are still poor. In the present study, we identified the ferroptosis genes and ferroptosis-lncRNAs in LSCC, performed MF and pathway enrichment analysis. Then we optimized 6 prognostic ferroptosis lncRNAs (LHX1-DT, AL121899.1, LINC01063, LINC02454, LINC02154 and AC023043.3) by multivariate Cox analysis, constructed a prognosis model for LSCC; we performed survival analysis, risk assessment and independent prognostic analysis. We verified the prediction accuracy of the model. Finally, we analyzed the correlation between prognostic ferroptosis lncRNAs and clinical traits.
At present, there are some reports establishing close relationship between the differential expression of these ferroptosis lncRNAs and the prognosis of tumor patients. Yang et al.[33] demonstrated that the up-regulated expression of LHX1-DT significantly correlated with low survival rate in Breast Cancer (BC) patients and targeting LHX1-DT could inhibit the proliferation of BC cells in vivo by bioinformatics analysis and lncRNA function determination. Maimaiti et al.[34] constructed the prognostic risk model of immune-related lncRNAs and confirmed that AL121899.1 may affect the survival and prognosis of low-grade glioma patients. Their study also mentioned that it could regulate tumor immune response and immune signal transducation. Deng et al.[35] constructed the prognostic characteristics of lncRNAs in hepatocellular carcinoma through Weighted Gene Co-Expression Network Analysis (WGCNA) and prognostic analysis. We verified that the significant prognostic value of LINC01063, could accurately distinguish patients in high- or low risk group. Several recent studies have found that LINC02454 is highly linked with the development and pathogenesis of Papillary Thyroid Carcinoma (PTC) and its high expression is positively related to the dismal prognosis[36-38]. LINC02454 is promised to be a new molecular biomarker in the diagnosis, progression and prognosis of PTC. Zhang et al.[39] developed 4-lncRNA marker to predict the prognosis of Laryngeal Cancer (LC) patients and multivariate Cox analysis showed that LINC02154 is a risk factor for LC, which may affect the progression of LC through the extracellular exosome, Neurogenic locus notch homolog (Notch) signaling pathway, voltage-gated calcium channels and Winglessrelated integration site (Wnt) signaling pathway. In summary, the above research results indicate that our LSCC prognostic model can identify new lncRNAs and can provide strong evidence to support for further experimental studies.
Integrated bioinformatics analysis enabled us to identify ferroptosis-genes and ferroptosis-lncRNAs that are strongly correlated with the development and prognosis of LSCC. Survival, risk, independent prognostic, WGCNA and clinical correlation analysis were conducted by constructing the prognostic model, and the accuracy of the model was verified. The results of our study will help to clarify the molecular mechanism of LSCC and provide new prognostic biomarkers for clinical diagnosis and treatment. However, there are still some limitations in this research, such as without the analysis of different pathological subtypes of LC and specific mechanism of ferroptosis-lncRNAs in LSCC has not been completely understood. In addition, our results need to be further verified in vivo and in vitro.
Conclusively, in this study we identified 6 prognostic ferroptosis lncRNAs (LHX1-DT, AL121899.1, LINC01063, LINC02454, LINC02154 and AC023043.3) in LSCC, constructed a prognostic model, performed survival, prognosis and clinical correlation analysis and verified the accuracy of prognostic model. These lncRNAs may be the future therapeutic targets and prognostic biomarkers in LSCC.
Author’s contributions:
Hanqing Wang and Tong Wang designed the study. Hanqing Wang wrote the manuscript. Yue Li and Zhiming Sun collected raw data. Xinfa Wei, Chong Li and Hongxia Cui performed the statistical and bioinformatic analysis while Tong Wang supervised the study. All the authors read the manuscript and approved the submitted version.
Funding:
This study was supported by National Key R&D Program of China (Grant No. 21025)
Conflict of interests:
The authors declared no conflict of interests.
References
- Sung H, Ferlay J, Siegel RL, Laversanne M, Soerjomataram I, Jemal A, et al. Global cancer statistics 2020: GLOBOCAN estimates of incidence and mortality worldwide for 36 cancers in 185 countries. CA Cancer J Clin 2021;71(3):209-49.
[Crossref] [Google Scholar] [PubMed]
- Marur S, Forastiere A. Head and neck squamous cell carcinoma: Update on epidemiology, diagnosis, and treatment. Mayo Clin Proc 2016;91(3):386-96.
[Crossref] [Google Scholar] [PubMed]
- Shin J, Truong M. Racial disparities in laryngeal cancer treatment and outcome: A population-based analysis of 24 069 patients. Laryngoscope 2015;125(7):1667-74.
[Crossref] [Google Scholar] [PubMed]
- Zhang Q, Xiong Y, Lin L, Yuan K. Analysis of related factors of surgical treatment effect on 215 patients with laryngeal cancer. Exp Ther Med 2018;15(3):2786-91.
[Crossref] [Google Scholar] [PubMed]
- Janssens GO, van Bockel LW, Doornaert PA, Bijl HP, van den Ende P, de Jong MA, et al. Computed tomography-based tumour volume as a predictor of outcome in laryngeal cancer: Results of the phase 3 ARCON trial. Eur J Cancer 2014;50(6):1112-9.
[Crossref] [Google Scholar] [PubMed]
- Zhang SY, Lu ZM, Luo XN, Chen LS, Ge PJ, Song XH, et al. Retrospective analysis of prognostic factors in 205 patients with laryngeal squamous cell carcinoma who underwent surgical treatment. PloS One 2013;8(4):1-9.
[Crossref] [Google Scholar] [PubMed]
- Bozan N, Demir H, Gürsoy T, Özkan H, Düzenli U, Sarıkaya E, et al. Alterations in oxidative stress markers in laryngeal carcinoma patients. J Chin Med Assoc 2018;81(9):811-5.
[Crossref] [Google Scholar] [PubMed]
- Fu PF, Zheng X, Fan X, Lin AF. Role of cytoplasmic lncRNAs in regulating cancer signaling pathways. J Zhejiang Univ Sci B 2019;20(1):1-8.
[Crossref] [Google Scholar] [PubMed]
- Dixon SJ, Lemberg KM, Lamprecht MR, Skouta R, Zaitsev EM, Gleason CE, et al. Ferroptosis: An iron-dependent form of nonapoptotic cell death. Cell 2012;149(5):1060-72.
[Crossref] [Google Scholar] [PubMed]
- Yao X, Zhang Y, Hao J, Duan HQ, Zhao CX, Sun C, et al. Deferoxamine promotes recovery of traumatic spinal cord injury by inhibiting ferroptosis. Neural Regen Res 2019;14(3):532-41.
[Crossref] [Google Scholar] [PubMed]
- Verma N, Vinik Y, Saroha A, Nair NU, Ruppin E, Mills G, et al. Synthetic lethal combination targeting BET uncovered intrinsic susceptibility of TNBC to ferroptosis. Sci Adv 2020;6(34):1-8.
[Crossref] [Google Scholar] [PubMed]
- Yee PP, Wei Y, Kim SY, Lu T, Chih SY, Lawson C, et al. Neutrophil-induced ferroptosis promotes tumor necrosis in glioblastoma progression. Nature Commun 2020;11(1):5424-30.
[Crossref] [Google Scholar] [PubMed]
- Sun Y, Zhou Y, Bai Y, Wang Q, Bao J, Luo Y, et al. A long non-coding RNA HOTTIP expression is associated with disease progression and predicts outcome in small cell lung cancer patients. Mol Cancer 2017;16(1):1-16.
[Crossref] [Google Scholar] [PubMed]
- Lu L, Liu LP, Zhao QQ, Gui R, Zhao QY. Identification of a ferroptosis-related LncRNA signature as a novel prognosis model for lung adenocarcinoma. Front Oncol 2021;11:1-16.
[Crossref] [Google Scholar] [PubMed]
- Lee JS. Exploring cancer genomic data from the cancer genome atlas project. BMB Rep 2016;49(11):607-11.
[Crossref] [Google Scholar] [PubMed]
- Mounir M, Lucchetta M, Silva TC, Olsen C, Bontempi G, Chen X, et al. New functionalities in the TCGAbiolinks package for the study and integration of cancer data from GDC and GTEx. PLoS Comput Biol 2019;15(3):1-10.
[Crossref] [Google Scholar] [PubMed]
- Fourment M, Gillings M. A comparison of common programming languages used in bioinformatics. BMC Bioinformatics 2008;9:1-9.
[Crossref] [Google Scholar] [PubMed]
- Ritchie ME, Phipson B, Wu DI, Hu Y, Law CW, Shi W, et al. Limma powers differential expression analyses for RNA-sequencing and microarray studies. Nucleic Acids Res 2015;43(7):1-13.
[Crossref] [Google Scholar] [PubMed]
- Zhou N, Bao J. FerrDb: A manually curated resource for regulators and markers of ferroptosis and ferroptosis-disease associations. Database 2020;2020(1):1-15.
[Crossref] [Google Scholar] [PubMed]
- Yu G, Wang LG, Han Y, He QY. clusterProfiler: An R package for comparing biological themes among gene clusters. OMICS 2012;16(5):284-7.
[Crossref] [Google Scholar] [PubMed]
- Xu Q, Xu H, Deng R, Wang Z, Li N, Qi Z, et al. Multi-omics analysis reveals prognostic value of tumor mutation burden in hepatocellular carcinoma. Cancer Cell Int 2021;21(1):1-13.
[Crossref] [Google Scholar] [PubMed]
- Van P, Jiang W, Gottardo R, Finak G. ggCyto: Next generation open-source visualization software for cytometry. Bioinformatics 2018;34(22):3951-3.
[Crossref] [Google Scholar] [PubMed]
- Pan Y, Wu L, He S, Wu J, Wang T, Zang H. Identification of hub genes in thyroid carcinoma to predict prognosis by integrated bioinformatics analysis. Bioengineered 2021;12(1):2928-40.
[Crossref] [Google Scholar] [PubMed]
- Liu B, Su Q, Ma J, Chen C, Wang L, Che F, et al. Prognostic value of eight-gene signature in head and neck squamous carcinoma. Front Oncol 2021;11:1-15.
[Crossref] [Google Scholar] [PubMed]
- Zhang Z. Semi-parametric regression model for survival data: Graphical visualization with R. Ann Transl Med 2016;4(23):1-8.
[Crossref] [Google Scholar] [PubMed]
- Sun L, Ke X, Wang D, Yin H, Jin B, Xu H, et al. Prognostic value of the albumin-to-γ-glutamyltransferase ratio for gallbladder cancer patients and establishing a nomogram for overall survival. J Cancer 2021;12(14):4172-82.
[Crossref] [Google Scholar] [PubMed]
- Balder Y, Vignoli A, Tenori L, Luchinat C, Saccenti E. Exploration of blood lipoprotein and lipid fraction profiles in healthy subjects through integrated univariate, multivariate, and network analysis reveals association of lipase activity and cholesterol esterification with sex and age. Metabolites 2021;11(5):1-13.
[Crossref] [Google Scholar] [PubMed]
- Mandrekar JN. Receiver operating characteristic curve in diagnostic test assessment. J Thorac Oncol 2010;5(9):1315-6.
[Crossref] [Google Scholar] [PubMed]
- Vickers A, Holland F. Decision curve analysis to evaluate the clinical benefit of prediction models. Spine J 2021;21(10):1643-8.
[Crossref] [Google Scholar] [PubMed]
- Blanche P, Dartigues J, Jacqmin-Gadda H. Estimating and comparing time-dependent areas under receiver operating characteristic curves for censored event times with competing risks. Stat Med 2013;32(30):5381-97.
[Crossref] [Google Scholar] [PubMed]
- Otasek D, Morris JH, Bouças J, Pico AR, Demchak B. Cytoscape automation: Empowering workflow-based network analysis. Genome Biol 2019;20(1):185.
[Crossref] [Google Scholar] [PubMed]
- Wang L, Wei B, Hu G, Wang L, Jin Y, Sun Z. Gene expression analyses to explore the biomarkers and therapeutic targets for gliomas. Neurol Sci 2015;36 (3):403-9.
[Crossref] [Google Scholar] [PubMed]
- Yang X, Li J, Wang Y, Li P, Zhao Y, Duan W, et al. Individualized prediction of survival by a 10-long non-coding RNA-based prognostic model for patients with breast cancer. Front Oncol 2020;10:1-15.
[Crossref] [Google Scholar] [PubMed]
- Maimaiti A, Jiang L, Wang X, Shi X, Pei Y, Hao Y, et al. Identification and validation of an individualized prognostic signature of lower-grade glioma based on nine immune related long non-coding RNA. Clin Neurol Neurosurg 2021;201:1-10.
[Crossref] [Google Scholar] [PubMed]
- Deng X, Bi Q, Chen S, Chen X, Li S, Zhong Z, et al. Identification of a five-autophagy-related-lncRNA signature as a novel prognostic biomarker for hepatocellular carcinoma. Front Mol Biosci 2020;7:1-16.
[Crossref] [Google Scholar] [PubMed]
- Li Z, Lin W, Zheng J, Hong W, Zou J, Zhang T, et al. Identification of immune-related lncRNAs to improve the prognosis prediction for patients with papillary thyroid cancer. Biosci Rep 2021;41(2):1-11.
[Crossref] [Google Scholar] [PubMed]
- Tan J, Liu L, Zuo Z, Song B, Cai T, Ding D, et al. Overexpression of novel long intergenic non‑coding RNA LINC02454 is associated with a poor prognosis in papillary thyroid cancer. Oncol Rep 2020;44(4):1489-501.
[Crossref] [Google Scholar] [PubMed]
- Cai WY, Chen X, Chen LP, Li Q, Du XJ, Zhou YY. Role of differentially expressed genes and long non-coding RNAs in papillary thyroid carcinoma diagnosis, progression, and prognosis. J Cell Biochem 2018;119 (10):8249-59.
[Crossref] [Google Scholar] [PubMed]
- Zhang G, Fan E, Zhong Q, Feng G, Shuai Y, Wu M, et al. Identification and potential mechanisms of a 4-lncRNA signature that predicts prognosis in patients with laryngeal cancer. Hum Genomics 2019;13(1):1-10.
[Crossref] [Google Scholar] [PubMed]
 ): lncRNAs with HR>1 and (
 ): 95 % confidence interval
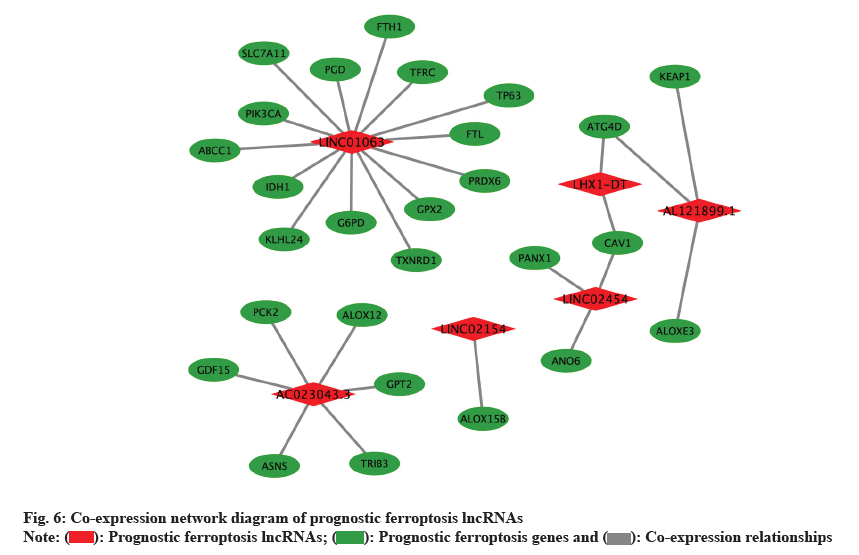
 ): Prognostic ferroptosis lncRNAs; (
 ): Prognostic ferroptosis genes and (
 ): Co-expression relationships