- *Corresponding Author:
- Hongwei Hou
Key Laboratory of Tobacco Biological Effects and Biosynthesis, Beijing 100000, China
E-mail: qsfctc@163.com
| This article was originally published in a special issue, “New Research Outcomes in Drug and Health Sciences” |
| Indian J Pharm Sci 2023:85(6) Spl Issue “74-83” |
This is an open access article distributed under the terms of the Creative Commons Attribution-NonCommercial-ShareAlike 3.0 License, which allows others to remix, tweak, and build upon the work non-commercially, as long as the author is credited and the new creations are licensed under the identical terms
Abstract
Flavor is commonly used as a food additive to impart a distinctive taste. Minor differences in the chemical profile of imitation flavors may severely affect the final food quality. Thus, similarity evaluation of flavor compounds is key to maintaining quality control in the food industry. In this study, a similarity evaluation method was developed, which incorporates non-targeted gas chromatography-Orbitrap for high-resolution mass-based fingerprinting and multivariate statistical analysis, including the Pearson product-moment correlation coefficient, hierarchical cluster analysis, and principal component analysis. Pearson product-moment correlation coefficient of historical batches greater than 0.8 were integrated to the chromatographic fingerprint, while hierarchical cluster analysis and principal component analysis were used to evaluate the similarities between the reference samples and imitation flavors. Eight batches of samples were tested, and the results of all samples were included in the chromatographic fingerprint. Three imitation samples were successfully identified by hierarchical cluster analysis and principal component analysis. The developed method provides a tool for the accurate evaluation of the quality of imitation flavor compounds in food.
Keywords
Gas chromatography-Orbitrap fingerprint, flavor, similarity analysis, simultaneous distillation extraction, multivariate statistical analysis
Flavor additives play an important role in imparting unique aromas to different foods. The identification of suitable imitation flavors is a key step in ensuring the stability of a product’s taste. Sensory evaluation is one such method; however, it has two shortcomings. One drawback is that sensory organs vary in sensitivity from person to person, and the other is the difficulty of identifying abnormal quality fluctuations[1-3]. Owing to these drawbacks, sensory evaluation is highly subjective, and therefore subject to error. To avoid subjective errors, fingerprint recognition[4] was introduced to characterize flavor information. The correlation between sample composition and fingerprints was objectively evaluated using multivariate statistical analysis[5] to allow the identification of imitation samples.
Fingerprints consist of signals obtained by an analytical instrument, which contain information regarding the chemical composition of a test sample. To establish the fingerprint of a sample, a large sample size is needed[6], usually over six or more batches. The samples in these batches are referred to as reference samples. Gas Chromatography (GC) or GC-Mass Spectrometry (GC-MS) fingerprints are frequently used to analyze flavor and fragrances additives[7-9]. Because most additives are volatile, semi-volatile compounds, Álvarez et al. used GC-MS to analyze and identify the compounds that contribute the most to Godello wine flavor[10]. Merckel et al.[11] developed a screening method based on Headspace- Solid Phase Microextraction (HS-SPME)/GC-MS to sensitively detect flavor additives in cigarettes. Wang et al.[12] developed an analytical method was applied for the non-targeted volatile of various chamomile samples to ascertain and address the problems of botanical classification of chamomiles used in commercial products (e.g. beverages) and dietary supplement. Before instrumental analysis, it is crucial to select an appropriate pretreatment method for the sample. For concentrating the sample and interference elimination, approaches like organic solvent extraction[13-15] and Simultaneous Distillation Extraction (SDE)[16-18] are commonly adopted. Solvent dilution, which is used to extract volatile components from flavors, has the advantages of speed, simplicity and convenience. SDE combines distillation and solvent extraction to achieve reflux extraction by fully mixing the vaporized sample with the extraction solvent vapor. During the extraction process, the aroma components are concentrated, and trace volatile components in the sample can be separated to obtain more comprehensive sample information. Many studies[19,20] have shown that SDE provides a better extraction of volatile components than other methods (e.g., solid-phase microextraction), even though SDE results in the loss of some components. Following extraction, a fingerprint is established for the comprehensive characterization of the sample. By analyzing the differences between the fingerprint and sample chromatograms, the subjective error of the sensory evaluation can be avoided, and objective analysis can be achieved. Previous studies[21,22] have predominantly focused on the use of GC-Low-Resolution MS (LRMS) fingerprints to identify differential samples; however, they have limitations that are not sufficiently comprehensive. The GC-Orbitrap MS is a High- Resolution MS (HRMS) instrument, which means it has high resolution, sensitivity and the ability to capture trace components[23-26]. Therefore, the fingerprint established by GC-HRMS can be used to characterize the sample more comprehensively. Finally, multivariate statistical analyses, including Hierarchical Cluster Analysis (HCA) and Principal Component Analysis (PCA), were used to evaluate the degree of matching/similarity between the fingerprint and chromatograms to identify the imitation samples. The former can be used to classify samples and intuitively reflect the relationships among samples according to the degree of similarity, whereas the latter involves the selection of a small number of important variables from multiple variables using linear transformation[27].
Thus, this study highlights a novel application of GC-Orbitrap MS (GC-HRMS) fingerprinting combined with multivariate statistical analysis for the differentiation of imitation flavors. First, a new method consisting of SDE and GC-Orbitrap MS was established to analyze flavor. Second, Pearson product-moment Correlation Coefficients (PCCs) were calculated to evaluate the chromatographic consistency between batches. It is generally believed that a PCCs of at least 0.8[13] can be used to establish fingerprints. Finally, HCA and PCA were used to identify similarities between the chromatographs of the imitation flavors and fingerprints. This objective evaluation approach has potential applications in differential sample identification, among other research areas.
Materials and Methods
Reagents and instruments:
Multiple batches of the same flavor and the relevant imitation flavor (Table 1) were provided by Ajian Fengze Biotechnology (Guangzhou, China). Analytical Reagent (AR) grade sodium chloride (Hushi, Shanghai, China) and anhydrous ethanol (Chemicell, Shanghai, China) was used. Chromatography-grade dichloromethane was obtained from Chemicell and used as an extractant. AR-grade anhydrous sodium sulfate was used (Macklin®, China). The rotary evaporator was obtained from Shanghai Yarong Biochemical Instruments. The Q Exactive™ Orbitrap MS was coupled with a Trace 1300 gas chromatograph and TriPlus™ RSH Autosampler (Thermo Fisher Scientific Inc., United States of America) to obtain sample composition information.
| S. No | Sample number | Sample type |
|---|---|---|
| 1 | B1 | First batch of reference samples |
| 2 | B2 | Second batch of reference samples |
| 3 | B3 | Third batch of reference samples |
| 4 | B4 | Fourth batch of reference samples |
| 5 | B5 | Fifth batch of reference samples |
| 6 | B6 | Sixth batch of reference samples |
| 7 | B7 | Seventh batch of reference samples |
| 8 | B8 | Eighth batch of reference samples |
| 9 | I1 | Imitation flavor 1 |
| 10 | I2 | Imitation flavor 2 |
| 11 | I3 | Imitation flavor 3 |
Table 1: Summary of Tested Flavor Samples
Sample preparation:
SDE: The flavor sample (10 ml) and sodium chloride solution (approximately 1.0 g in 250 ml) were placed in a flask. Next, 30 ml of dichloromethane was used as an extraction solvent, and an SDE tube was used for extraction in a 1000 ml flask. The sample to be extracted was refluxed for 2.0 h at atmospheric pressure. The dichloromethane extracts were collected, and anhydrous sodium sulfate was added to remove the water. The dried sample solution was then transferred to an eggplant-shaped flask and concentrated to 1.0 ml under reduced pressure using a rotary evaporator for GC-Orbitrap analysis.
Solvent dilution: The concentrated flavor sample (200 μl) was pipetted into a 2 ml sample bottle, and then absolute ethanol (800 μl) was added to form a 20 % v/v flavor ethanol solution. The sample solution was shaken evenly and passed through a 0.22 μm syringe filter for GC-Orbitrap injection.
GC-Orbitrap analysis:
HR Accurate Mass (HRAM)-Orbitrap MS was used to perform GC-MS analysis of the volatile constituents in the flavors. The volatile components were then separated by a 30 m×0.25 mm internal diameter (i.d.), film thickness (df)=0.25 μm DB- 5ms chromatographic column. The temperatures of the sample injector and detector were both 280°. The oven temperature was maintained at 50° for 2 min, and increased to 104° at a rate of 6°/min, before holding for 5 min at this temperature. Then, the temperature was programmed to increase to 164° at the same rate and maintained for 4 min. Later, at the same rate, the temperature was increased to 280° and held for 2 min. Split injection was performed at a split ratio of 1:15. Helium was used as the carrier gas at a flow-rate of 1.0 ml/min.
Orbitrap MS was operated in electron ionization mode at 70 eV in scan mode at 55–550 m/z. The filament delay was 5 min and the source temperature and MS transfer line were at 280°. A library search was conducted against the NIST Mass Spectral Library in 2017.
Method validation:
The precision and stability of the method were verified. Sample (1 μl) was precisely taken, and the same six samples were analyzed using this method. The retention time and peak area Relative Standard Deviation (RSD) (%) were calculated to evaluate the instrument precision. The pretreated sample solution was stored at room temperature for 0, 3, 6, 9, 12, 18 and 24 h before GC-Orbitrap analysis. The stability of the sample solution was evaluated based on the retention time and peak area RSD % obtained at different storage times.
Similarity analysis method:
The consistency between the chromatography from different batches of samples was calculated using the Pearson correlation coefficient (r), which is commonly used to determine whether the chromatography of multibatch samples can be used to establish fingerprints. Equation (1) is as follows[28]:
r=Σn i=1 (xi-x? ) (yi-?)/√Σn i=1 (xi-x? )2 √Σn i=1 (yi-?)2 (1)
Where xi and yi represent the peak area data matrices of the two maps and n is the measured value. The closer the calculated r value is to 1, the more similar the two chromatograms are. A PCCs heat map was constructed using ChiPlot (https://www.chiplot. online).
HCA involves performing hierarchical decomposition until certain conditions are reached, and can be divided into two types; agglomerative and divisive. Hierarchical agglomerative clustering was used for the classification analysis. Both HCA and PCA were analyzed using ChiPlot (https://www.chiplot.online), StandarScaler (a standardized method), and Euclidean Distance (ED). First, it is important to standardize the data before performing PCA. The StandardScaler was used for standardization, along with equation (2), where x? represents the mean and SN represents the standard deviation, which is calculated according to the formulas shown in equation (3) and equation (4), respectively. Subsequently, ED was used as a computational method to perform HCA. In equation (5), xi and yi represent the peak area data matrices for both samples.
StandardScaler=(x-x? )/SN (2)
x? =(x1+x2+...+xn)/n (3)
SN=√1/nΣn i=1 (xi-x? )2 (4)
ED=√Σni=1 (xi-yi)2 (5)
Results and Discussion
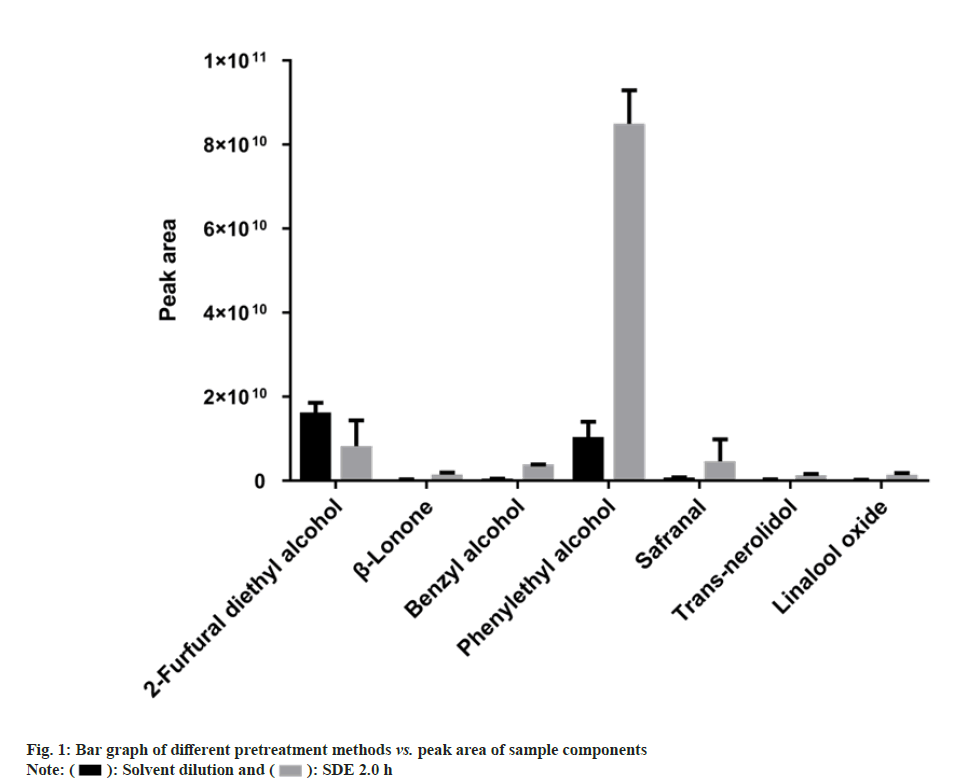
The first step involved in establishing a GCOrbitrap MS based fingerprint is the selection of a suitable pretreatment method. A comparison of the response intensity of each characteristic peak of samples prepared using the solvent dilution method with those prepared using SDE revealed that the peak areas are higher after SDE pretreatment. This result can be inferred from the histogram (fig. 1), which shows that the components shown could be extracted by both pretreatment methods, whereas other compounds that were not shown could only be obtained by SDE, such as some ketone compounds.
Moreover, many believe that the use of SDE leads to the collection of more sample information than the use of head-space solid-phase microextraction and solvent dilution[20,29]. The peak areas of most samples extracted by SDE are larger than those pretreated using solvent dilution, although 2-furfural diethyl alcohol peak area was higher by solvent dilution. Although SDE required longer extraction times than solvent dilution, it led to a larger total peak area and indicated higher concentrations of sample compounds than solvent dilution extraction did. Because of the higher signal response produced using SDE; it was considered a more suitable pretreatment method for flavor samples.
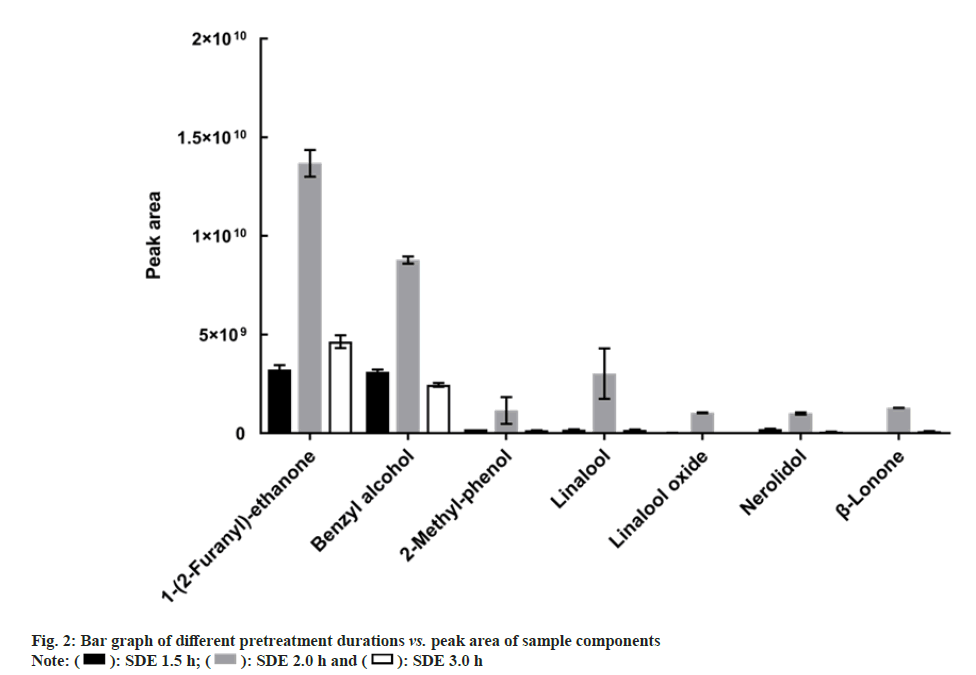
After selecting SDE as a suitable pretreatment method, it is important to continue optimizing the SDE processing time. The SDE duration directly influences the compound composition. The changes in the peak areas and number of peaks of the samples treated for 1.5, 2.0, and 3.0 h were compared. The total peak area of the sample extracted for 2.0 h was significantly higher than those of the samples extracted for 1.5 and 3 h (fig. 2).
We speculate that probably because the reaction does not proceed to completion in 1.5 h, leading to the loss of some components, whereas after 2 h, some compounds decomposition with excessive heat energy, leading to aroma component loss. A comparison of the chromatograms at different treatment times revealed that the number of chromatographic peaks increased significantly when the extraction time was 2.0 h. For example, the peak of ethyl phenylacetate appears at 13.38 min, the peak of damascenone appears at 16.02 min, and the peak of α-ambrinol appears at 21.58 min. This indicates that SDE for 2.0 h allows for the extraction of more volatile compounds from the sample and the extraction effect is better. Therefore, 2.0 h was selected as the optimal treatment duration.
After the appropriate pretreatment method and conditions have been selected, the parameters for the instrumental analysis were optimized to establish a fingerprint. An important aspect of instrumental analysis is the temperature program of the chromatographic column, which influences the number of chromatographic peaks. By comparison, the results of temperature program II show that the new peaks appear at 26.31 min (dodecanoic acid) and 28.25 min (sclareol). Based on high-resolution deconvolution, a mass tolerance of <5 ppm is beneficial for eliminating data interference. Then, an Signal-to-Noise (S/N) ratio threshold >3 and a Total Ion Chromatogram (TIC) threshold of 1×10⁷ were used to detect the peaks. Through a spectral library search and filtering of irrelevant data (missing values), 260 compounds were identified by temperature program I and 541 compounds were identified by temperature program II. Generally, the total retention time of a temperature program should not be too long or short. The total retention times for temperature programs I and II were 42 and 51 min, respectively. The results showed that temperature program II had a better separation effect and yielded more components. Consequently, more information on the sample could be obtained if temperature program II was used as the optimal column temperature program.
After an optimized analytical method is established, method validation becomes the critical step. To verify the feasibility of the method, its precision and stability were evaluated by measuring the RSD values. Under the same SDE-GC-Orbitrap conditions, the precision was analyzed using the retention time and peak area RSD obtained by injecting six identical sample solutions. The results showed that the RSD of both within the range of 0.00 %–0.03 % and 1.92 %–5.54 %, respectively, and had high instrument precision for the analysis of volatile components in flavor samples[30].
The precision of the instrument was verified, and it was also important to ensure the stability of the testing period of the sample solution obtained using this method. Under the same experimental conditions, the sample solution was injected at 0, 3, 6, 9, 12, 18, and 24 h after treatment, and the retention time and peak area RSD were recorded. The RSD of both the retention time and peak area were in the range of 0.00 %–0.07 % and 1.84 %–5.16 % respectively, so the sample solution obtained by this method remained stable for the maximum tested/stored period of 24 h. This suggests that establishing a GC-Orbitrap fingerprint to analyze flavor similarities is feasible.
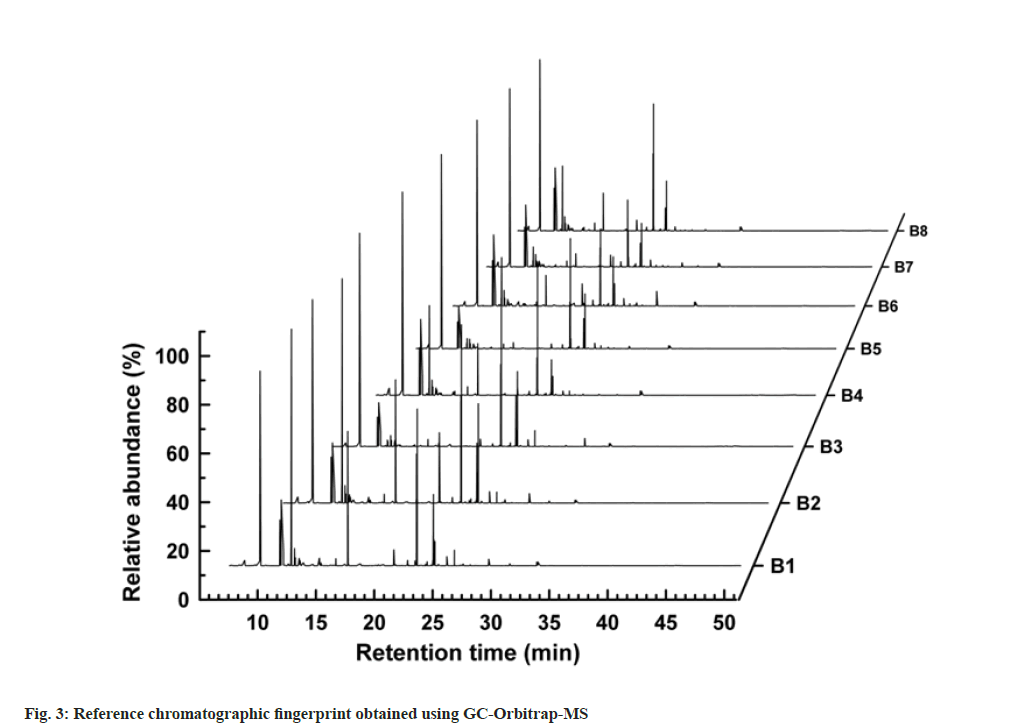
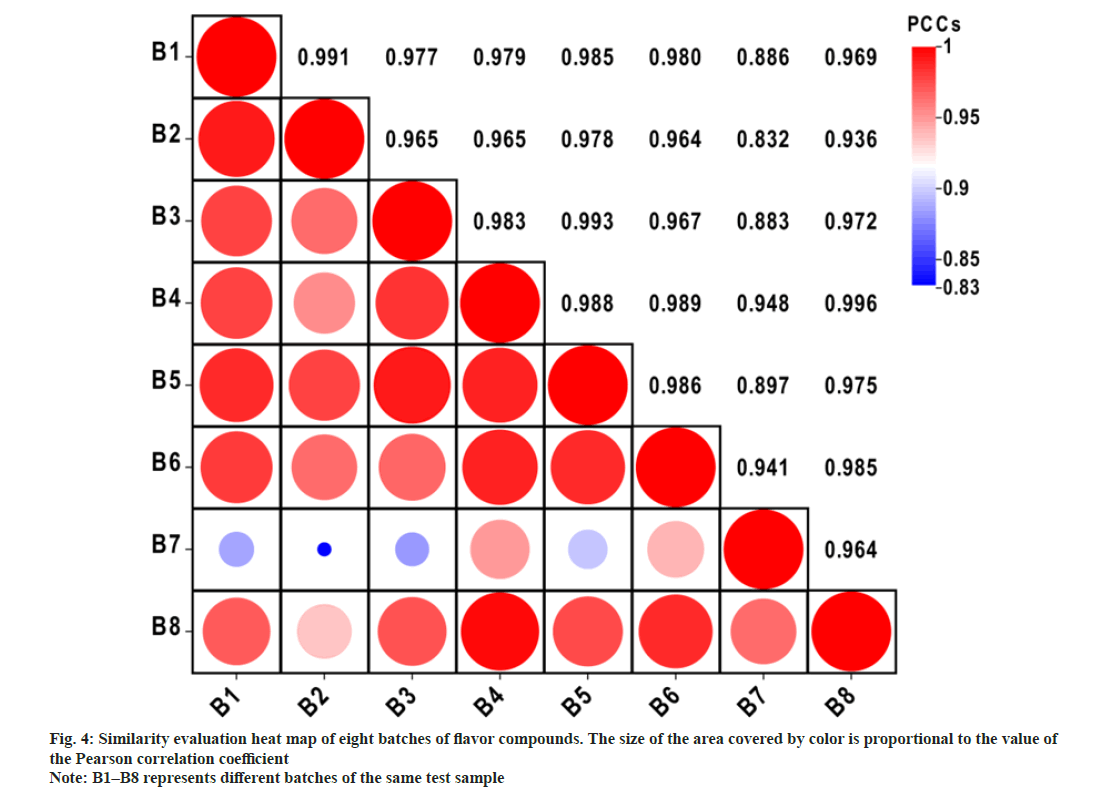
A fingerprint of the analyzed sample was established to reflect its chemical composition. Chromatograms of different batches of the same reference sample were used to establish GC-Orbitrap flavor fingerprints. Flavor samples were studied under the same experimental conditions. The overall fingerprint results are shown in fig. 3, where the GC chromatograms of sample batches 1–8 are shown in ascending order. The peaks in the chromatograms of the eight different batches of flavor samples are referred to as common peaks. Through qualitative analysis, we selected 25 common peaks that represent significant contributions to the flavor and are relatively stable peaks according to their High Resolution Filter (HRF) score and SI and included them in the fingerprint. Among them, HRF is the proportion of spectra that can be explained by the chemical molecular formula obtained from the search database, SI is the similarity obtained by comparing the MS spectra of compounds with the spectra of the spectrum database. The similarities between different batches of the same reference sample were calculated using the PCCs to determine whether the chromatograms could be used to establish a fingerprint. The correlation coefficient heat map revealed some differences among the eight batches of samples, which were indicated by the size of the filling shape inside each square and the correlation coefficient value (fig. 4). This may result from small differences in chemical content among batches. Even so, the PCCs was above 0.83, which demonstrated that the GC-Orbitrap fingerprints of flavors had reasonable consistency, despite slightly different chemical indices[31]. Hence, all of them can be used to establish a flavor fingerprint.
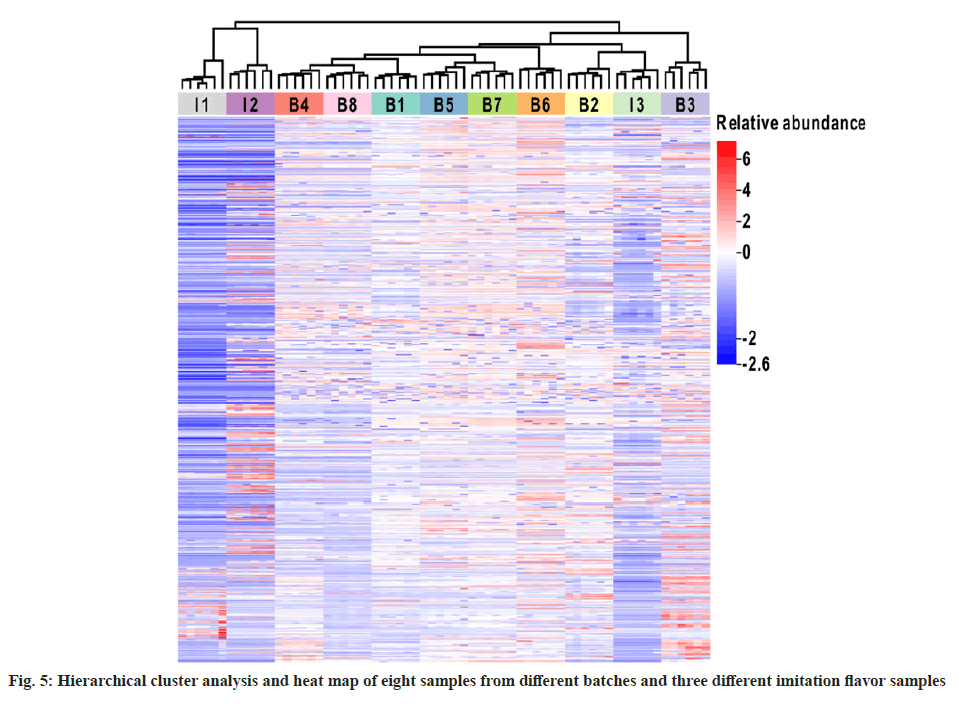
Identification and similarity evaluation of the imitation flavor samples were completed by comparing the chromatograms of I1, I2, and I3 with GC-Orbitrap fingerprints. A cluster analysis heat map for the three imitation flavor compounds and eight reference samples was constructed using ChiPlot. HCA was performed using the relative peak area of the common peaks as a variable and the ED as a computational method. The shorter the distance, the more similar the samples. The grid colors in the heat map are blue-white-red, representing the differences in relative abundance after standardized treatment (fig. 5). The HCA results showed that the 11 flavor samples could be divided into two categories, the first included eight standard samples and the imitation flavor I3, and the second included the remaining two imitation flavors, viz. I1 and I2. A striking observation was that the imitation flavor I3 fell within the range of the reference samples, indicating a high similarity between I3 and reference samples.
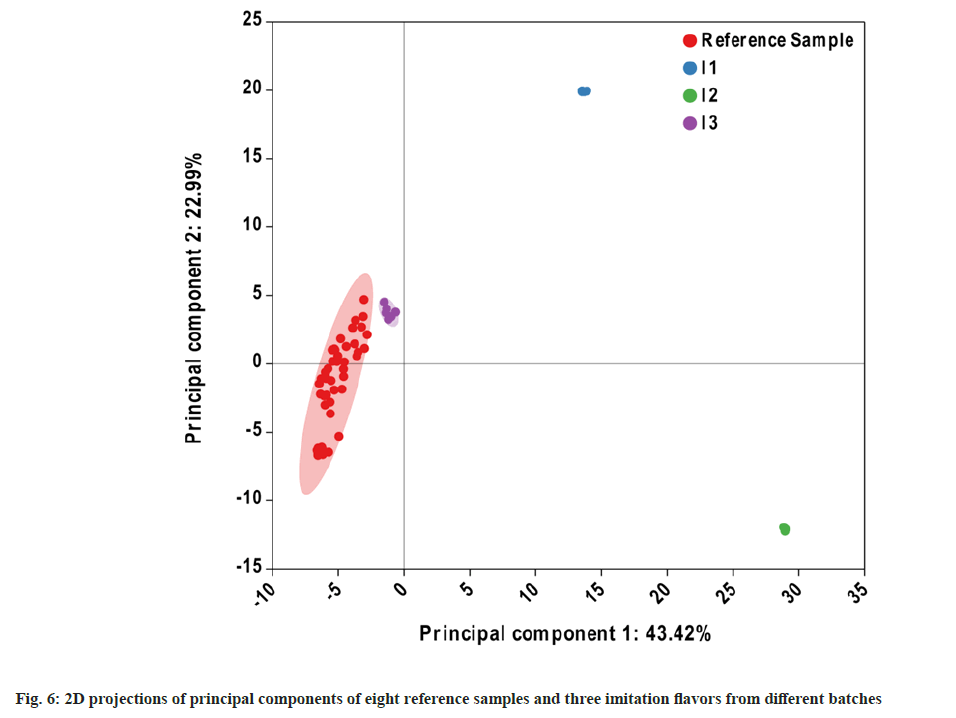
PCA of the 11 samples was conducted using ChiPlot, and the cumulative contribution of the two principal components was 66.41 % (fig. 6). The reference sample points were closer to each other, whereas I1- I3 were dispersed, with I3 being near to the standard samples. The results obtained here are in exceptionally good agreement with the results of the hierarchical clustering heat map. The quality of the multi-batch reference samples was more consistent because of the clustered reference sample points. The distance between I3 and the other two imitation flavors was large but it was similar to that of the reference samples. This indicates that the difference between I3 and the reference samples was small, whereas the difference between the other two imitation samples and the reference samples was large. Nevertheless, the differences between the imitation samples and reference samples were clearly indicated by the PCA results, and the imitation samples were successfully identified. In summary, the GC-Orbitrap fingerprint combined with HCA and PCA can be used to identify imitation flavors.
This study provides an objective and comprehensive method based on GC-HRMS fingerprinting for detecting imitation samples. We used GC-Orbitrap MS fingerprinting to comprehensively characterize the samples. The fingerprint was established using the chromatograms of reference samples with a Pearson correlation coefficient above 0.83. In addition, HCA and PCA were used to analyze the differences between the imitation flavors and the reference samples. Although imitation flavor sample I3 was classified to reference samples by HCA, it can be seen from PCA that the difference of sample point distance can make the imitation samples be identified successfully. The method can be used to evaluate the components of flavor samples and leads to high specificity, precision, and stability, enabling an overall evaluation of the composition of the flavor samples. These findings can be used as a reference for imitation flavor identification in the future. Although this technique is designed for targeting volatile components, calculating the contribution of non-volatile precursors to the taste remains challenging. Future research should concentrate on combining liquid chromatography and GC to create a two-dimensional fingerprint, allowing for a comprehensive characterization of flavor information.
Authors’ contributions:
Methodology, writing—original draft preparation, data analysis was done by Mingyao Gao; methodology, writing—review and editing done by Xiangxu Li; writing—review, supervision and editing by Huan Chen; validation, methodology by Xinsheng Wang; writing—review and editing, supervision by Hongwei Hou and supervision by Qingyuan Hu. All authors have read and agreed to the published version of the manuscript.
Acknowledgements:
This research was supported by China National Tobacco Quality Supervision & Test Center within the provincial and ministerial scientific research projects 110202001006 (XX-02).
Conflicts of interests:
The authors declare no conflict of interests.
References
- Jun W, Yue-li Z. Application of chromatogram fingerprint in the quality control of the flavor and perfume. Anal Test Technol Instrum 2005;12(3):192-6.
- Soares FL, Marcelo MC, Porte LM, Pontes OF, Kaiser S. Inline simultaneous quantitation of tobacco chemical composition by infrared hyperspectral image associated with chemometrics. Microchem J 2019;151:1-9.
- Davis DL, Nielsen MT. Tobacco: Production, chemistry and technology. Blackwell Science 1999.
- Huang LF, Wu MJ, Zhong KJ, Sun XJ, Liang YZ, Dai YH, et al. Fingerprint developing of coffee flavor by gas chromatography-mass spectrometry and combined chemometrics methods. Anal Chim Acta 2007;588(2):216-23.
[Crossref] [Google scholar] [PubMed]
- Pan Y, Zhang J, Li H, Wang YZ, Li WY. Characteristic fingerprinting based on macamides for discrimination of maca (Lepidium meyenii) by LC/MS/MS and multivariate statistical analysis. J Sci Food Agric 2016;96(13):4475-83.
[Crossref] [Google scholar] [PubMed]
- Núñez N, Vidal-Casanella O, Sentellas S, Saurina J, Núñez O. Non-targeted Ultra-High Performance Liquid Chromatography-High-Resolution Mass Spectrometry (UHPLC-HRMS) fingerprints for the chemometric characterization and classification of turmeric and curry samples. Separations 2020;7(2):1-13.
- Li Y, Pang T, Guo Z, Li Y, Wang X, Deng J, et al. Accelerated solvent extraction for GC-based tobacco fingerprinting and its comparison with simultaneous distillation and extraction. Talanta 2010;81(1-2):650-6.
[Crossref] [Google scholar] [PubMed]
- Cai J, Liu B, Ling P, Su Q. Analysis of free and bound volatiles by gas chromatography and gas chromatography-mass spectrometry in uncased and cased tobaccos. J Chromatogr A 2002;947(2):267-75.
[Crossref] [Google scholar] [PubMed]
- Clark TJ, Bunch JE. Qualitative and quantitative analysis of flavor additives on tobacco products using SPME-GC-mass spectroscopy. J Agric Food Chem 1997;45(3):844-849.
- Álvarez MG, González-Barreiro C, Cancho-Grande B, Simal-Gándara J. Relationships between Godello white wine sensory properties and its aromatic fingerprinting obtained by GC-MS. Food Chem 2011;129(3):890-8.
[Crossref] [Google scholar] [PubMed]
- Merckel C, Pragst F, Ratzinger A, Aebi B, Bernhard W, Sporkert F. Application of headspace solid phase microextraction to qualitative and quantitative analysis of tobacco additives in cigarettes. J Chromatogr A 2006;1116(1-2):10-9.
[Crossref] [Google scholar] [PubMed]
- Wang M, Avula B, Wang YH, Zhao J, Avonto C, Parcher JF, et al. An integrated approach utilising chemometrics and GC/MS for classification of chamomile flowers, essential oils and commercial products. Food Chem 2014;152:391-8.
[Crossref] [Google scholar] [PubMed]
- Zhu X, Gao Y, Chen Z, Su Q. Development of a chromatographic fingerprint of tobacco flavor by use of GC and GC-MS. Chromatographia 2009;69:735-42.
- Yokoi M, Shimoda M. Extraction of volatile flavor compounds from tobacco leaf through a low-density polyethylene membrane. J Chromatogr Sci 2017;55(3):373-7.
[Crossref] [Google scholar] [PubMed]
- Amin E, Elwekeel A, Alshariedh NF, Abdel-Bakky MS, Hassan MH. GC-MS analysis and bioactivities of the essential oil of Suaeda aegyptiaca. Separations 2022;9(12):1-13.
- Jing Y, Gong C, Xian K, Wang C, Lu P. The effects of filter ventilation on flavor constituents in cigarette smoke. Beitr Tabakforsch Int 2005;21(5):280-5.
- Wang C, Liu W, Wei Y, Song H. Dynamic changes of the total content of glycoside aroma components in tobacco leaves in different producing areas during the late growth period. J Plant Sci 2018;6(5):164-72.
- Yeh CH, Chou CY, Wu CS, Chu LP, Huang WJ, Chen HC. Effects of different extraction methods on vanilla aroma. Molecules 2022;27(14):1-12.
[Crossref] [Google scholar] [PubMed]
- Guan X, Ge D, Li S, Huang K, Liu J, Li F. Chemical composition and antimicrobial activities of Artemisia argyi Lévl. et Vant essential oils extracted by simultaneous distillation-extraction, subcritical extraction and hydrodistillation. Molecules 2019;24(3):1-12.
[Crossref] [Google scholar] [PubMed]
- Zhong KJ, Wei WZ, Guo FQ, Huang LF. Comparison of simultaneous distillation extraction and solid-phase micro-extraction for determination of volatile constituents in tobacco flavor. J Cent South Univ Technol 2005;12(5):546-51.
- Krüsemann EJ, Cremers JW, Visser WF, Punter PH, Talhout R. The sensory difference threshold of menthol odor in flavored tobacco determined by combining sensory and chemical analysis. Chem Senses 2017;42(3):233-8.
[Crossref] [Google scholar] [PubMed]
- Sun W, Zhou Z, Li Y, Xu Z, Xia W, Zhong F. Differentiation of flue-cured tobacco leaves in different positions based on neutral volatiles with Principal Component Analysis (PCA). Eur Food Res Technol 2012;235:745-52.
- Li H, Liu Y, Wang Z, Zhang Q, Xing J, Bai H, et al. Non-targeted analysis of unknown volatile components in scented stationery via headspace GC-Orbitrap MS. Talanta 2022;242:123285.
[Crossref] [Google scholar] [PubMed]
- Gómez-Ramos MM, Ucles S, Ferrer C, Fernández-Alba AR, Hernando MD. Exploration of environmental contaminants in honeybees using GC-TOF-MS and GC-Orbitrap-MS. Sci Total Environ 2019;647:232-44.
[Crossref] [Google scholar] [PubMed]
- Pan M, Xiang P, Yu Z, Zhao Y, Yan H. Development of a high-throughput screening analysis for 288 drugs and poisons in human blood using Orbitrap technology with gas chromatography-high resolution accurate mass spectrometry. J Chromatogr A 2019;1587:209-26.
[Crossref] [Google scholar] [PubMed]
- Sapozhnikova Y. Non-targeted screening of chemicals migrating from paper-based food packaging by GC-Orbitrap mass spectrometry. Talanta 2021;226:1-10.
[Crossref] [Google scholar] [PubMed]
- Granato D, Santos JS, Escher GB, Ferreira BL, Maggio RM. Use of Principal Component Analysis (PCA) and Hierarchical Cluster Analysis (HCA) for multivariate association between bioactive compounds and functional properties in foods: A critical perspective. Trends Food Sci Technol 2018;72:83-90.
- Zhu H, Wang Y, Liang H, Chen Q, Zhao P, Tao J. Identification of Portulaca oleracea L. from different sources using GC-MS and FT-IR spectroscopy. Talanta 2010;81(1-2):129-35.
[Crossref] [Google scholar] [PubMed]
- Xue Y, Zhu L, Yi T. Fingerprint analysis of Resina draconis by ultra-performance liquid chromatography. Chem Cent J 2017;11(1):1-8.
[Crossref] [Google scholar] [PubMed]
- Xu H, Zhang Y, Tao Y, Huang B, Shen D, Li G, et al. Study of chemical fingerprint for yuanhu zhitong tablet by UPLC/Q-TOF-MS. J Liq Chromatogr Relat Technol 2013;36(6):807-20.
- Liu M, Wu Y, Huang S, Liu H, Feng J. Spectrum-effect relationship between HPLC fingerprints and hypolipidemic effect of Curcuma aromatica. Biomed Chromatogr 2018;32(7):1-18.
[Crossref] [Google scholar] [PubMed]
 ): Solvent dilution and (
 ): SDE 2.0 h
 ): SDE 3.0 h