- *Corresponding Author:
- Rachana Sharma
School of Studies in Chemistry and Biochemistry, Vikram University, Ujjain , Madhya Pradesh-456010, India
E-mail: sharmarachana385@gmail.com
| Date of Received | 08 June 2020 |
| Date of Revision | 22 Ocotober 2020 |
| Date of Acceptance | 18 January 2021 |
| Indian J Pharm Sci 2021;83(1):60-68 |
This is an open access article distributed under the terms of the Creative Commons Attribution-NonCommercial-ShareAlike 3.0 License, which allows others to remix, tweak, and build upon the work non-commercially, as long as the author is credited and the new creations are licensed under the identical terms
Abstract
Biopolymeric nanoparticles were synthesized using Gellan Gum and loaded with Atenolol, an antihypertensive drug by ionotropic gelation (an easy and ecofriendly system) induced by BaCl2 as an ionic crosslinking agent to improve absorption and bioavailability of drug. These nanoparticles were characterized by scanning electron microscope, fourier-transform infrared spectroscopy, X-ray diffraction analysis and dynamic light scattering techniques. Mean particle size obtained was 85.61 nm by X-ray diffraction, Zeta potential -19.4 mV with fibrous morphology. In order to optimize conditions for in vitro drug release various physicochemical parameters were studied. Different kinetics model were used to analyze in vitro drug release and results indicated that the drug release follows Korsemeyer-Peppa’s model.
Keywords
Ionotropic gelation, nanoparticles, gellan gum, antihypertensive drug, atenolol, biopolymer
Nanomedicines and nano drug carrier systems are new but rapidly growing areas of science where the biocompatible materials such as synthetic polymers or natural polymers in the nano scale range are employed to serve as means of diagnostic tools or to act as a delivery vehicle to specific targeted sites in a controlled manner[1]. Nano drug delivery systems offer many advantages over conventional delivery systems such as sustainable release, improved efficacy, and reduced toxicity, protection of drugs against enzymatic and chemical degradation when administered inside the body[2].
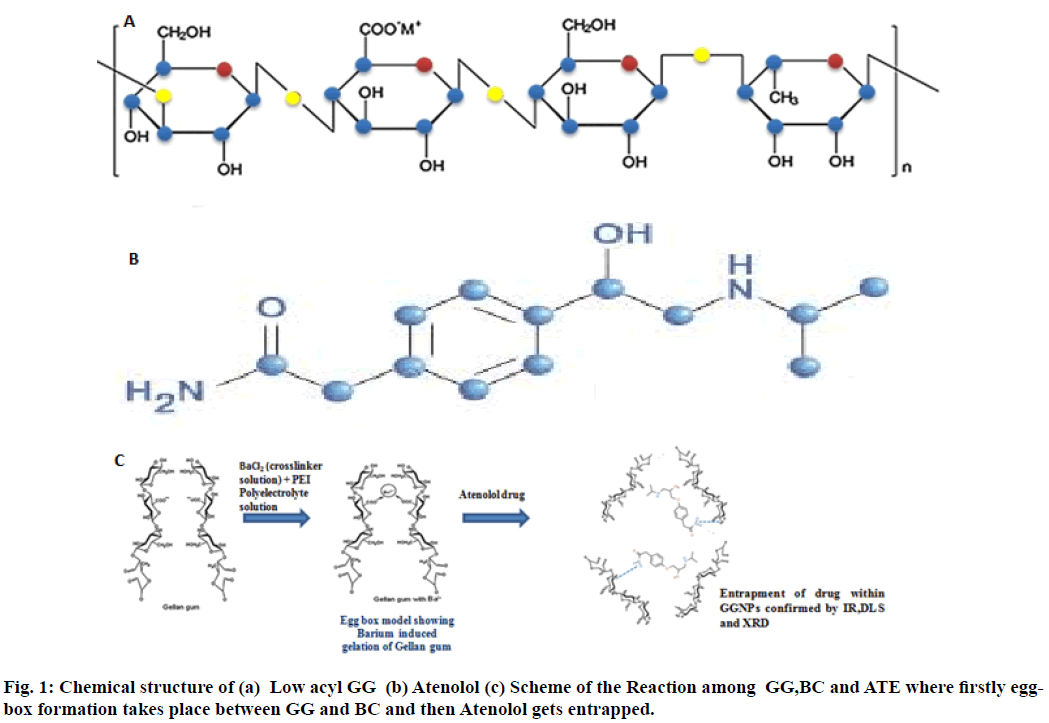
The biopolymers due to their outstanding properties are known to be good candidates for drug delivery applications. These biopolymers may be in the form of polysaccharides[3-5], which may be exopolysaccharides e.g. mannitol, dextran, gellan gum (GG), welan gum etc. and are soluble in water, ionic or nonionic polymers and among them, GG has drawn increased attention of researchers due to its favorable physicochemical, mechanical and functional properties such as abundance in nature, non-toxicity, easy modification (due to presence of carboxylic groups),easy gelation, mucoadhesiveness and thermal stability etc. GG is a linear, anionic tetrasaccharide consisted of two residues of D-glucose (Glc) and one of each residue of L-rhamnose (Rha) and D-glucuronic acid (GlcA)[6] (fig. 1(a)). GG has already been processed into floating beads with Rifabutin[7], nanoparticles with vancomycin for osteomyelitis treatment[8], as injectable hybrid delivery system with gentamycin for localized treatment of bone infections[9], as a composite hydrogel for being used as an adsorbent for cationic dyes[10], in the form of gellan microcarriers for pH-responsive sustained oral delivery of glipizide[11] and in the delivery of epigallocatechin gallate found in green tea[12], even the role of microspheres of GG has also been investigated in its freeze drying and rehydration process[13].
The most important characteristic of GG is its gelling property which occurs during the heating or cooling of GG solution in the presence of monovalent (Na+, K+) or divalent cations such as Ca2+, Mg2+ , Ba2+[14,15] or even some trivalent cation like Al3+. Studies reveal that its affinity towards bivalent cations is more as compared to monovalent or trivalent cations[7]. The gelation of GG occurs by a two-step process i.e. formation of double helices from random coil chains followed by an aggregation of pairs of double helices[16,17]. The coil-helix transition is highly influenced by electrostatic interaction with cations present in the solution[18,19].
Generally, bioavailability refers to the presence of drug molecules where they are needed in body with an increased efficacy. The issue of drug delivery is based on maximizing bioavailability over a period of time at specific places inside the body. Current pharmaceuticals suffer from poor bioavailability which requires a higher or repetitive dose of drugs as is the case with atenolol where overdosing of drug may cause various side effects including type II diabetes, to overcome such problems nanoscience can be very useful, involving development of new carrier systems for enhancement of bioavailability along with improved drug delivery like entrapment of drug within nanoscale cavity of biopolymeric matrix.
Atenolol, a selective β1-adrenoreceptor antagonist is prescribed widely in diverse cardiovascular disorders like hypertension, angina pectoris (chest pain), arrhythmias (rhythm disorders) and acute myocardial infarction (heart attack) etc. Atenolol has low pKa value 9.6[20] thus it undergoes ionization in stomach and intestine leading to inefficient absorption though membranes, thus possess low oral bioavailability ~50 %[21,22]. Atenolol loaded nanoparticles were also investigated in our previous work in combination with biopolymer sodium alginate[23]. In comparison to other antihypertensive drugs like propranolol or metoprolol, atenolol resists metabolism by the liver and the absorbed dose is eliminated by renal excretion. Administration of conventional tablets of this drug has been reported to have fluctuations in the plasma drug levels, which results in manifestation of side effects or reduction in drug concentration at the receptor site. Hence, the aim of this piece of work was to prepare atenolol loaded (antihypertensive drug) GG nanoparticles to improve its bioavailability and absorption thereby reducing side effects of this drug using Ionotropic gelation followed by Polyelectrolyte complex (PEC), a wellknown method for the preparation of nanoparticles due to its non-toxicity, and cost-effectiveness[24], with the determination of drug entrapment followed by drug release.
A number of studies involving ionotropic gelation with polyelectrolyte complexation have been reported and polymers like poly-l-lysine, chitosan, Polyethyleneimine (PEI) or polyaziridine, ammonium glycyrrhizate etc. have been significantly used for this purpose[25-31].
Materials and Methods
GG (low acyl) was procured from Sisco Research Laboratories, India, Atenolol drug was obtained as a gift sample, Polyethyleneimine was purchased from Loba Chemie, Mumbai. BaCl2 was purchased from Merck. Other chemicals used were of pharmaceutical and analytical grade.
Preparation of blank polysaccharide based nanoparticles:
Blank GG nanoparticles were prepared by ionotropic gelation reported by Rajaonarivony et al.[24] with certain modifications as mentioned below. The preparation of nanoparticles is two-step process. Step I; 2 ml Barium chloride (3.35 mg/ml, w/v) was added drop wise to 10 ml GG aqueous solution (3 mg/ml, w/v) to induce gellification while stirring for 30 min using a magnetic stirrer (Remi, India) at 1200 rpm. Step II; 4 ml PEI solution (0.8 mg/ml, w/v) was added into the above obtained pre-gel solution to form polyelectolyte complex and was stirred for 1 h. The resultant suspension was kept overnight. The nanoparticles thus formed were separated by ultracentrifuge for 45 min and dried under lyophilizer at -78° for 24 h using D-Mannitol as a cryoprotectant.
Preparation of drug loaded gg nanoparticle
2 ml aqueous solution of atenolol drug (500 ppm) was incorporated to 10 ml GG aqueous solution (3 mg/ml, w/v) and rest of the process was same as described under heading preparation of blank nanoparticles.
Physicochemical characterization:
FT-IR spectral analysis
FT-IR analysis were conducted to assess the interaction between different formulation components such as GG, GG- blank nanoparticles (BC NPs), pure atenolol drug and GG-ATE NPs using FT-IR Jasco-4600 at a scanning range 4000-400cm-1 using KBr pellets.
Surface morphological studies:
Dried GG-ATE NPs were examined under a scanning electron microscope JEOL-JSM -5600 and EVO 18, Carl Zeiss at an acceleration voltage of 20kV and 6.0 kV respectively, mounted on a metal stub.
Measurement of Particle Size and Zeta Potential:
Particle size and zeta potential of blank nanoparticles and drug loaded nanoparticles were examined using Malvern Zeta Sizer Nano ZS.
Particle size measurement by X-ray diffraction (XRD):
In order to confirm the crystalline or amorphous nature of atenolol, GG and prepared nanoparticles, X-ray diffraction method was used (Bruker, D-8 advance). The data collection was performed using Cu Kα at 0.154 nm and a voltage of the monochromator at 40 kV. The diffraction pattern was determined in the area 5° < 2θ < 60° at 5° per min scanning speed. The area of the peaks at 2θ values had been considered as the representative peaks for calculation of crystallinity index i.e. percentage crystallinity calculated by XRD deconvolution method. Crystallinity can be calculated from the ratio of the integrated area of all crystalline peaks to the total integrated area under the XRD peaks[32]. Percentage crystallinity=Ic/Ic+Ia×100 (1). Where, Ia and Ic are the integrated intensities corresponding to the amorphous and crystalline phases, respectively.
Drug content and Entrapment Efficiency (AE):
The amount of drug loaded in nanoparticles was determined by ultraviolet (UV) visible spectrometer (Perkin Elmer, Lambda 25). The drug loaded nanoparticles suspension was centrifuged at 18000 rpm for 30 min using cooling centrifuge (Remi, India). The supernatant solution was separated and the amount of free drug in the supernatant solution was determined by UV visible spectrometer at 224 nm. Drug content was calculated using a calibration curve and percentage entrapment efficiency (AE)[33] was calculated using following formula. The experiments were performed in triplicate.
Percentage efficiency=Total drug-Free drug/Total drug×100
In vitro drug release studies
In vitro release studies were carried out by using dialysis membrane. The drug loaded nanoparticles (equivalent to 25 mg of drug) were dissolved in 10 ml distilled water and taken in a dialysis bag (molecular weight cut off 20 kDa, pore size 0.2 μm) and was placed in the receptor compartment containing 100 ml distilled water. The medium was agitated continuously at 50 rpm using a magnetic stirrer and the temperature was maintained at 37±0.5°[34]. 5 ml sample was withdrawn at various time intervals over a period of 48 h. and fresh distilled water was replaced during each sampling. The amount of drug released was determined by UV-Visible spectrometer at 224 nm.
In vitro drug release kinetics:
The drug release data were fitted into different kinetics model such as Zero order, First order, Higuchi, Hixon- Crowell’s cube root equation and Korsemeyer-Peppa’s model to understand the kinetics and drug release mechanism from nanoparticles. The methods were adopted to investigate the most suitable model[35,36].
Results and Discussion
Ionotropic gelation is a famous process for the preparation of GG nanoparticles. As for GG, the ionic interactions between the negatively charged GG polymer and the positively charged counter ions Ba2+, were used to prepare GG nanoparticles. The use of low acyl GG for the preparation of nanoparticles increases its dissolution in distilled water and hence at a very low concentration of counter ions (Ba2+, 0.3 % (w/v)) gelation of GG occurs. Ionotropic gelation is mainly based on the polyelectrolytes to crosslink with the counter ions to induce the formation of gels which entrap the drug within themselves and release the therapeutic or drug to its target when administered. Ionic gelation method results initially the formation of Ba-GG complexes and interaction between Ba2+ ions and glucuronic sequences of GG provides an aid for the formation of egg-box structures[37].
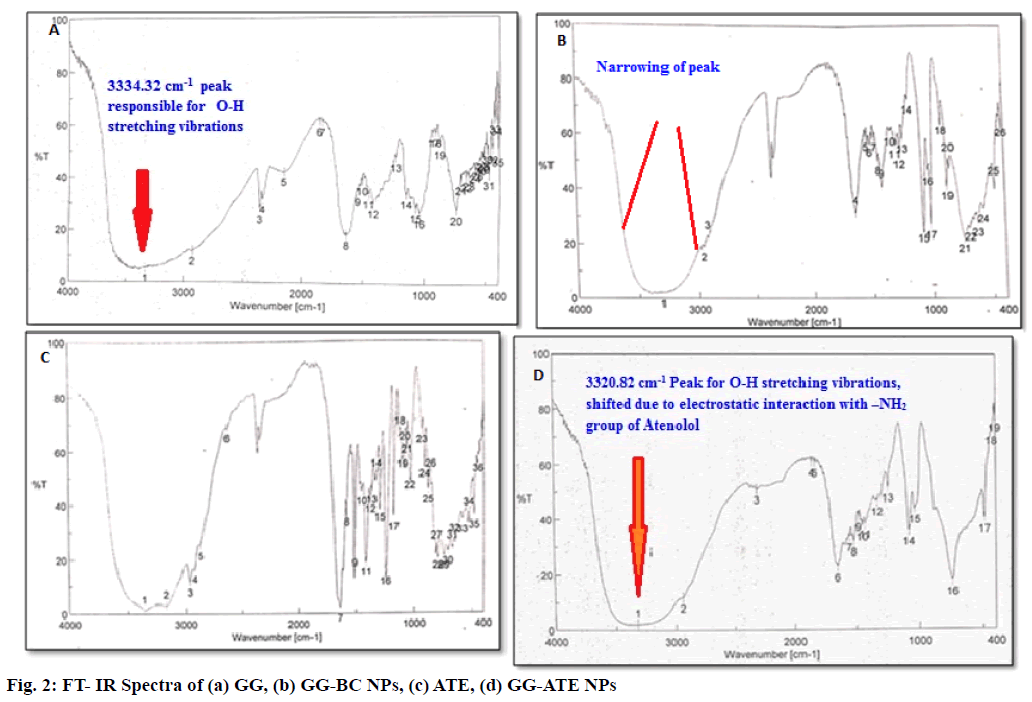
The successful attempt in the synthesis of GG-ATE NPs was initially evaluated by using FT-IR spectra which is given in fig. 2 (a-d). The FT-IR spectrum of GG (fig. 2a) shows characteristic peaks at 3334.32 cm-1 (O-H stretching), 2933.2 cm-1 ( C-H stretching), two strong peaks at 1634.38 cm-1 and 1416.46 cm-1 corresponds to asymmetric and symmetric stretching of carboxylate group and 1046.19 cm-1 indicates C-O stretching for alkyl ether[38].
Absorption region of stretching vibrations of O-H bonds in barium- GG nanoparticles appear narrow than that obtained in native GG. This difference arises from the participation of hydroxyl and carboxyl groups of gellan to the barium ion in order to form chelating structure and consequent decrease in hydrogen bonding which results in narrowing of bands in barium-GG blank nanoparticles. The peak obtained at 1075 cm-1 is attributed to the C-O stretching vibration of pyranosyl ring (fig. 2 (b)).
The FT-IR spectrum of Atenolol in fig. 2c shows peaks at 3362.28 cm-1 for O-H stretching, at 3174.26 cm-1 for N-H stretching, at 2965.02 cm-1 for C-CH3 Stretching, at 1581.34 cm-1 for C=C aromatic stretching, at 1732.1 cm-1 for C=O stretching and at 1637.22 cm-1 for O=C-NH2 stretching[35].
The interaction between polymer and drug can be identified by the shifting or disappearance of frequency of functional characteristic peaks. FTIR spectrum of ATE loaded GG NPs in fig. 2d shows characteristic peaks of both polymer and drug. As an evident from the FT-IR spectrum of GG-ATE nanoparticles, a shift in peak responsible for –OH stretching (3334.32 cm-1) of GG to lower frequency 3320.82 cm-1 is observed. The reason behind it may be electrostatic interactions between amine group of drug and hydroxyl group of native GG, which causes the frequency shift towards lower side. Similarly a small shift in asymmetric and symmetric stretching of carboxylate group is observed. This indicates loading of atenolol on GG nanoparticles.
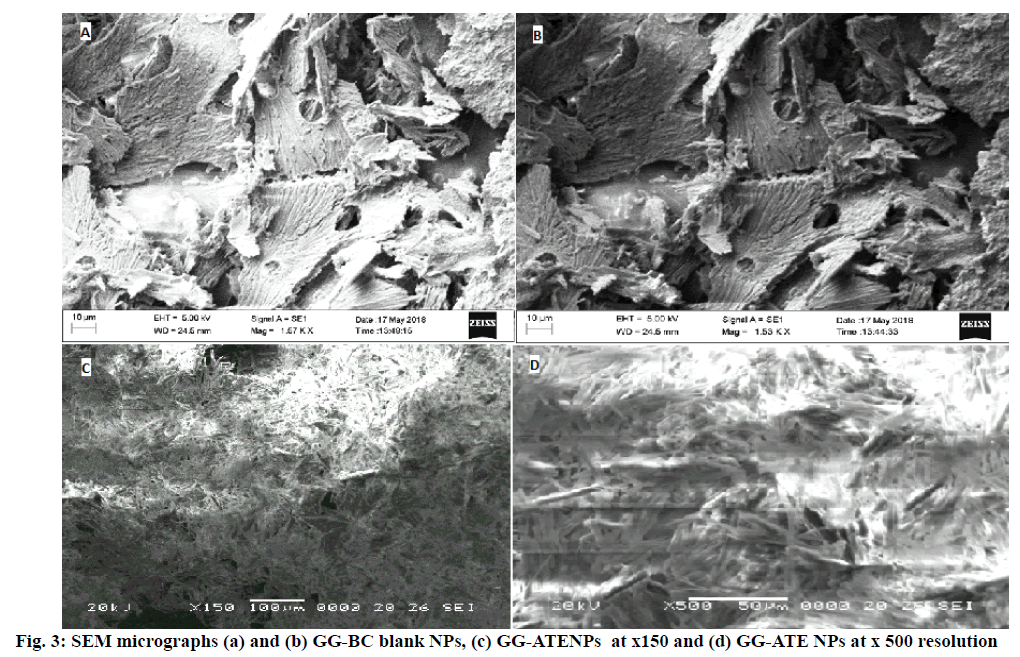
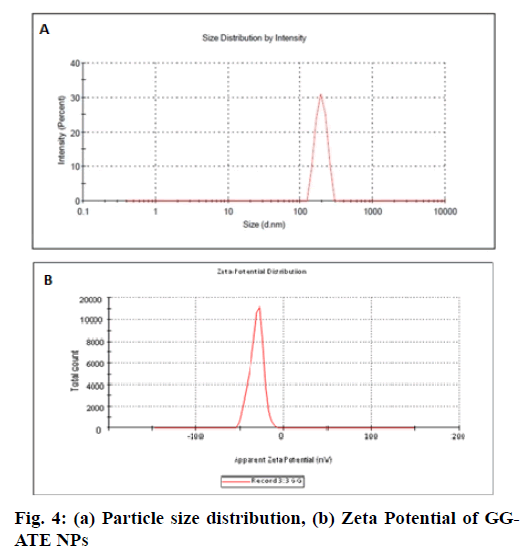
SEM micrographs revealed that the surface morphology of blank GG-BC NPs indicates porous surfaces (fig. 3a and b) and morphology of GG-ATE NPs and its matrix structure is fibrous or rod like as shown in fig. 3c and d. The particle size of optimized nanoparticles is shown in fig. 4(a). The mean particle size of the optimized formulation was found to be 182.1±3.15 nm with PDI value 0.094±0.003. The low PDI value indicates the uniform particle size distribution which may be due to the adoption of optimized formulation parameters. The surface charge of NPs monitor their capability to interact under physiological environment i.e. with cell membrane and biological components which in turn affects the in vivo future of the nanoparticles[39,40] and it also helps to determine whether a charged active material is encapsulated within the system or adsorbed onto the surface or both . The DLS instrument was used in its electrophoretic light scattering mode to measure zeta potential. An average zeta potential of -19.4 ±3.15 mV as shown in fig. 4b, was obtained, which indicates good stability of the formulation. A negative zeta potential might be attributed to the presence of carboxyl end groups (from GG). A high value of zeta potential also indicates the electrostatic repulsion between particles with the same charge which prevents them from aggregation and stabilizes them thus nanoparticles with uniform size is obtained[41,42].
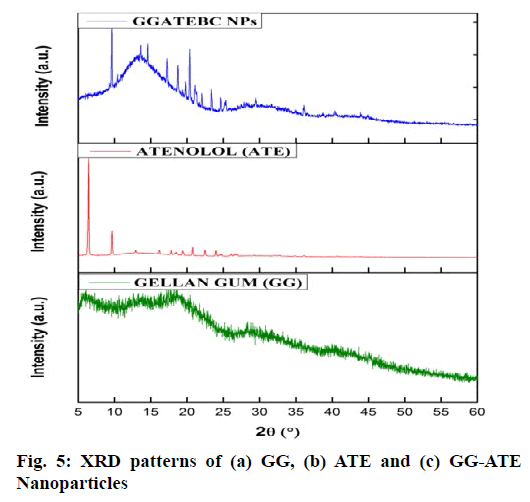
The X-ray diffraction spectra recorded for (a) GG, (b) ATE and (c) GG-ATE NPs are presented in fig. 5. Results in fig. 5b shows completely crystalline nature of pure ATE since it exhibited several intense characteristic signals at diffraction angle (2θ)=6.59°, 9.72° and 20.92°, while GG and GG-ATE diffractogram shows amorphous nature (fig. 5a and 5c). Drug entrapment in GG nanoparticles has been proved by disappearance of characteristic peak of atenolol and due to this the nature of GG changes to semicrystalline[43]. Moreover, the crystallographic data indicates that the percentage crystallinity of atenolol was decreased from 68 % (in pure drug) to 28 % (in entrapped drug) which clearly indicates the change of drug from its crystalline to amorphous state, although the crystallinity of GG is increased and thus we obtain semi crystalline nanoparticles.
The size of the nanoparticles was calculated by Debye Scherrer equation (D=0.9λ/β cos θ) to determine various characteristics of the crystalline material, where D is the crystal size, λ is the wavelength of X-ray, θ is the Braggs angle in radians, and β is the full width at half maximum (FWHM) of the peak in radians. The calculated particle size was 85.61nm[44].
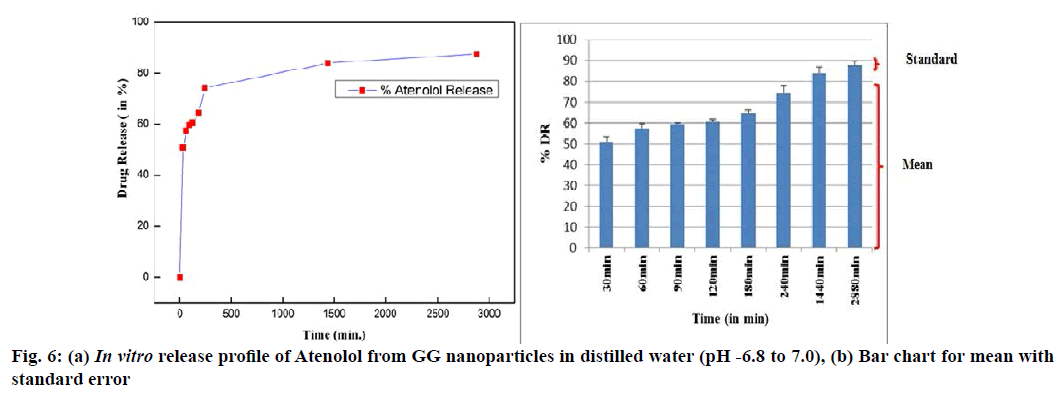
λmax value of the drug in distilled water was observed at 224nm (pH 6.8-7.0). The entrapment efficiency of GG nanoparticles was greatly influenced by atenolol concentrations hence different concentrations of atenolol were loaded on NPs and then an optimized concentration (500 ppm or 500 μl) of drug was used to prepare nanoparticles. Entrapment efficiency was found to be 68.85±3.19 %. GG-ATE NPs were investigated in order to characterize their properties as a controlled drug delivery system. The release profile for drug loaded nanoparticles was observed in distilled water (at pH 6.8 to 7.0) and results are shown (fig. 6).
In vitro drug release from GG-ATE NPs shows (fig. 6a and b) initial burst release of about 50-60 % within 60 min through which the drug molecule present on the surface of the nanoparticles get released into release media which may be due to porous nature of GG. After initial burst release, the drug was released by bulk degradation along diffusion of the drug leading to a plateau for 3h followed by a constant sustained release of the drug over 48h[36,45].
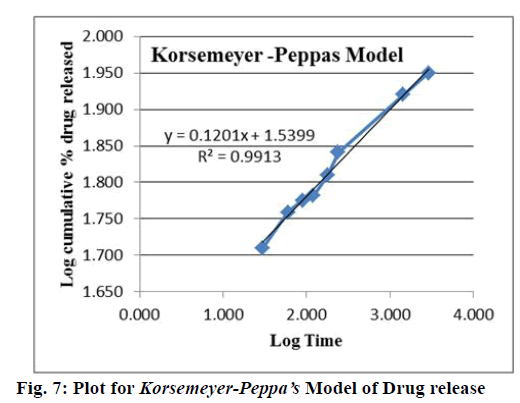
On the basis of best fit with the highest correlation (R2) value, it is concluded that GG-ATE NPs follow the Korsemeyer-Peppa’s model[46-48] which shows that the drug release mechanism involved diffusion with release exponent (n) value (slope in the fig. 7) less than 0.5, i.e. n=0.12 representing porous system (in accordance to SEM results, where porous morphology is exhibited by GG) including combined mechanism of diffusion through matrix and partially through water filled pores which shifts the release exponent (n) towards smaller value. Generally, swellable polymeric devices follow Korsemeyer-Peppa’s model[49]. Thus from the results it can be concluded that the drug release from nanoparticles was through the combination of bulk degradation along with diffusion[36]. The plot for Korsemeyer- Peppa’s model is shown in fig. 7 and results are summarized in Table 1.
| Model Name | R2 | Slope (n) | Intercept |
|---|---|---|---|
| Zero order | 0.73 | 0.01 | 60.40 |
| First order | 0.85 | 0.0002 | 1.59 |
| Higuchi Model | 0.85 | 0.71 | 53.67 |
| Korsemeyer-Peppa's Model | 0.99 | 0.12 | 1.53 |
| Hixon-Crowell's Cube-root equation | 0.87 | 0.0004 | 1.2045 |
Table 1: Different Models in Terms of R2, Slope and Intercept
Moreover, nanoparticles get dissolved in release medium (distilled water), and atenolol freely release in distilled water. Also, the binding of atenolol molecules that accumulate on the surfaces of nanoparticles and the polymer matrix is not too strong, and therefore the atenolol molecules tend to depart from the surfaces of nanoparticles and diffuse to the external medium. This study has shown that a hydrophilic drug atenolol can be entrapped in GG nanoparticles in an aqueous environment by ionotropic gelation method using BaCl2 as a cross linker. These polysaccharide (GG) based nanoparticles were characterized by FT-IR, SEM, particle size analysis and zeta potential (DLS) and XRD methods. SEM micrographs exhibited fibrous or rods like structures. FT-IR studies confirmed the drug entrapment within GG nanoparticles; XRD results indicate the distribution of the drug molecules in prepared nanoparticles and are in agreement with the results obtained by FT-IR. Dynamic light scattering (DLS) results show uniform distribution of nanoparticles. About 88% of drug release was achieved (in 48 h) in aqueous environment (pH 6.8- 7.0) .The results of the study indicate that drug loaded nanoparticles could be used to minimize the loss of drug and enhance its bioavailability thereby reducing its side effects. The release of atenolol was found to be dependent on the extent of crosslinking of the polymer matrix as well as the amount of GG present in the matrix. Higher release rates were observed with lower concentration of cross linker and GG. Ionotropic gelation used for the preparation of GG nanoparticles is an economically viable approach which offers great opportunities in the field of bioencapsulation and could be suitable for the encapsulation of fragile drugs.
Acknowledgements:
Author highly acknowledge Dr.Shubha Jain ,Professor and Head, School of Studies in Chemistry and Biochemistry, Vikram University, Ujjain (M.P.) for her continuous guidance and support, Parul Group of Institutes, Vadodara (Gujarat) for providing zeta potential and DLS analysis facility. Dr. G.S. Okram and Dr.Mukul Gupta, Dr.Layantha Bahera, (XRD), Dr.D.M. Phase, Mr.Vinay Ahire (SEM) , Scientists and Junior Engineers, UGC-DAE CSR, Indore (M.P.) and Mr. S.K. Paswan, Assistant Professor, SGSITS, Indore (M.P.) for providing lab facilities and analytical facilities and Central University, Gandhinagar (Gujarat) for SEM analysis.
References
- Gref R, Minamitake Y, Peracchia MT, Trubetskoy V, Torchilin V, Langer R. Biodegradable Long-Circulating Polymeric Nanospheres. Science 1994;263(5153):1600-3.
- Alonso MJ. Nanomedicines for overcoming biological barriers. Biomed Pharmacother 2004;58(3):168-72.
- Florence AT, Hillery AM, Hussain N, Jani PU. Nanoparticles as carriers for oral peptide absorption: studies on particle uptake and fate. J Control Release 1995;36(1-2):39-46.
- Kundu J, Sundar S and Kundu SC. Biopolymeric nanoparticles. Sci Techno Adv Mater 2010;11:014104-17.
- Numata K, Nitta SK. Biopolymer-Based Nanoparticles for Drug/Gene Delivery and Tissue Engineering. Int J Mol Sci 2013;14(1):1629-54.
- Jansson PE, Lindberg B. Structural studies of GG, an extracellular Polysaccharide elaborated by Pseudomonas elodea. Carbohydr Res 1983;124(1):135-9.
- Verma A, Pandit JK. Rifabutin-loaded floating GG beads: effect of calcium and polymer concentration on incorporation efficiency and drug Release.Trop J Pharm Res 2011;10:61-7.
- Posadowska U, Brzychczy WM, Pamula E, Injectable GG-based nanoparticles-loaded system for the local delivery of vancomycin in osteomyelitis treatment. J Mater Sci: Mater Med 2016;27(1):9.
- Pamuła E, Posadowska U, Brzychczy WM, Drożdż A, Borkowicz KM, Biegun WM et al. Injectable hybrid delivery system composed of GG, nanoparticles and gentamicin for the localized treatment of bone infections. Expert Opin Drug Deliv 2016;13(5):613-20.
- Vishalakshi B, Krishna A. GG-based novel composite hydrogel: Evaluation as adsorbent for cationic dyes. J Appl Polym Sci 2017;134(47):45527.
- Maiti S, Laha B, Kumari L. Gellan micro-carriers for pH-responsive sustained oral delivery of glipizide.Farmacia 2015;63(6):913-21.
- Dilbaghi N, Dahiya S, Rani R ,Kumar S, Dhingra D. Chitosan-GG bipolymeric nanohydrogels—a potential nanocarrier for the delivery of epigallocatechin gallate. Bio Nano Sci2017;7(3):508-20.
- Cassanelli M, Norton I, Mills T. Role of GG microstructure in freeze drying and rehydration mechanisms. Food Hydrocolloids 2018;75:51-61.
- Moritaka H, Fukuba H, Kumeno K, Nakahama N ,Nishinari K. Effect of monovalent and divalent cations on the rheological properties of gellan gels. Food Hydrocolloids 1991;4(6):495-507.
- Nishinari M, Morris ER, Rinaudo M.nGelation of gellan- A review. Food Hydrocolloids2012;28(2):373-411.
- Chandrasekharan R, Radha A. A Molecular architectures and functional –properties of GG and related polysaccharides. Trends Food Sci Technol 1995;6(5):143-8.
- Grasdalen H, Smidsrod O. Gelation of GG. Carbohydr Polym 1987;7(5):371-93.
- Quinn FX, Hatakeyama T. The Conformational Properties of GG Hydrogels. Polym Gels Networks 1993;1:93-114.
- Rozier A, Mazuel C, Grove J, Plazonnet B. Functionality testing of GG, a polymeric excipient material for ophthalmic dosage forms. Int J Pharm 1997;153:191-8.
- Mohsen N, Ebrahimabadi AH, Niknahad B. Partition coefficient n- octanol / water of propranolol and atenolol at different temperatures: Experimental and theoretical studies. J Chem Thermodyn2012;54:393-7.
- Melander A, Stenberg P, Liedholm H, Scherten B, Boll EW. Food –induced reduction in bioavailability of atenolol. Eur J Clin Pharmacol1979;16(5):327-30.
- McAinsh J, Simpson WT, Holmes BF, Young J, Ellis SH . Bioavailability of atenolol formulations. Biopharm Drug Dispos 1980;1(6):323-32.
- Sharma R. Formulation and characterization of atenolol loaded sodium alginate nanoparticles. J Chem Pharm Res 2017;9:208-11.
- Rajaonarivony M,Vautheir G, Puidieure F,Couvereu P. Development of a new drug carrier made from alginate. J Pharm Sci1993;82(9):912-7.
- Sarmento B, Martins S, Ribeiro A. et al. Development and comparison of different nanoparticulate polyelectrolyte complexes as insulin carriers. Int J Pept Res Ther 2006;12(2):131-8.
- Woitiski CB, Sarmento B, Carvalho RA, Neufeld R J, Veiga F. Facilitated nanoscale delivery of insulin across intestinal membrane models. Int J Pharm 2011;412(1-2):123-31.
- Aynie I, Vauthier C, Chacun H et al. Spongelike alginate nanoparticles as a new potential system for the delivery of antisense oligonucleotides. Antisense Nucleic Acid Drug Dev 1999;9(3):301-12.
- Goycoolea FM, Lollo G, Remuñan-López C, et al. Chitosan-alginate blended nanoparticles as carriers for the transmucosal delivery of macromolecules. Biomacromolecules 2009;10(7):1736-43.
- Motwani SK, Chopra S, Talegaonkar S, Kohli K, Ahmad FJ, Khar RK. Chitosan–sodium alginate nanoparticles as submicroscopic reservoirs for ocular delivery: formulation, optimisation and in vitro characterisation. Eur J Pharm Biopharm 2008;68(3):513-25.
- Nagarwal RC, Kumar R, Pandit JK. Chitosan coated sodium alginate- chitosan nanoparticles loaded with 5-FU for ocular delivery: in vitro characterization and in vivo study in rabbit eye. Eur J Pharm Sci 2012;47(4):678-85.
- Lopes M, Abrahim B, Veiga F, Seiça R, Cabral LM, Arnaud P et al. Preparation methods and applications behind alginate-based particles. Expert Opin Drug Del 2017;14(6):769-82.
- Bhattacharya SS, Banerjee S, Chowdhury P, Ghosh A, Hegde RR, Mondal R. Tranexamic acid loaded GG-based polymeric microbeads for controlled release: In vitro and in vivo assessment. Colloids Surf B 2013;112:483-91.
- Alonso MJ, Calvo P, Lopez CR, Jato VJL. Novel hydrophilic chitosan–polyethylene oxide nanoparticles as protein carriers. J Appl Polym1997;63(1):125-32.
- Preat V, Danhier F, Lecouturier N, Vroman B, Jerome C, Feron O et al. Paclitaxel-loaded PEGylated PLGA-based nanoparticles: In vitro and in vivo evaluation. JControl Release 2009;133(1):11-7.
- Chourasiya V, Bohrey S, Pandey A. Formulation, optimization, characterization and in-vitro drug release kinetics of atenolol loaded PLGA nanoparticles using 3 3 factorial design for oral delivery. Materials Discovery 2016;5:1-13.
- Balla A, Goli D. Formulation and evaluation of PLGA nanoparticles of ropinirole HCl for targeting brain. Ind J Pharm Sci 2020;82(4):622-31.
- Grant GT, Morris ER, Rees DA, Smith PJC, Thom D. Biological interactions between polysaccharides and divalent cations: the egg-box model. FEBS Lett 1973;32(1):195-8.
- Verma A, Dixit R, Singh UP, Soni S, Mishra AK, Bansal AK, et al. Preparation and Characterization of Gellan-Chitosan polyelectrolyte complex beads. Lat Am J Pharm2011;30:1186-95.
- Mohanraj V, Chen Y. Nanoparticles-a review. Trop J PharmRes 2006;5(1):561-73.
- Muller R, Wallis K. Surface modification of i.v. injectable biodegradable nanoparticles with poloxamer polymers and poloxamine 908. Int. J Pharm 1993;89(1):25-31.
- Gref R, Quellec P, Perrin L, Dellacherie E, Sommer F, Verbavatz JM, et al. Protein encapsulation within polyethylene glycol-coated nanospheres I Physicochemical characterization. J Biomed Mater Res 1998;42(1):45-54.
- Chavanpatil MD, Khdair A, Patil Y, Handa H, Mao G, Panyam J. Polymer-surfactant nanoparticles for sustained release of water-soluble drugs. J Pharm Sci2007;96:3379-89.
- Palaniappan R. Gellan-gum nanoparticles and methods of making and using the same. U.S. Pat. 8389012 B2. 2013.
- Mallick S. Effect of solvent and polymer additives on crystallization. Indian J Pharm Sci 2004;66(2):142-7.
- Ubrich N, Lamprecht A, Perez MH, Lehr CM, Hoffman M, Maincent P. Influences of process parameters on nanoparticle preparation performed by a double emulsion pressure homogenization technique. Int J of Pharm 2000;196(2):177-82.
- Costa P, Sousa Lobo JM. Modeling and comparison of dissolution profiles. Eur J Pharm Sci 2001;13(2):123-33.
- Gouda R, Baishya H, Qing Z .Application of Mathematical Models in Drug Release Kinetics of Carbidopa and Levodopa ER Tablets. J Develop Drugs 2017;6(2):171.
- Singhvi G, Singh M. In vitro drug release characterization models. Int J Pharm Stud Res 2011;2(1):77-84.
- Brahmankar DM, Jaiswal SB. Biopharmaceutics and pharmacokinetics-A Treatise,3rd ed. New Delhi: Vallabh Prakashan; 2005.
