- *Corresponding Author:
- Ashwini R. Madgulkar
AISSMS College of Pharmacy, Kennedy Road, Near RTO, Pune-411 001, India
E-mail: ashwini.madgulkar@indiatimes.com
| Date of Submission | 01 August 2008 |
| Date of Decision | 10 July 2009 |
| Date of Acceptance | 14 July 2009 |
| Indian J Pharm Sci, 2009, 71 (4): 387-394 |
Abstract
The aim of the current study was to design sustained release matrix tablets of venlafaxine hydrochloride using ion exchange resin with the incorporation of hydrophilic and hydrophobic polymer combinations. Venlafaxine HCl was loaded onto Indion 244 by batch method and then resinate were wet granulated with ethyl cellulose and blended with hydroxypropylmethylcellulose and compressed. A central composite design for 2 factors at 3 levels each was employed to systematically optimize drug release profile at 2 h and at 18 h. Hydroxypropylmethylcellulose and ethylcellulose were taken as the independent variables. Response surface plots and contour plots were drawn, and optimum formulations were selected by feasibility and grid searches. Resinate shows inadequate sustained release profile. Compressed matrices exhibited the anomalous release mechanism, as the value of release rate exponent (n) varied between 08109 and 08719, resulting in regulated and complete release until 20 h. Validation of optimization study, performed using five confirmatory runs, indicated very high degree of prognostic ability of response surface methodology, with mean percentage error as 1.152±1.88%. Regulated drug release study indicates that the hydrophilic and hydrophobic matrix tablets of venlafaxine resinate prepared using hydroxypropylmethylcellulose and ethylcellulose, can successfully be employed as a once-a-day oral controlled release drug delivery system.
Keywords
Venlafaxine hydrochloride, ion exchange resin, sustained release, matrix, factorial design, optimization, response surface methodology
Venlafaxine is a unique antidepressant that differs structurally from other currently available antidepressant [1]. Venlafaxine and its active metabolite, o-desmethylvenlafaxine, inhibit the neuronal uptake of norepinephrine, serotonin and to a lesser extent dopamine [2,3], but have no monoamine oxidase inhibitory activity and a low affinity for brain muscarinic, cholinergic, histaminergic or alpha adrenergic receptors [4,5]. Hence, it lacks the adverse anticholinergic, sedative and cardiovascular effects of tricyclic antidepressants. The steady state half lives of venlafaxine and ODV are 5 h and 11 h, respectively, necessitating the administration, 2 or 3 times daily so as to maintain adequate plasma levels of drug [6].
The present research was directed towards the development of sustained release dosage form of venlafaxine HCl using ion exchange resin with incorporation of polymer matrix Indion 244 IER and different polymers such as hydroxylpropylmethylcellulose (HPMC) K 15 M and ethylcellulose (EC) 7 cps were used. Indion 244 is a strong cation exchange resin with SO3 -H+ functionality which exchanges cations stoichiometrically in an equilibrium driven reaction. Due to the presence of SO3 -H+ group Indion 244 shows ionization at all body pH values. However simple drug-resin complexes may not satisfy the requirement of sustained release, in such cases resinates are incorporated into the matrix systems, microencapsulated or coated.
HPMC is mixed alkyl hydroxypropylcellulose ether containing methoxyl and hydroxypropyl groups. The hydration rate of HPMC depends on the nature of these substituents HPMC-tablets hydrate upon contact with water and a rate-controlling gel layer forms around a solid inner core. A rapid formation of the gel layer is a prerequisite for the retardation of the drug release; otherwise, hydrophilic drugs would be released rapidly [7].
Response surface methodology (RSM) is a widely practiced approach in the development and optimization of drug delivery devices [8-12]. Based on the principle of design of experiments (DOE), the methodology encompasses the use of various types of experimental designs, generation of polynomial equations, and mapping of the response over the experimental domain to determine the optimum formulation(s) [10-12]. The technique requires minimum experimentation and time, thus proving to be far more effective and cost-effective than the conventional methods of formulating dosage forms. The tablets incorporating resinate into HPMC matrix were developed employing 32 factorial design, employing concentration of ethyl cellulose 7 cps and HPMC K15M as factors, release at 2 h and release at 18 h as response.
Material and Methods
Venlafaxine HCl was obtained from Lupin Research Park, Pune. Indion 244 was provided by Ion Exchange India, Mumbai. HPMC K15M and EC 7cps were obtained as gift samples from M/s Colorcon Asia Pvt Ltd, Mumbai, India.
Preparation and evaluation of venlafaxine HClresin complex (DRC)
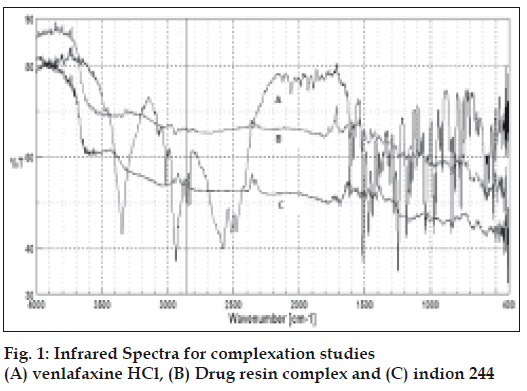
Resinate was prepared by batch process [13]. An accurately weighed amount of venlafaxine HCl (1 g) was taken and dissolved in 100 ml of deionised water. A known weight of Indion 244 was added to the same and was stirred on a magnetic stirrer. Time to reach equilibrium was determined by periodically measuring concentration of the drug in solution spectrophotometrically. Resinate thus formed was filtered and washed with deionised water. It was then dried at 50°. The amount of drug loaded on the resin was obtained by subtracting the remaining amount of drug in the final filtrate from initial amount. FT-IR studies were carried out on drug, resin and resinate to determine the formation of complex of drug and resin.
In vitro drug release studies
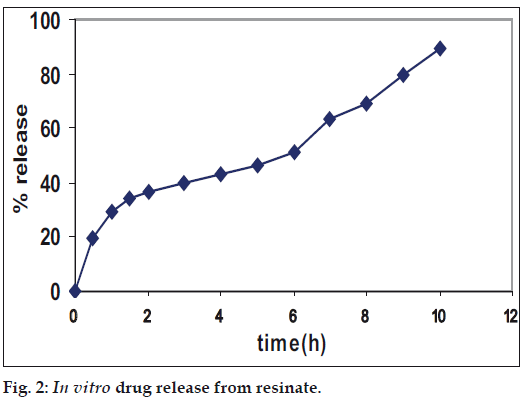
DRC of drug was subjected to in vitro dissolution studies in phosphate buffer (pH 7.2, 900 ml, 37°±0.5°) using USP dissolution apparatus type 2 (paddle type, 100 rpm). An accurately weighed (75 mg drug equivalent) DRC were taken in dissolution medium. Dissolution studies were carried out using conditions mentioned above. At regular time interval aliquots of dissolution medium (10 ml) were taken, filtered and absorbance was measured by UV spectroscopy. The medium was replaced with equal volume of fresh dissolution fluid.
Effect of pH on drug release from DRC
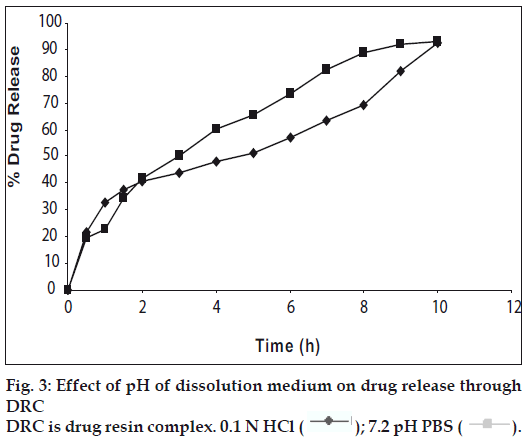
A claimed advantage of ion exchange delivery system is that release of drug is independent of pH of the dissolution medium. This prospect was investigated by preparing buffer solutions of different pH (1.2, and 7.2) with ionic strength adjusted to μ ≅ 0.2 using NaCl. In vitro release drug resinate was carried out at these pH, using conditions described earlier.
Formulation of matrix tablets using 32 factorial design
Composition of different formulations as per Table 1 prepared using varying amounts of the polymers. The preparation process involved two steps first DRC were wet granulated with EC using PVP K30 in isopropyl alcohol as a granulating agent. The granules were dried at 60° and pass the granules through 30#. Second step involves blending of granules with HPMC and dicalcium phosphate. Then granules were lubricated with magnesium stearate. The tablets were compressed into flat-faced punches of 8 mm diameter using Rimek Mini Press-II MT tablet compression machine.
| Ingredients | Quantity (mg) |
|---|---|
| DRC | Equivalent to 75 mg of drug |
| Ethylcellulose 7 cps | 41.62-124.86 |
| Hydroxypropylmethylcellulose K 15M | 41.62-124.86 |
| Magnessium stearate | 4.5 |
| Di calcium phosphate | q.s. to make 450 |
*DRC= drug-resin complex, q.s.= quantity sufficient.
Table 1: Composition of venlafaxine HCL sustained release hydrophilic and hydrophobic compressed matrices.
Experimental design
A 3-level full factorial design comprising 9 full factorial design points was applied as shown in Table 2. This design generally involves dependent variables Y and independent or controlled variables X1, X2. The two independent formulation variables selected for this study were X1, HPMC K 15 M; X2, EC 7 cps. The levels of independent variables are shown in Table 2. The dependent variables were Y1,% of drug released at 2 h; Y2, % of drug released release at 18 h.
| Trial No. | Coded Factor Levels | |
|---|---|---|
| X1 | X2 | |
| F1 | -1 | -1 |
| F2 | -1 | 0 |
| F3 | -1 | 1 |
| F4 | 0 | -1 |
| F5 | 0 | 0 |
| F6 | 0 | 1 |
| F7 | 1 | -1 |
| F8 | 1 | 0 |
| F9 | 1 | 1 |
F1-F9: Codes for 9 formulations designed by factorial design, Coded levels for X1: HPMC in mg -1 is 41.62, 0 is 83.24 and 1 is 124.86 and for X2: Ethyl cellulose in mg are -1 is 41.62, 0 is 83.24 and 1 is 124.86.
Table 2: 32 full factorial experimental design layout.
Tablet assay and physical evaluation
Drug content of all the batches was determined. For this purpose ten tablets were weighed and crushed in a small glass mortar with pestle. The fine powder was weighed to get 100 mg equivalent of venlafaxine HCl, and transferred to 250 ml conical flask containing 100 ml of 1N HCl and stirred for 4 h on magnetic stirrer. Dispersion was filtered and the filtrates obtained were analyzed spectrophotometrically. Tablets were also evaluated for uniformity of weight and thickness. Tablets were examined for friability using a Roche type friabilator and hardness using a Monsanto type hardness tester.
In Vitro dissolution studies
In vitro dissolution study of tablets performed using USP 24 type II dissolution apparatus (37±0.5°, 900 ml, 100 rpm) in phosphate buffer pH 7.2 for a period of 24 h. Aliquots were taken out at 0.5, 1.0, 1.5 and 2 h, and thereafter every hour for 24 h and the volume was replaced with an equivalent amount of aliquots of fresh dissolution medium. The samples withdrawn were analyzed. In vitro release of formulation was calculated using PCP Disso software (PCPD V 208). The computed values of kinetic constant (k) and diffusional release exponent (n) were determined.
Optimization data analysis
Various RSM computations for the current optimization study using RSM were carried out, employing software, State Ease Design Expert Version 7. Polynomial model including interaction and polynomial terms were generated for all the response variables. To investigate the influence of polymers on release pattern, a two way analysis of variance (ANOVA) based factorial analysis followed by several one way ANOVA. The general form of the model is represented as in Eqn. 1, Y=β0+β1X1+β2X2+β3X1X2+β4X21+β5X22+β6X1X22+β7X21X2+β8X21X22--(1),where β0 the intercept, is the arithmetic average of all quantitative outcomes of nine runs, β1 to β8 are the coefficients from the observed experimental values of Y. While X1 and X2 are the coded levels of the independent variable(s). The terms X1 X2 and X2i (i=1, 2) are the interaction and polynomial terms, respectively. The stastical validity of the polynomials was established on the basis of Yates ANOVA. Subsequently, feasibility as well a grid search was performed to locate the composition of optimum formulations [14-18]. Also, three dimensional response surface graphs and contour plots were drawn in MSExcel using the output files generated by the State Ease Design Expert Version-7 software.
Five optimum formulations were selected by intensive search, performed over the entire experimental domain, to validate the chosen experimental design and polynomial equations. The criterion for selection of optimum was primarily based on the desired values of the response parameters, i.e. release at 2 h and release at 18 h. The formulations corresponding to this optimum were prepared and evaluated for various response properties. Resultant experimental data was quantitatively compared with predicted values and linear regression plots was obtained using MS-Excel, forcing the line through origin.
Results and Discussion
Time to reach ion exchange equilibrium was found to be 4 h. The IR showed in fig. 1 confirms the complex formation between drug and resin. The peaks representing amino group of the drug (3349 cm-1) and the peak at 2900 cm−1 corresponding to –OH stretching in drug are absent in DRC, which signifies that during DRC formation there was interaction of the amino group of drug with the sulfonic group of resin.
In vitro dissolution from DRC showed inadequately sustained release (fig. 2). Sustained release pattern occurs due to the drug resin complex. In the dissolution medium the drug was then replaced by the counter ions of the dissolution medium. DRC showed inadequately sustained release. Hence to further prolong the release it was decided after preliminary studies to granulate resinate with ethyl cellulose and incorporation into HPMC matrix.
Studies carried out to establish effect of pH of dissolution medium onto drug release through the DRC showed no significant effect of pH on drug release through DRC (fig. 3). The assay content of venlafaxine HCl varied between 98.0 and 99.8%. Tablets weights varied between 448 and 452 mg, thickness between 4.5 to 6.5 mm, and hardness between 8.0 and 9.0 kg/cm2 and friability ranged between 0.3 and 0.6%.
Table 3 lists various dissolution kinetics parameters computed for all nine batches. In our experiments, the in vitro release profiles of the drug from all the formulations could be best expressed by Peppas Eqn. When plotted according to Korsmeyer’s Eqn, formulations also showed high linearity (R2: 0.9985), with a comparatively high slope (n) value of ranging from 0.4381 to 0.9119. This n value, however, appears to indicate a coupling of diffusion and erosion mechanisms so called anomalous diffusion. The relative complexity of this formulation and its components may indicate that the drug release is controlled by more than one process. The values of n show increasing trend with increase in HPMC content, even at higher EC levels.
| Trial no | HPMC (mg) | EC (mg) | K | n | Release 2 h | Release 18 h | r2 |
|---|---|---|---|---|---|---|---|
| F1 | 41.62 | 41.62 | 26.84 | 0.4381 | 38.97 | 95.35 | 0.9066 |
| F2 | 41.62 | 83.24 | 15.27 | 0.6250 | 30.97 | 89.93 | 0.9499 |
| F3 | 41.62 | 124.86 | 15.12 | 0.5098 | 33.47 | 87.69 | 0.9678 |
| F4 | 83.24 | 41.62 | 5.50 | 0.9119 | 13.21 | 86.54 | 0.9700 |
| F5 | 83.24 | 83.24 | 6.67 | 0.7820 | 14.30 | 83.18 | 0.9882 |
| F6 | 83.24 | 124.86 | 7.78 | 0.7734 | 16.33 | 88.51 | 0.9883 |
| F7 | 124.86 | 41.62 | 5.71 | 0.8653 | 11.99 | 82.55 | 0.9893 |
| F8 | 124.86 | 83.24 | 8.53 | 0.7328 | 16.57 | 80.85 | 0.9766 |
| F9 | 124.86 | 124.86 | 8.53 | 0.7328 | 18.09 | 82.22 | 0.9743 |
F1-F9: Nine formulations designed by factorial designs, HPMC= hydroxypropylmethylcellulose, EC= ethylcellulose, K= kinetic constant, n= diffusion coefficient, r2= coefficient of determination.
Table 3: Dissolution parameters for all sustained release formulation prepared as per 32 factorial design.
Further, value of kinetic constant (k) ranged between 5.50 and 26.84. The values of release after 2 h varied between 11.99 and 38.97, and release after 18 h found between 80.85 and 95.35. HPMC K 15 M was used as a hydrophilic matrimixing agent because it forms a strong viscous gel on contact with aqueous media, which could be useful in controlling delivery of highly water soluble drugs [19]. HPMC tablets were able to sustain the drug release alone but could not control the initial release i.e. release is more than 20% in the initial 2 h. Faster release of drug from the hydrophilic matrix was probably due to the faster dissolution of the highly water soluble drugs from the core and its diffusion out of the matrix forming the pores for entry of solvent molecules. Incorporation of ethylcellulose was found to control the drug release to some extent, which could be attributed to the decreased penetration of the solvent molecules in the presence of hydrophobic polymer leading to decreased diffusion of the drug from the matrix.
The drug release from cellulose ether matrix tablets can be controlled by the type of polymer and its molecular weight [19]. When EC and HPMC are combined, the hydrophobic interaction of EC retarded the water uptake while HPMC contributed by absorbing water to swell. As a result tablet swells initially and then erode, so that initial release is controlled [20].
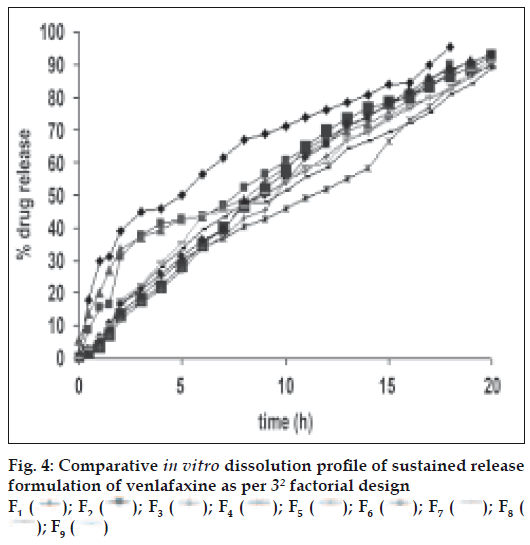
At lowest concentrations of the HPMC and EC, compressed matrices showed increased drug release in the initial 2 h as shown in fig. 4. This is due to decrease in hydrated gel layer formation, but at the high concentration of HPMC and EC initially tablet shows increased in the diffusion layer formation probably due to the increased concentration of HPMC followed by erosion of tablet was observed.
An increase in the amount of polymer will decrease the drug release. Sustained drug release was seen with the highest levels of the two polymers. Application of two-way ANOVA based factorial analysis indicated that the polymers had a significant influence on the initial release of drug within 2 h from the compressed matrices (P<0.05). Subsequent application of one-way ANOVA, keeping the levels of one of the polymers fixed, also showed a statastically significant difference amongst the observed data of dissolution (P<0.05), ratifying the significant positive influence of each polymer on dissolution.
The mathematical relationships constructed for the studied response variables are expressed as Eqns. 2 and 3. All the polynomial equations were found to be statistically significant (P<0.05), as determined by ANOVA;
Release at 2 h= 22.84-9.16X1+3.40X2- 0.42Y1+0.11Y2+4.83 X1Y1-1.06 X2Y1-0.64 X1Y2-0.034 X2Y2--(2), Release at 18 h= 87.49-3.33X1-0.45X2- 1.35X2Y1+0.43Y2+2.11X1Y1-1.25X2Y1+ 0.31X1Y2- 0.37X2Y2 --(3)
The polynomial equations comprise the coefficients for intercept, first-order main effects, interaction terms, and higher-order effects. The sign and magnitude of the main effects signify the relative influence of each factor on the response. At a given set of factor levels, however, these higher-order polynomials yield results as the net effect of all the coefficient terms contained in the polynomial.
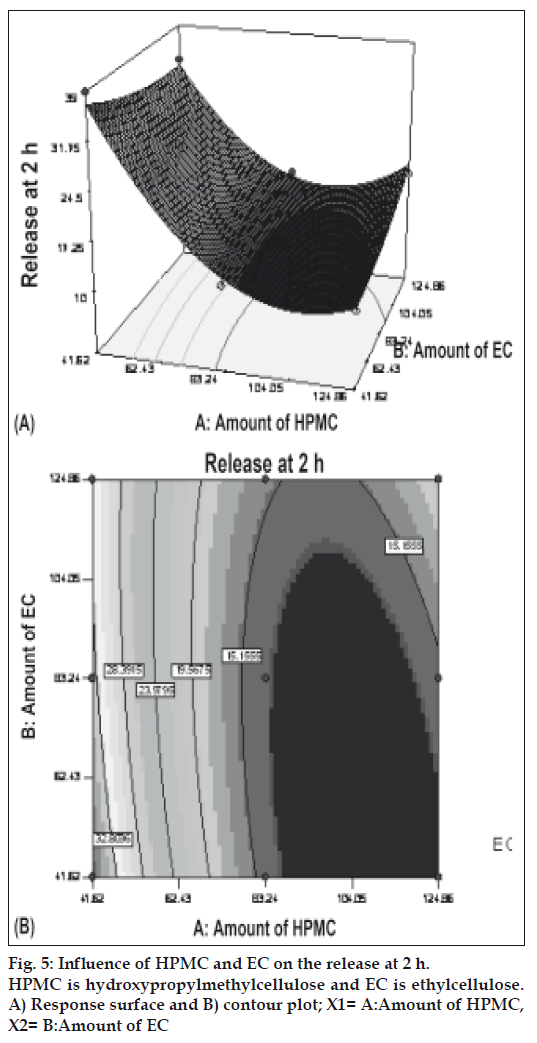
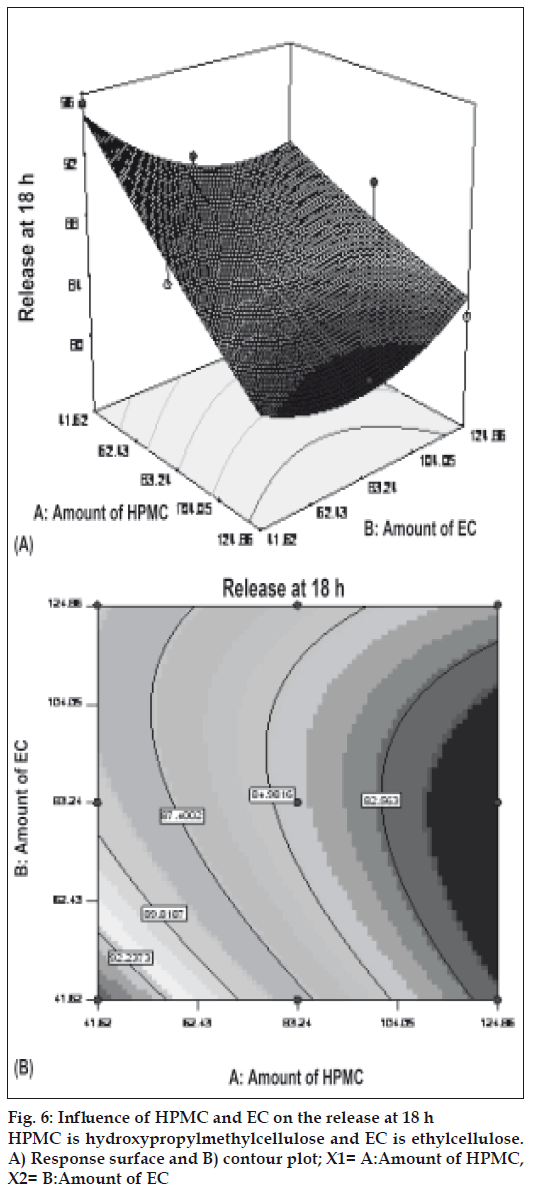
Figs. 5 and 6 portray the 3 dimensional response surface plots and the corresponding contour plots for the studied response properties viz rel2h and rel18h, respectively. Fig. 5, shows that release after 2 h varies in a nearly linear descending pattern with a change in the amount of polymers. Fig. 6 also exhibits a near linear trend of release after 18 h, but in ascending order. As there is no confounding of the contour lines in figs. 5 or 6, both the polymers seem to contribute independently towards drug release. For all of the 5 checkpoint formulations, the results of the dissolution parameters showed in Table 4. Table 5 lists the compositions of the checkpoints, their predicted and experimental values of all the response variables, and the percentage error in prognosis.
| Formulation Code | HPMC (mg) | EC (mg) | K | n | r2 | Release 2 h | Release 18 h |
|---|---|---|---|---|---|---|---|
| O1 | 99.88 | 41.62 | 8.7519 | 0.8109 | 0.9972 | 18.02 | 86.92 |
| O2 | 101.96 | 46.81 | 8.0564 | 0.8314 | 0.9974 | 17.94 | 86.55 |
| O3 | 105.08 | 47.86 | 8.5724 | 0.8229 | 0.9973 | 16.32 | 86.23 |
| O4 | 106.13 | 49.94 | 8.1089 | 0.8327 | 0.9978 | 16.88 | 85.98 |
| O5 | 108.21 | 45.78 | 6.9683 | 0.8719 | 0.9985 | 16.26 | 85.64 |
O1-O5= Codes for optimized formulations, HPMC= hydroxypropylmethylcellulose, EC= ethylcellulose, K= kinetic constant, n= diffusion coefficient, r2= coefficient of determination.
Table 4: Dissolution Parameters of Five Optimum Formulations
| Formulation Code | Formulation CompositionHPMC/EC (mg) | ResponseProperty | Experimental Value | PredictedValue | PercentageError | |
|---|---|---|---|---|---|---|
| O1 | 99.88/41.62 | % Release 2 h | 18.02 | 18.22 | -1.560 | |
| % Release 18 h | 86.92 | 87.18 | -0.299 | |||
| O2 | 101.96/46.81 | % Release 2 h | 17.94 | 17.91 | 0.610 | |
| % Release 18 h | 86.55 | 86.81 | 1.151 | |||
| O3 | 105.08/47.86 | % Release 2 h | 16.32 | 16.96 | -3.921 | |
| % Release 18 h | 86.23 | 86.59 | -0.417 | |||
| O4 | 106.13/49.94 | % Release 2 h | 16.88 | 17.07 | -4.852 | |
| % Release 18 h | 85.98 | 86.34 | -0.453 | |||
| O5 | 108.21/45.78 | % Release 2 h | 16.26 | 16.44 | -1.107 | |
| % Release 18 h | 85.64 | 86.22 | -0.677 | |||
| Mean (±SD) of % error | -1.152±1.88 | |||||
O1-O5= Codes for optimized formulations, HPMC= hydroxypropylmethylcellulose, EC= ethylcellulose.
Table 5: Experimentally Observed Response Parameters of Five Optimum Formulation and Comparison with Predicted Values for Validation of RSM
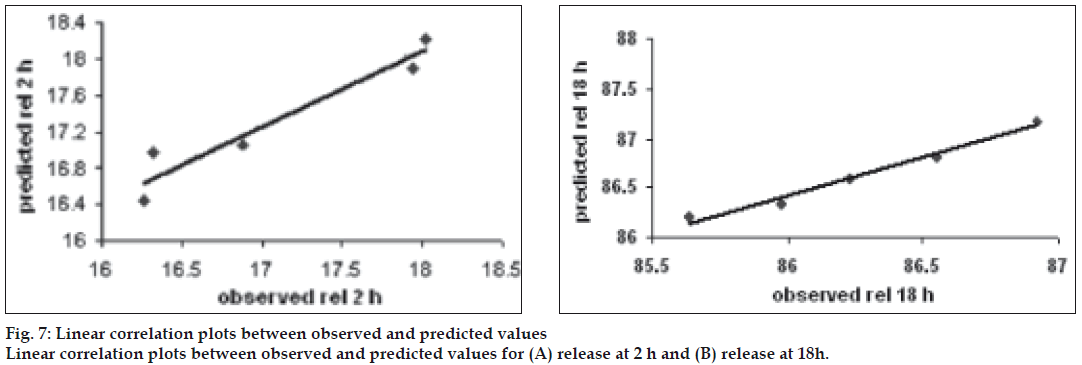
Fig. 7 showed linear correlation plots between the observed and predicted response variables. The predicted error for the response variables ranged between -4.852% and 1.151%, with the mean±standard deviation of the percentage error being –1.152±1.88%. Also, the linear plots drawn between the predicted and observed responses for release at 2 h and release at 18 h demonstrated high of r2 0.9296 and 0.9765, respectively (fig. 7), indicating excellent goodness of fit. Thus, the low magnitudes of error, as well as the significant values of r2, designate a high prognostic ability of RSM.
Regulated drug release study indicates that the hydrophilic and hydrophobic matrix tablets of venlafaxine, prepared using HPMC and EC, can successfully be employed as a once-a-day oral controlled release drug delivery system. Both the polymers could extent the drug release upto 20 h so it helps to achieve the low plasma concentration to reduce side effects. However, appropriate balancing between various levels of the 2 polymers is imperative to acquire proper sustained release. High degree of prognosis obtained using RSM corroborates that a 2-factor CCD is quite efficient in optimizing drug delivery systems that exhibit nonlinearity in response(s).
Acknowledgements
Authors are thankful to Dr. K. G. Bothara, Principal, AISSMS College of Pharmacy, Pune, India, for providing the facilities for completion of this research work. The authors are also thankful to Lupin Research Park, Pune, Ion Exchange India, Mumbai, and M/s Colorcon Asia Pvt Ltd, India for the gift sample of Venlafaxine HCl, Indion 244, and Hydroxypropylmethycellulose, Ethyl Cellulose respectively.
References
- Holliday SM, Benfield P. Venlafaxine: A review of its pharmacology and therapeutic potential in depression drugs. Drugs 1995;49:280–94.
- Haskins JT, Moyer JA, Muth EA, Sigg EB. Inhibition of noradrenergic neuronal activity by the novel bicyclic compounds, Wy-45,030 and Wy-45,881. SocNeurosciAbstr 1984;10:262.
- Muth EA, Moyer JA, Haskins JT, Andree TH, Husbands GEM, Biochemical, neurophysiological and behavioural effects of Wy-45,233, its enantiomers and other identified metabolites of the antidepressant venlafaxine. Drug Dev Res 1991;23:191–9.
- Cusack B, Nelson A, Richelson E. Binding of antidepressants to human brain receptors: focus on newer generation Compounds. Psychopharmacology 1994;114:559–65.
- Muth EA, Haskins JT, Moyer JA, Husbands GE. Antidepressant biochemical profile of the novel bicyclic compound Wy-45,030, an ether cyclohexanol derivative. BiochemPharmacol 1986;35:4493-7.
- Troy SM, Parker VD, Fruncillo RJ, Chiang ST. The pharmacokinetics of venlafaxine when given in a twice-daily regimen. J ClinPharmacol 1995;35:404-9.
- Conte U, Maggi L, Colombo P, La Manna A. Multi-layered hydrophilic matrices as constant release device (geomatrix systems). J Control Release 1993;26:39-47.
- Dave BS, Amin AF, Patel MM. Gastroretentive drug delivery system of ranitidine hydrochloride: formulation and in vitro evaluation. AAPS PharmSciTech 2004;5:E34.
- Singh B, Kumar R, Ahuja N. Optimizing drug delivery systems using systematic design of experiments Part I: Fundamental aspects. Crit Rev Ther Drug Carrier Syst 2005;22:27-105.
- Singh B, Ahuja N. Book review on Pharmaceutical Experimental Design. Int J Pharm 2000;195:247-8.
- Singh B, Dahiya M, Saharan V, Ahuja N. Optimizing drug delivery systems using systematic design of experiments: Part II: Retrospect and prospects. Crit Rev Ther Drug Carrier Syst 2005;22:215-93.
- Singh B, Mehta G, Kumar R, Bhatia A, Ahuja N, Katare OP. Design, development and optimization of nimesulide-loaded liposomal systems for topical application. Curr Drug Deliv 2005;2:143-53.
- Borodkin S. Ion exchange resins and sustained release. In: Swarbric J, Boylan J, editors. Encyclopedia of Pharmaceutical Technology. Vol. 8. New York: Marcel Dekker Inc; 1992. p. 211.
- Singh B, Ahuja N. Response surface optimization of drug delivery system. In: Jain NK, editor. Progress in controlled and novel drug delivery systems. 1st ed. New Delhi: CBS Publishers and Distributors; 2004. p. 470-9.
- Singh B, Singh S. A comprehensive computer program for the study of drug release kinetics from compressed matrices. Indian J Pharm Sci 1998;60:358-62.
- Peppas NA, Sahlin JJ. A simple equation for the description of solute release: III: Coupling of diffusion and relaxation. Int J Pharm 1989; 57:169-72.
- Peppas NA. Analysis of Fickian and non-Fickian drug release from polymers. Pharm ActaHelv1985;60:110-1.
- Singh B, Ahuja N. Development of controlled-release buccoadhesive hydrophilic matrices of diltiazem hydrochloride: Optimization of bioadhesion, dissolution, and diffusion parameters. Drug Develop Ind Pharm 2002;28:431-42.
- Sriwongjanya M, Bodmeier R. Effect of ion exchange resin on the drug release from matrix tablets. Eur J Pharm Biopharm 1998;46:321-7.
- Reddy RK, Srinivas M, Reddy S. Once-daily sustained-release matrix tablets of nicorandil: formulation and in vitro evaluation. AAPS Pharm Sci Tech 2003;4:Article 61.
 ); 7.2 pH PBS (
  ).
).