- *Corresponding Author:
- Y. Gvozdeva
Department of Pharmaceutical Sciences, Research Institute, Medical University of Plovdiv, Plovdiv 4000, Bulgaria
E-mail: yana.gvozdeva@mu-plovdiv.bg
| Date of Received | 26 February 2020 |
| Date of Revision | 18 April 2022 |
| Date of Acceptance | 21 November 2022 |
| Indian J Pharm Sci 2022;84(6):1407-1416 |
This is an open access article distributed under the terms of the Creative Commons Attribution-NonCommercial-ShareAlike 3.0 License, which allows others to remix, tweak, and build upon the work non-commercially, as long as the author is credited and the new creations are licensed under the identical terms
Abstract
The aim of the present study was to formulate polymer microspheres using the emulsion solvent evaporation technique as an approach to mask the bitter taste of enalapril maleate. Five models were prepared with two water-insoluble polymers. Talc was used to stabilize the particle structure. Production yields ranged from 38 % to 53 %; drug loading varied between 17 % and 40 %; the mean particle size ranged from 140 μm to 339 μm. No interaction between enalapril and the polymers was estimated. A drug release study in artificial saliva indicated a negligible amount of enalapril dissolved in the test medium which demonstrated successful taste masking.
Keywords
SEnalapril maleate, taste masking, emulsion solvent evaporation technique, ethylcellulose, EUDRAGIT EPO®
The population of developed countries is facing a serious problem of pediatric hypertension, which, along with childhood obesity, is gaining epidemic proportions globally. The diagnosis and treatment of hypertension in children are crucial to prevent its chronicity and the development of hypertension in adults[1]. The choice of an antihypertensive drug depends on the age of the child, as well as concomitant diseases. Angiotensin Converting Enzyme (ACE) inhibitors are the first choice in the treatment of childhood hypertension. They affect the renin-angiotensin system and have been successfully used for many years in cardiovascular diseases in adolescent patients[2]. A frequently prescribed ACE inhibitor for children hypertension is Enalapril Maleate (ENA). Moreover, ENA has been successfully used in the treatment of congestive heart failure in children[2]. There is currently no suitable ENA formulation for children worldwide other than conventional tablets, except for Epaned® oral solution, which is only approved in the United States[3]. However, ENA is bitter in taste, which makes it a real challenge to formulate an acceptable dosage form for children[4]. Pharmaceutical technology is evolving in the direction of taste masking of active pharmaceutical ingredients. Taste masking results not only in concealed unpleasant taste of drugs, but also in improved therapeutic efficacy and bioavailability, enhanced drug stability, better organoleptic properties of the drug and increased patient adherence[5]. There are many approaches for masking the bitter or unpleasant taste of drugs, most of which have been extensively studied in our research group and satisfactory results have been achieved[6,7].
The emulsion solvent evaporation technique was fully developed in the late 1970s and has been successfully applied to the preparation of microspheres with various polymers and drugs[8]. The method is convenient, without the need of expensive equipment as in spray drying. For oilin- water (O/W) emulsion preparation, the polymer is usually dissolved in an organic solvent and the drug is dissolved or dispersed. The size and the shape of the particles depend on the emulsifier concentration, stirring rate and the volume of the organic phase[9]. Successful microencapsulation of lipid-soluble drugs such as steroids[10], topical anesthetics[11], bleomycin sulfate[12], doxorubicin[13], naltrexone, and promethazine[14] has been reported. A major drawback of the method is the low efficiency of incorporation of water-soluble substances and the right choice of polymer is very important[15]. Water-in-oil emulsions are more suitable for microencapsulation of water-soluble drugs. The polymer and the drug are dissolved in a polar solvent. The parameters monitored here are emulsifier concentration, agitation rate and volume of media[16]. The main goal of this work was to obtain taste-masked ENA-loaded microparticles for pediatric use.
Materials and Methods
ENA, Tween 20®, talc, acetone and dichloromethane were purchased from Alfa Aesar, Germany. Ethylcellulose (viscosity 100 cP) was bought from Sigma- Aldrich, USA. EUDRAGIT EPO® was a gift from Evonik, Germany. Sodium chloride (NaCl), Hydrochloric acid (HCl), Disodium hydrogen phosphate (Na2HPO4) and Potassium dihydrogen phosphate (KH2PO4) were purchased from Sigma- Aldrich, USA and were used for the preparation of the simulated saliva and simulated gastric juice.
Preparation of ENA loaded microparticles:
For the study emulsion solvent evaporation method was used and O/W emulsion was prepared. The polymers solution and ENA solution were prepared separately and then mixed. For the preparation of the polymer solution a certain amount of EUDRAGIT EPO® and ethylcellulose were dissolved in 10 ml dichloromethane. For the preparation of the drug solution, ENA was dissolved into a mixture of 7 ml of dichloromethane and 1 ml of acetone. ENA solution was added to the polymer solution. Talc (50 % of the amount of EUDRAGIT EPO®) was added to the drug-polymer solution and the suspension (the oily phase) was added dropwise to the aqueous phase. The aqueous phase consisted of distilled water and a hydrophilic emulsifier-Tween 20® (polysorbate 20). The O/W emulsion was stirred at room temperature for 6 h until complete evaporation of the organic solvents and solidification of the microparticles. The resultant particles were removed by vacuum filtration (Nylon 66 membrane filter, 0.45 μm, Sigma-Aldrich, USA), washed with distilled water and allowed to dry at room temperature for 24 h. Five models were developed at varied drug-polymer ratio and emulsifier concentration.
Yield:
Production yields of the particles were calculated using the equation:
Yield (%)=(A3/(A1+A2))×100,
where A1: Amount of ENA, A2: Amount of the polymer and A3: Weight of the obtained particles.
Drug loading:
The Drug Loading (DL %) was determined using the following equation:
DL (%)=(A4/10)×100,
where A4: Amount (mg) of ENA encapsulated into 10 mg of particles.
The study was carried out as follows: 10 mg particles of each model were dissolved in 10 ml of 96 % ethanol and stirred on a magnetic stirrer at 300 rpm for 2 h. 1 ml of the sample was diluted with 9 ml of simulated gastric juice without enzymes (pH 1.2). The obtained solution was filtered through a Whatman filter with a pore size of 0.45 μm. The sample was analyzed spectrophotometrically using an Evolution 300 Ultra Violet-Visible (UV/VIS) spectrometer (Thermo Fisher Scientific, USA). The absorbance of the sample was measured at 206 nm and the amount of ENA was calculated according to a calibration curve.
Drug Encapsulation Efficiency:
The DEE % was calculated by the following equation:
DEE %=(A5/A1)×100,
Where A5: Amount (mg) of ENA encapsulated in the particles and A1: Amount of ENA used for the preparation of the particles.
Shape and surface morphology of the obtained particles:
The surface morphology of the obtained microparticles was determined using a Zeiss EVO LS25 scanning electron microscope (Zeiss, Germany) at an accelerating voltage of 20 kV and magnification 5000x.
Particle size distribution:
Mean particle size and particle size distribution were determined using LS 13 320 Beckman coulter particle size analyzer (Beckman Coulter, USA), equipped with a Tornado Dry Powder System (DPS).
Infrared spectroscopy:
A Nicolet iS10 Fourier Transform Infrared (FTIR) spectrometer (Thermo Fisher Scientific, USA), equipped with an Attenuated Total Reflection (ATR) accessory for full internal Reflection (iTR) was used. The study was performed under the following conditions: 64 scans, 4 nm resolution, 4000-400 cm-1 spectral range. The spectra of the pure substances, physical mixtures and the obtained particles were analyzed.
Powder X-ray diffraction:
A D2 Phaser powder X-ray diffractometer (Bruker AXS, Karlsruhe, Germany) was used to determine the physical state of ENA and polymers in the particles. The spectra were obtained using Ni-filtered Cu-radiation in the range of 4-60° 2-θ at 30 kV and 10 mA.
Thermal analysis (TG-DTA):
A Stanton Redcroft STA 1500 thermal imaging apparatus (Thermal Scientific Plc., GB) was used to detect temperature changes of ENA and polymer in the particles. The samples were analyzed in the temperature range of 25 to 600° at a heating rate of 10° per min under an argon atmosphere.
In vitro taste evaluation:
To assess the degree of taste masking of the obtained particles in vitro, the following method was used; 10 mg of particles were placed in 50 ml of simulated saliva (phosphate buffer pH 6.8 without enzymes) and stirred at 200 rpm on an electromagnetic stirrer for 60 s. Afterwards, the samples were filtered using a Whatman filter with a pore size of 0.45 μm and the absorption at 206 nm was measured. The concentration of ENA was calculated using a calibration curve. The released drug from each sample was assessed in triplicate and reported as a mean±standard deviation.
In vitro drug release in artificial gastric juice without enzymes:
The study was performed in Apparatus 1 with a rotating basket (Ph. Eur.9 2.9.3, apparatus AT7 Sotax, Allschwil, Switzerland) in an acceptor medium (artificial gastric juice pH 1.2) with a volume of 500 ml at a temperature of 37°±0.5° and stirring speed of 50 rpm. The tested samples of polymer microparticles were placed in a dialysis bag (Sigma, MWCO 12000 Da) with dimensions of 6/2.5 cm. It was soaked for 24 h in artificial gastric juice with a pH of 1.2. An amount of microparticles of models EMS3 and EMS5, corresponding to 5 mg ENA, was placed in a dialysis bag to which 1 ml of the medium was added. At selected time intervals determined experimentally, 2 ml samples were taken and the same amount of medium was recovered. The samples were filtered through a filter with a pore diameter of 0.45 μm. The absorbance of the filtrate was measured at 206 nm with a UV-VIS Spectrophotometer Thermo Evolution 300 (Thermo Fisher Scientific, USA) according to a developed spectrophotometric method.
Results and Discussion
For the preparation of microparticles emulsion solvent evaporation technique was applied. The use of magnesium stearate, talc or colloidal silica as an anti-taking agent was required due to EUDRAGIT EPO® adherence to the glassware. As reported in other studies[17], addition of a second polymer to copolymers of acrylic and methacrylic acid was required for particle solidification when emulsion technique was used. Dhoka et al.[17] estimated that a combination of two polymers provided the desired characteristics of the microparticles such as taste masking ability, micromeritic properties, percentage yield, drug content, particle size, and in vitro drug release. Therefore, ethylcellulose was used in this study as a second polymer. The preparation conditions were determined in preliminary studies. The composition of the developed models (EMS1/5) is presented in Table 1. Drug-to-polymer ratio, EUDRAGIT EPO®-to-ethyl cellulose ratio and the emulsifier concentration were varied.
| Model | ENA (mg) | Polymers (mg) | Ratio EUDRAGIT EPO®: Ethylcellulose | Talc (mg) | Emulsifier (%) |
|---|---|---|---|---|---|
| EМS1 | 200 | 800 | 0.04236 | 200 | 1,0 |
| EМS2 | 200 | 800 | 0.04236 | 200 | 1,5 |
| EМS3 | 200 | 800 | 0.04306 | 135 | 1,5 |
| EМS4 | 200 | 800 | 0.08403 | 265 | 1,5 |
| EМS5 | 400 | 800 | 0.04236 | 200 | 1,5 |
Table 1: Composition of Polymer Microparticles, Obtained by Emulsion Solvent Evaporation Technique
The results for production yields, drug loading and encapsulation efficiency of models EMS1, EMS2, EMS3, EMS4 and EMS5 are presented in Table 2. The highest yield (52.97 %) was determined in model EMS3 and that was probably due to the largest amount of ethylcellulose used for the particle preparation. In models EMS1 and EMS2 the same amounts of ENA, ethylcellulose and EUDRAGIT EPO® were used but the emulsifier concentration was varied. The yield of EMS2 was higher than that of EMS1, which was probably due to the higher amount of emulsifier. Therefore, the higher concentration of emulsifier-1.5 % Tween 20® was selected for the preparation of further models. For EMS1, DL and DEE had the highest values. EMS4 had the lowest encapsulation efficiency-0.89 %, the lowest drug loading and the lowest yield-38.85 %, probably due to the smallest amount of ethyl cellulose used. The highest yield was obtained in the EMS3 model, probably due to the higher amount of ethyl cellulose. The results showed that the amount of ethylcellulose was a determining factor for the yield, drug loading and encapsulation efficiency. This conclusion confirms the results of Pandav et al.[18] who found out that as polymer concentration increased, the binding capacity or matrix forming competency of polymer with drug also increased. For this reason, large amounts of ENA are entrapped in the polymeric core and give higher yields of microparticles at a higher drug-to- polymer ratio rather than at a lower ratio[19].
| Model | Yield, %±SD | DL, %±SD | DEE, %±SD |
|---|---|---|---|
| EMS1 | 41.56±1.20 | 40.01±0.73 | 2.00±0.04 |
| EMS2 | 47.03±0.60 | 35.22±0.79 | 1.70±0.04 |
| EMS3 | 52.97±1.60 | 33.07±0.52 | 1.65±0.03 |
| EMS4 | 38.85±0.25 | 17.93±0.79 | 0.89±0.04 |
| EMS5 | 38.96±0.99 | 27.03±0.52 | 1.35±0.03 |
Table 2: Yields (%), DL % and DEE %
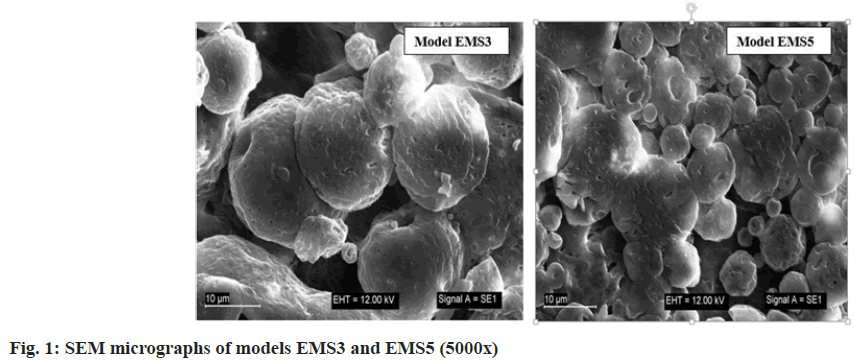
Scanning electron microscopy was used to visualize the obtained microparticles (fig. 1). The surface morphology of the obtained particles was not smooth, but uneven with many recesses. It could be suggested that ENA, which was included inside the microparticles, would be released quickly through the recesses, and the models might not show good masking ability compared to the bitter taste of ENA. The shape of the particles was not spherical. Uneven surface and irregular shape were formed after the emulsification and the subsequent hardening of the droplets. Similar surface morphology of micro particles with ethyl cellulose and EUDRAGIT® polymers was determined by Pandav et al.[18]. EUDRAGIT EPO® and ethyl cellulose, which differ substantially in structure and properties, formed slightly porous surface. It could be suggested that the shrinkage and the dents were formed due to the collapse of the particle wall during solidification[20]. In the study of Wasilewska et al.[21] microparticles formulated using organic solvents revealed collapsed, wrinkled, irregular structure with small particles adsorbed on the surface, resembling “shriveled raisins”.
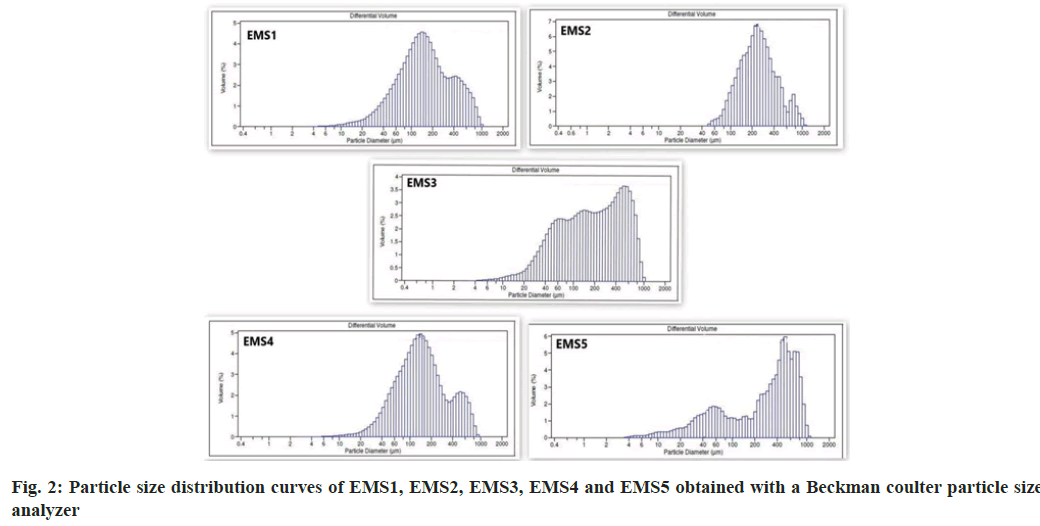
A laser diffraction apparatus was used to determine the mean particle size and particle size distribution. The particle size distribution curves are shown in fig. 2. The mean particle size is presented in Table 3. The particle size distribution analysis revealed several fractions, the main part of which having particle size in the range 60 μm to 1000 μm. The particle size distribution curves of EMS1 and EMS4 were similar despite the different concentrations of emulsifier and polymers. The particles of model EMS5 were of a larger size, which was probably a result of the higher amount of ENA and particle aggregation. EMS5 had a different ENA to polymer ratio (1:2) compared to the other models (1:4).
| Model | EМS1 | EМS2 | EМS3 | EМS4 | EМS5 |
|---|---|---|---|---|---|
| Mean size, d50, µm±SD | 148.5±0.25 | 236.3±0.54 | 187.6±0.98 | 140.1±1.02 | 339.00±2.56 |
Table 3: Mean Particle Size (d50, µm) of the Obtained Models
The average particle size ranged from 339.0 μm in EMS5 to 140.1 μm in EMS4. The smallest particles were observed in EMS4, which had the lowest yield, drug loading and encapsulation efficiency. Probably, the largest amount of ENA and the greatest solid phase content influenced the particle size in EMS5. As the polymer concentration increased, viscosity of the emulsion also increased, resulting into the formation of larger droplets during emulsification and larger solid particles after solvent evaporation. Greater polymer concentration in a fixed volume of solvent increased the viscosity of the medium and led to enhanced interfacial tension. Shearing efficiency diminished at higher viscosities and increased the emulsion droplet size and microparticle size[22-24].
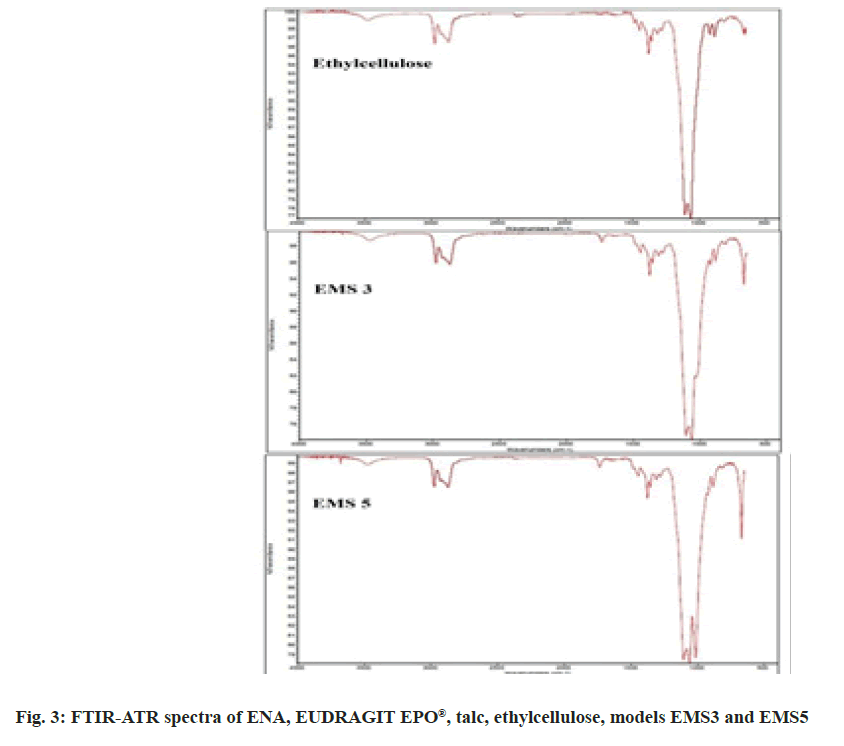
Infrared spectroscopy was used to assess the compatibility between ENA, EUDRAGIT EPO®, ethyl cellulose and talc, and the eventual chemical interaction during particle preparation. The spectra of the pure substances- ENA, EUDRAGIT EPO®, talc, ethyl cellulose and of models EMS3 and EMS5 are presented in fig. 3.
The FTIR spectra revealed characteristic peaks of ENA at 1750 cm-1 , 1725 cm-1 , 1450 cm-1 , 1376 cm- 1, 1226 cm-1 , 1646 cm-1 , 875 cm-1 and 668 cm-1 . The characteristic peaks of the EUDRAGIT EPO® are at 1725 cm-1 , 1455 cm-1 and at 1150 cm-1 . The characteristic peaks of talc are at 1072 cm-1 , 1000 cm-1 and 667 cm-1 . The ethyl cellulose spectrum showed oscillations at 1450 cm-1 due to the -CH2 group, at 1377 cm-1 due to the CH3 group and two oscillations at 1100 and 1060 cm-1 due to C-O aliphatic ester. In models EMS3 and EMS5 the characteristic peaks of talc (at 1000 cm-1 ) and ethyl cellulose (at 1100, 1060, 1377 and 1450 cm-1 ) were clearly visible. It was more difficult to distinguish the characteristic peaks of ENA and EUDRAGIT EPO®, which proved that very small amounts of them were included in the models. No new peaks were observed in the microparticle spectra suggesting no chemical interactions.
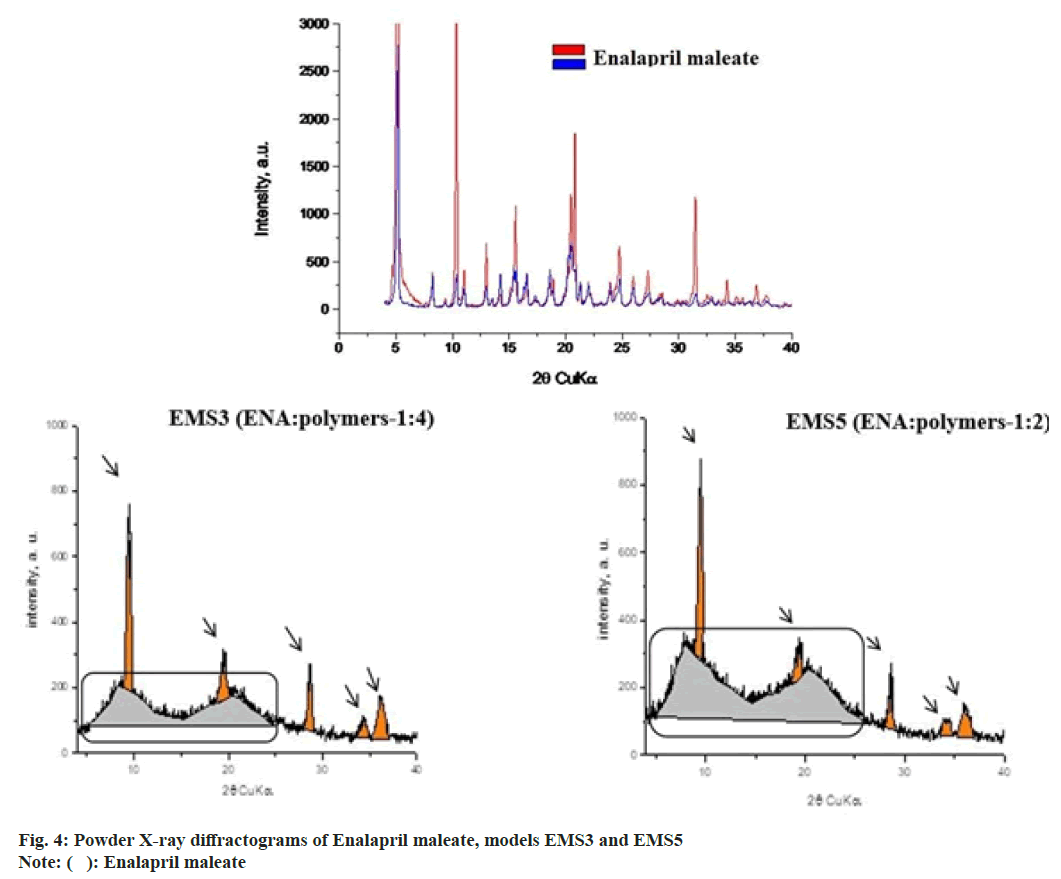
The physical state of ENA and the excipients was analysed in order to determine eventual polymorphic transformation after the emulsion solvent evaporation process. Powder X-ray diffraction was used for this purpose. The study was performed with models EMS3 and EMS5. Fig. 4 shows the diffractograms of EMS3 and EMS5. The analysis of the physical state showed that ENA was in crystalline form whereas EUDRAGIT EPO® was amorphous[6,7]. The diffractograms of EMS3 and EMS5 (fig. 4) showed that the characteristic peaks of the crystal modification of ENA disappeared suggesting a physical change from crystalline into amorphous state during encapsulation in the particles. The analyzed diffractograms showed the presence of amorphous component, which represented ENA, ethyl cellulose and EUDRAGIT EPO®. Talc (indicated with pointers) did not predetermine the amorphous component of ENA and polymers. The diffractograms clearly showed that talc was a separate phase after obtaining the particles. The amorphous component in model EMS3 was greater than in model EMS5, which was a result of the larger polymer content in EMS 3 than ENA. In the analyzed models two clearly separated fractions (marked with a rectangle) of the amorphous phase with peaks were noted, due to the inclusion of a second polymer. Some authors have reported the preparation of microspheres with ethylcellulose in combination with a second polymer, which led to the formation of two fractions of the amorphous phase in the obtained models[25].
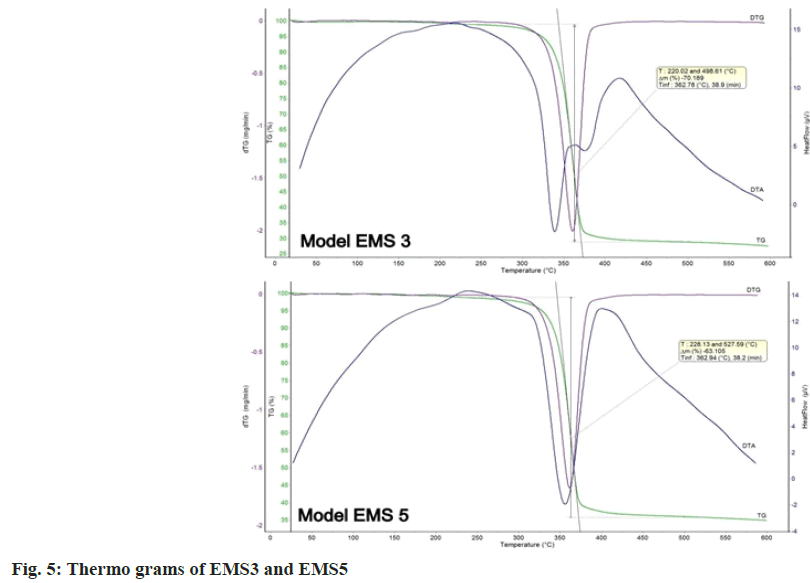
TG-DTA analysis was used to assess the physical state of ENA in the prepared models. The results of the thermal analysis of EMS3 and EMS5 are presented in fig. 5. ENA has a melting point at 165°, but no peak appeared, because of the degradation of ENA in the course of DTA and DTG in both the models. This was evidence of the transition to an amorphous state. The thermal degradation of ethyl cellulose was at 334.46°[26] and of EUDRAGIT EPO® was at 295.57°[12] . A single-stage temperature change in the range of 250°-450° was reported, which corresponded to the melting range of EUDRAGIT EPO® and ethyl cellulose. The inflection point was at 362°. The data from the thermograms of the studied models proved the change of the physical state of ENA from crystalline to amorphous.
Thermal analysis and powder X-ray diffraction showed the transition of ENA from crystalline to amorphous state. Moreover, no recrystallization process occurred during the evaporation and/or drying steps. The same conclusion was made in another similar study[27]. The amorphous state would result in rapid drug release in the oral cavity and might further hinder taste masking efficiency [28].
Taste evaluation was based on the amount of ENA released (%) in phosphate buffer with pH=6.8 (artificial saliva without enzymes) after 60 s. The results are presented on fig. 6.
The released ENA after 60 s was 42.55 % for EMS1 and 38.76 % for EMS2. These models were prepared at a 1:4 ratio ENA:polymer varying the emulsifier concentration. EMS1 and EMS2, which showed the largest values of DL and DEE, released the highest percentages of ENA in artificial saliva. According to a study by Maniruzzaman et al.[29], the larger the DL, the more difficult the taste masking. The model containing the largest amount of EUDRAGIT EPO®, EMS4, released 16.51 % ENA for 60 s. EMS5, prepared with equal amounts of polymers, released 4.53 % ENA. In EMS3, the released drug was only 1.78 %. It could be suggested that the slow release of ENA was due to the large amount of ethyl cellulose, providing optimum taste- masking[30]. Slower drug release could be correlated with taste masking effectiveness[31]. However, this must not compromise the desired fast onset of therapeutic action of the drug[32]. According to the obtained results, the inclusion of ethyl cellulose played a crucial role in taste-masking, being essential not only for the preparation step but also in hindering drug release. The main criterion for selecting an optimum model was the lowest ENA amount released in artificial saliva. This could be a prerequisite for adequate taste masking. A promising model that met the upper requirement, was EMS3, which could serve as a base for future research in the field and development of an oral dosage form with improved taste.
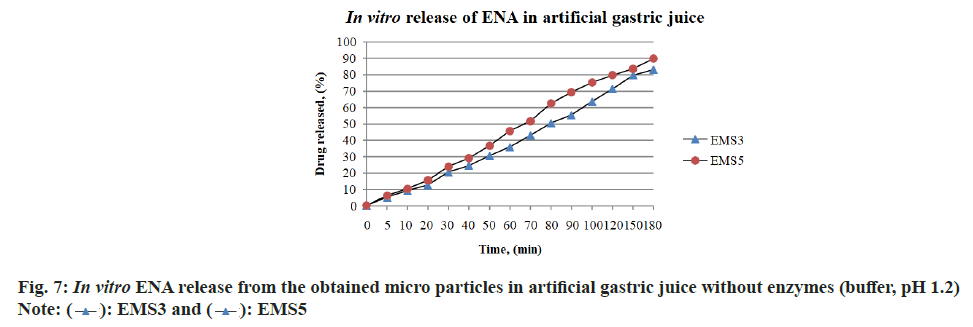
The study of ENA release from models EMS3 and EMS5 obtained by emulsion solvent evaporation technique was performed under conditions similar to gastric conditions in order to determine the biopharmaceutical behavior of the obtained models. The release profiles of ENA (%) from models EMS3 and EMS5 in artificial gastric juice with pH 1.2 are presented on fig. 7. The dissolution profiles of ENA from the polymer microparticles of the EMS3 and EMS5 models showed that 50 % of the included ENA was released at the 80th and 70th mins, respectively. The included ENA was gradually released within 180 min. The EMS5 model released 80 % of ENA at the 120th min, and the EMS 3 model just at the 180th min. The release profiles correlated with the composition of the models. The EMS3 model, which contains more ethyl cellulose, released ENA more slowly than the EMS5 model. The bigger amount of ethyl cellulose slowed the release of the drug[30]. The delayed release of ENA from polymer microspheres in artificial gastric juice was also achieved in the study by Shilpa et al.[33], but by a different polymer composition. There is an evidence that the dialysis membrane can significantly delay the passage of the released drug into the acceptor medium, in which case the presented drug release profile will not correctly describe the actual kinetics of drug release[34]. This is probably another reason for delaying the release of ENA from the polymer microparticles of EMS3 and EMS5 models obtained by emulsion solvent evaporation technique.
In conclusion, the emulsion solvent evaporation method was a suitable method for preparation of polymer microparticles with taste masking potential. An optimal model was selected that showed minimum release of ENA into artificial saliva which was a prerequisite for achieving taste-masking. This model had high values for yield and drug loading. The physicochemical characteristics indicated that the optimal model was suitable for further incorporation into orodispersible dosage forms.
References
- Chen X, Wang Y. Tracking of blood pressure from childhood to adulthood: A systematic review and meta-regression analysis. Circulation 2008;117(25):3171-80.
[Crossref] [Google Scholar] [PubMed]
- Chu PY, Campbell MJ, Miller SG, Hill KD. Anti-hypertensive drugs in children and adolescents. World J Cardiol 2014;6(5):234-44.
[Crossref] [Google Scholar] [PubMed]
- Strickley RG. Pediatric oral formulations: An updated review of commercially available pediatric oral formulations since 2007. J Pharm Sci 2019;108(4):1335-65.
[Crossref] [Google Scholar] [PubMed]
- Schiffman SS, Zervakis J, Graham BG, Westall HL. Age-related chemosensory losses: Effect of medications. Am Chem Soc 2022;825:94-108 .
- Sharma D, Kumar D, Singh M, Singh G, Rathore MS. Taste masking technologies: A novel approach for the improvement of the organoleptic property of pharmaceutical active substance. Int Res J Pharm 2012;3(4):108-16.
- Georgieva YZ, Pilicheva BA, Kokova VY, Apostolova EG, Kassarova MI. Taste masking of enalapril maleate by the precipitation method. Folia Med 2019;61(3):426-34.
[Crossref] [Google Scholar] [PubMed]
- Georgieva Y, Kassarova M, Kokova V, Apostolova E, Pilicheva B. Taste masking of enalapril maleate by microencapsulation in Eudragit EPO® microparticles. Pharmazie 2020;75(2-3):61-9.
[Crossref] [Google Scholar] [PubMed]
- Kim BK, Hwang SJ, Park JB, Park HJ. Preparation and characterization of drug-loaded polymethacrylate microspheres by an emulsion solvent evaporation method. J Microencapsul 2002;19(6):811-22.
[Crossref] [Google Scholar] [PubMed]
- Madan PL, Jani RK, Bartilucci AJ. New method of preparing gelatin microcapsules of soluble pharmaceuticals. J Pharm Sci 1978;67(3):409-11.
[Crossref] [Google Scholar] [PubMed]
- Park K, Yeo Y. Microencapsulation technology. Encyclopedia of pharmaceutical technology. 2007;3:2315-27.
- Komatsu M, Tagawa K, Kawata M, Goto S. Biopharmaceutical evaluation of gelatin microcapsules of sulfonamides. Chem Pharm Bull 1983;31(1):262-8.
[Crossref] [Google Scholar] [PubMed]
- Goto S, Moriya F, Kawata M, Kimura T. Preparation and biopharmaceutical evaluation of microcapsules of amoxicillin. J Microencapsul 1984;1(2):137-55.
[Crossref] [Google Scholar] [PubMed]
- Siddiqui O, Taylor H. Physical factors affecting microencapsulation by simple coacervation of gelatin. J Pharm Pharmacol 1983;35(2):70-3.
[Crossref] [Google Scholar] [PubMed]
- Goto S, Komatsu M, Tagawa K, Kawata M. Preparation and evaluation of gelatin microcapsules of sulfonamides. Chem Pharm Bull 1983;31(1):256-61.
[Crossref] [Google Scholar] [PubMed]
- Tiwari S, Verma P. Microencapsulation technique by solvent evaporation method (Study of effect of process variables). Int J Pharm Life Sci 2011;2(8).
- Madhav NS, Kala S. Review on microparticulate drug delivery system. Int J PharmTech Res 2011;3(3):1242-4.
- Dhoka MV, Nimbalkar UA, Pande A. Preparation of Cefpodoxime Proxetil-polymeric microspheres by the emulsion solvent diffusion method for taste masking. Int J PharmTech Res 2011;3(1):411-9.
- Pandav S, Naik J. Preparation and in vitro evaluation of ethylcellulose and polymethacrylate resins loaded microparticles containing hydrophilic drug. J Pharm 2014;2014.
[Crossref] [Google Scholar] [PubMed]
- Lokhande AB, Mishra S, Kulkarni RD, Naik JB. Influence of different viscosity grade ethylcellulose polymers on encapsulation and in vitro release study of drug loaded nanoparticles. J Pharm Res 2013;7(5):414-20.
- Gowda DV, Gowrav MP, Gangadharappa HV, Khan MS. Preparation and evaluation of mixture of eudragit and ethylcellulose microparticles loaded with ranolazine for controlled release. J Young Pharm 2011;3(3):189-96.
[Google Scholar] [PubMed]
- Wasilewska K, Szekalska M, Ciosek-Skibinska P, Lenik J, Basa A, Jacyna J, et al. Ethylcellulose in organic solution or aqueous dispersion form in designing taste-masked microparticles by the spray drying technique with a model bitter drug: Rupatadine fumarate. Polymers 2019;11(3):522.
[Crossref] [Google Scholar] [PubMed]
- Kotagale NR, Parkhe AP, Jumde AB, Kh HM, Umekar MJ. Ranitidine hydrochloride-loaded ethyl cellulose and eudragit RS 100 buoyant microspheres: Effect of pH modifiers. Indian J Pharm Sci 2011;73(6):626.
[Crossref] [Google Scholar] [PubMed]
- Behera BC, Sahoo SK, Dhal S, Barik BB, Gupta BK. Characterization of glipizide-loaded polymethacrylate microspheres prepared by an emulsion solvent evaporation method. Trop J Pharm Res 2008;7(1):879-85.
- Pachuau L, Sarkar S, Mazumder B. Formulation and evaluation of matrix microspheres for simultaneous delivery of salbutamol sulphate and theophylline. Trop J Pharm Res 2008;7(2):995-1002.
- Mouffok M, Mesli A, Abdelmalek I, Gontier E. Effect of the formulation parameters on the encapsulation efficiency and release behavior of p-aminobenzoic acid-loaded ethylcellulose microspheres. J Serb Chem Soc 2016;81(10):1183-98.
- Trivedi MK, Branton A, Trivedi D, Nayak G, Mishra R, Jana S. Characterization of physicochemical and thermal properties of biofield treated ethyl cellulose and methyl cellulose. Int J Biomed Mater Res 2015;3(6):83-91.
- Junqueira MV, Calçado SC, de Castro-Hoshino LV, Baesso ML, Szarpak-Jankowska A, Auzely-Velty R, et al. Influence of the ethanol/dichloromethane ratio on the preparation of microsponges composed of ethylcellulose and Eudragit or HPMCphthalate for hydrophilic drug delivery. J Mol Liquids 2020;303:112633.
- Pimparade MB, Morott JT, Park JB, Kulkarni VI, Majumdar S, Murthy SN, et al. Development of taste masked caffeine citrate formulations utilizing hot melt extrusion technology and in vitro–in vivo evaluations. Int J Pharm 2015;487(1-2):167-76.
[Crossref] [Google Scholar] [PubMed]
- Maniruzzaman M, Boateng JS, Bonnefille M, Aranyos A, Mitchell JC, Douroumis D. Taste masking of paracetamol by hot-melt extrusion: An in vitro and in vivo evaluation. Eur J Pharm Biopharm 2012;80(2):433-42.
[Crossref] [Google Scholar] [PubMed]
- Adeleke OA. Premium ethylcellulose polymer based architectures at work in drug delivery. Int J Pharm X 2019;1:100023.
[Crossref] [Google Scholar] [PubMed]
- Amelian A, Wasilewska K, Wesoły M, Ciosek-Skibińska P, Winnicka K. Taste-masking assessment of orally disintegrating tablets and lyophilisates with cetirizine dihydrochloride microparticles. Saudi Pharm J 2017;25(8):1144-50.
- Guhmann M, Preis M, Gerber F, Pöllinger N, Breitkreutz J, Weitschies W. Design, development and in vitro evaluation of diclofenac taste-masked orodispersible tablet formulations. Drug Dev Indu Pharm 2015;41(4):540-51.
[Crossref] [Google Scholar] [PubMed]
- Shilpa Rani M, Kumar A, Rudra R. Preparation and in vitro characterization of enalapril maleate microspheres prepared by emulsion solvent evaporation method. 2012;3(2):54-9.
- Yu M, Yuan W, Li D, Schwendeman A, Schwendeman SP. Predicting drug release kinetics from nanocarriers inside dialysis bags. J Control Release 2019;315:23-30.

 : EMS3 and
  : EMS5


