- *Corresponding Author:
- Nilesh Banarase
Department of Pharmacognosy and Phytochemistry, Apollo College of Pharmacy, Anjora, Chhattisgarh 491001, India
E-mail: nbanarase7@gmail.com
| Date of Received | 10 June 2021 |
| Date of Revision | 14 August 2022 |
| Date of Acceptance | 24 March 2023 |
| Indian J Pharm Sci 2023;85(2):532-538 |
This is an open access article distributed under the terms of the Creative Commons Attribution-NonCommercial-ShareAlike 3.0 License, which allows others to remix, tweak, and build upon the work non-commercially, as long as the author is credited and the new creations are licensed under the identical terms
Abstract
Ultraviolet spectrophotometry has been successfully used for the qualitative as well as quantitative determination of various phytoconstituents. For the quantitative determination of phytoconstituents in the extract by ultraviolet spectrophotometry, the absorbance at specific wavelength is measured. As extract is a mixture of number of constituents, the absorbance of different constituents at the same wavelength along with the compound of interest can occur giving wrong interpretation of observed data and subsequently the results. So, in order to overcome said problem, the technique of fractional separation was used to remove the interfering chemical constituents at the wavelength of compound of interest. In this study, we quantitatively determined the oleanolic acid as a compound of interest in Eugenia caryophyllus flower buds using ultraviolet spectrophotometry.
Keywords
Ultraviolet spectrophotometry, cloves, oleanolic acid, fractional separation
Oleanolic Acid (OA) is a pentacyclic triterpenoid molecule distributed in huge variety of plants[1,2]. It shows several pharmacological activities of interest like antiviral, anti-inflammatory, hepatoprotective and antidiabetic[3-9]. Now-a-days, OA pays attention of the whole world as an emerging future medicine for the treatment of various ailments[10-18]. Because of its wide distribution, various plant sources can be utilized for its isolation on commercial scale. One of such rich and economically isolable source is clove[19]. Clove is an unopened dried flower bud of a tree, Eugenia caryophyllus (E. caryophyllus) (synonym Syzygium aromaticum), belonging to family Myrtaceae with crimson to dark brown in color, aromatic odour and taste produces numbness of tongue. It is about 10-17 mm in length, 4 mm in width and 2 mm thickness[20]. It is indigenous to Molucca, also called as ‘Clove Island’[21].
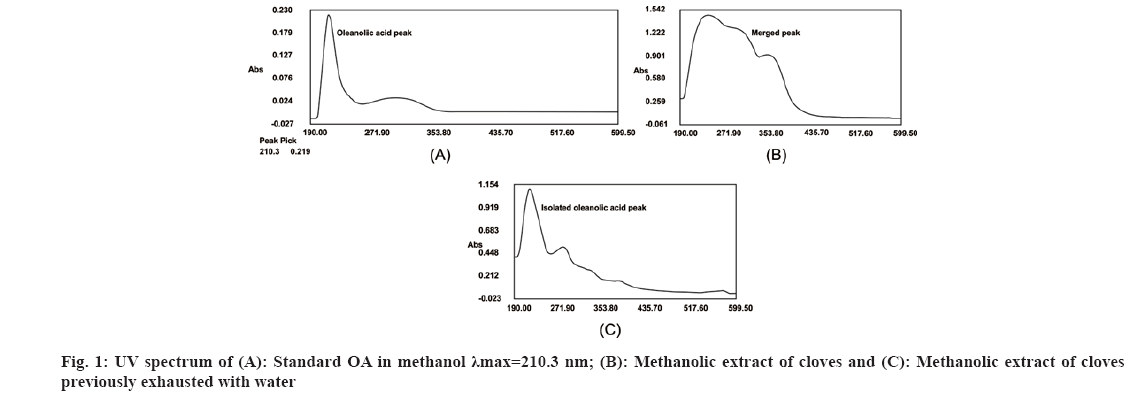
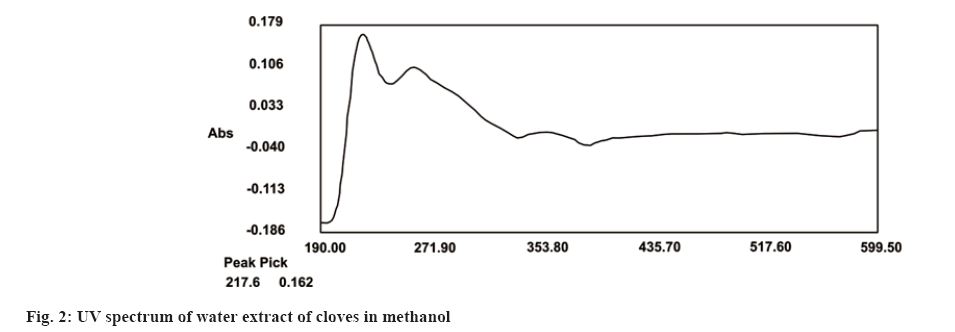
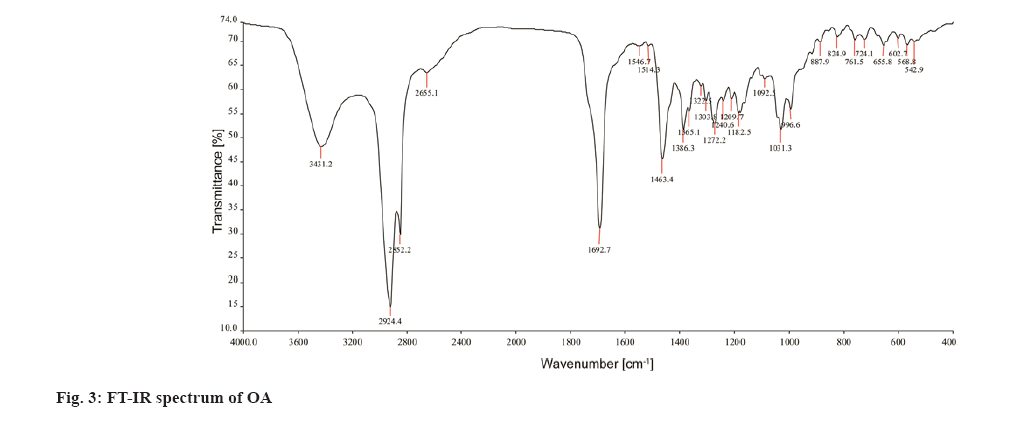
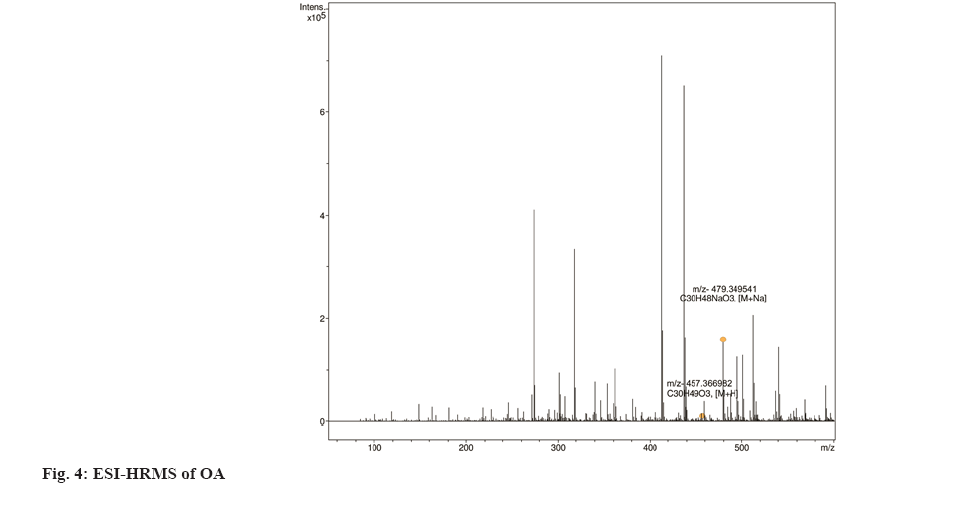
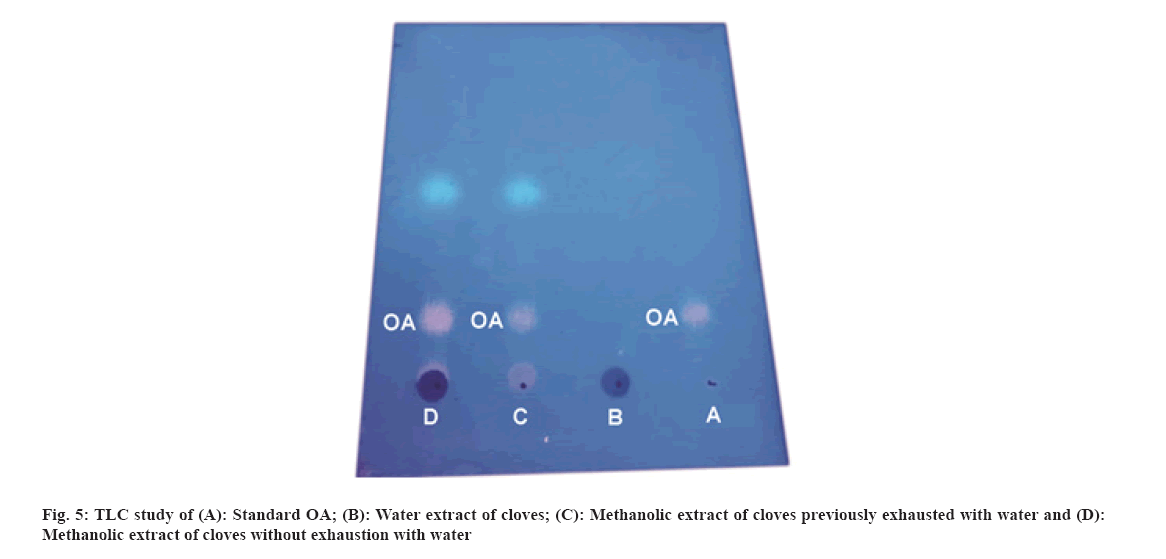
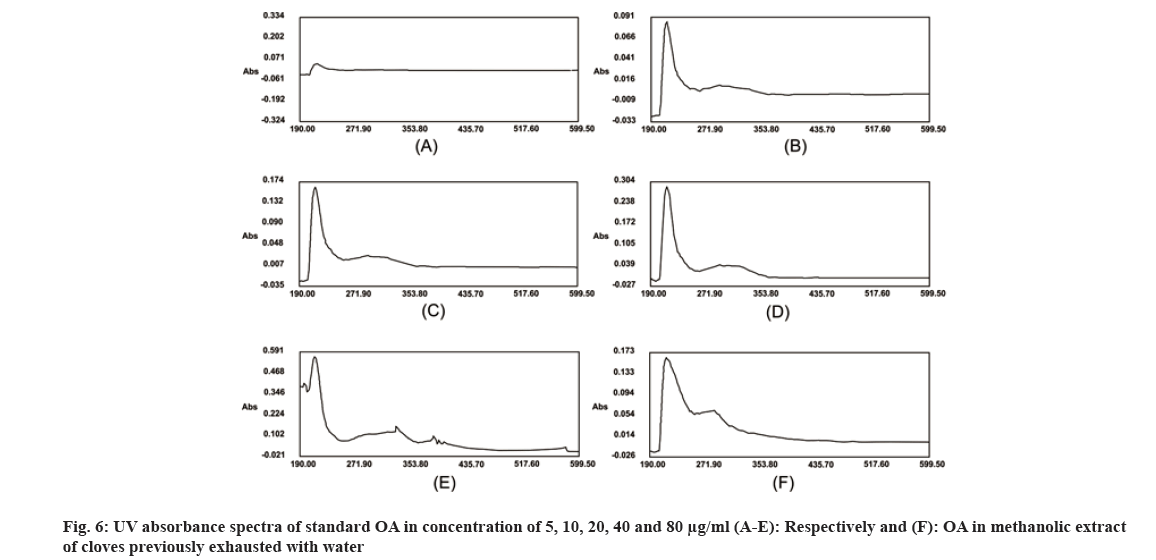
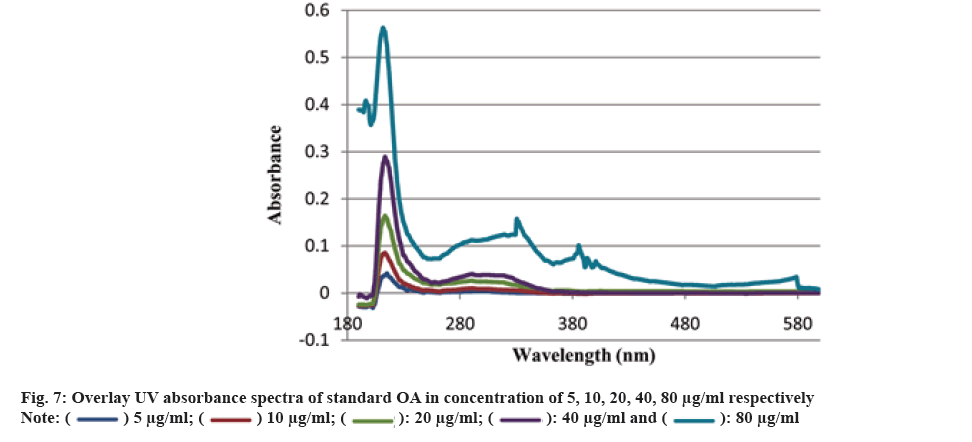
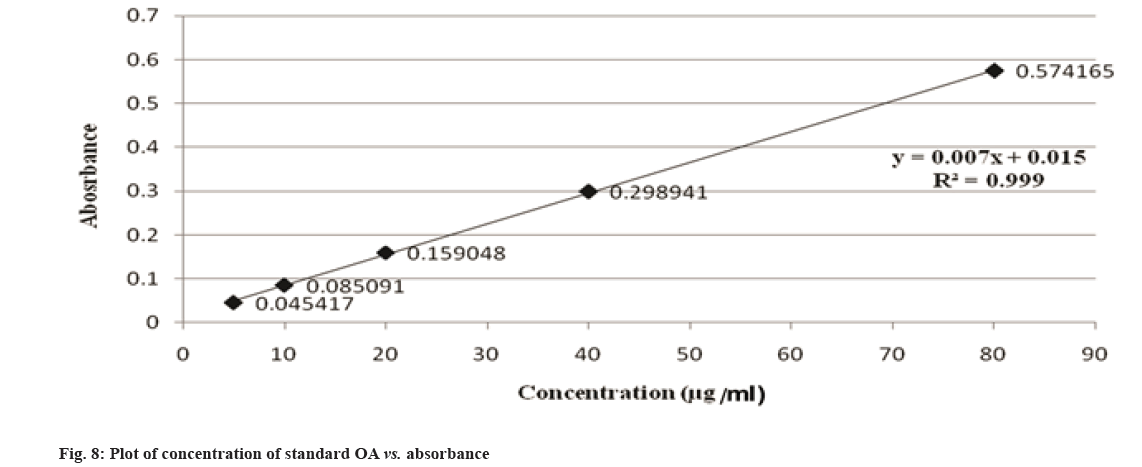
Traditionally, cloves have been used in various parts of the world to get relief from nausea, vomiting, stomach disorders and various protozoan infections like malaria. In dentistry, clove oil is very useful as dental analgesic[22-24]. Now-a-days, various countries like India, China, Indonesia, Sri Lanka, Tanzania and Madagascar are commercially producing the cloves[25]. The quantitative determination of Phytoconstituents in the extract holds an important aspect to determine the quality of crude drugs to be utilized for their isolation. In Ultraviolet (UV) spectrophotometry, for the quantitative determination, the absorbance of phytoconstituents at specific wavelength (λmax) is considered. As extract is a mixture of variety of different complex chemical constituents, their absorbance may occur at the same wavelength to that of compound of interest giving false interpretation of observed data and subsequently the results as explained in some studies by Li et al.[26] and Khanchi et al.[27]. Fractional separation is a chemical method use for the separation of constituents from the mixtures based on specific property of individual component to be separated like solubility. It is commonly use technique for the isolation of natural products from the extract in pure form[28-30]. In order to overcome the problem of false interpretations of the observed data and results in UV spectrophotometry as discussed above, we have used the fractional separation technique to remove undesired constituents of extract showing absorbance at similar wavelength to that of OA as a compound of interest. To study the concept, we quantitatively analyzed the OA present in clove. For this study, cloves (ATC® Spices) were purchased from the market of Drug city of state Chhattisgarh, India. These cloves were authenticated from the Botanical Survey of India, Central National Herbarium and Howrah, India as E. caryophyllus (Spreng.) Bullock and S.G. Harrison, family Myrtaceae. Pure OA (>98 %) was purchased from Yucca Enterprises, Mumbai, India. Methanol of HPLC grade was purchased from Loba Chemie, Mumbai, India. All the solvents for extraction and Thin Layer Chromatography (TLC) study were of High- Performance Liquid Chromatography (HPLC) grade. Throughout the experiment, double distilled water was used. PC based double-beam UV spectrophotometer, spectral bandwidth 1 nm and wavelength accuracy ±0.5 nm (Systronic, India) was used to determine the λmax and absorbance of the samples. Fourier Transform-Infrared (FT-IR) study was carried out using FT-IR spectrophotometer model RZX (Perkin Elmer, United States of America (USA)) by Potassium bromide (KBr) disk method while Electrospray Ionisation Mass Spectrometry (ESI-MS) study on mass spectrometer, Model-Impact HDTM (Bruker Daltonik GmbH, Germany). Nitrogen was used as a drying gas at 200° with flow rate of 0.120 ml/ min and a charging voltage of 2000 V. For the determination of λmax of standard OA, methanol was used. Here, methanol was the choice of the solvent due to lower UV cutoff wavelength[31], determined in the range of 190-600 nm. The absorbance values corresponding to the wavelength was noted down. Accurately weighed 1 g of clove powder was refluxed with 50 ml methanol using reflux assembly at 70° for 30 min. After 30 min, the extracted solution allowed to cool at room temperature and filtered using Whatman filter paper no.1. The solution was then transferred to 50 ml volumetric flask and volume adjusted up to the mark. The UV spectrum of the solution was studied for the marked separation of OA peak with other constituents along with TLC studies. Further, accurately weighed 1 g of clove powder was refluxed at 100° in 50 ml water using reflux assembly for 30 min. After 30 min, cooled the solution at room temperature and filtered using Whatman filter paper no.1. The clove powder was washed thrice with distilled water to remove any adhering constituents of extract. Dried the powder in the hot air oven at 35°-40°. Care was taken to avoid any loss of powder which may affect the accurate quantitative determination of OA. The water extract obtained here as a filtrate was dried and dissolved in methanol. The UV spectrum of said water extract dissolved in methanol was studied for the presence of OA as well as other constituents in it along with TLC studies like previous step. Now in this step we used the technique of fractional separation based on solubility of constituents, in which the water exhausted dried clove powder obtained was further refluxed with 50 ml methanol using reflux assembly at 70° for 30 min. After 30 min, the extracted solution was cooled at room temperature and filtered using Whatman filter paper no. 1. The solution was then transferred to 50 ml volumetric flask and adjusted the volume up to the mark. The concentration of the said solution will be 20 000 µg/ml representing the clove powder. Similar to previous steps, the UV spectrum of this solution was also studied for the marked separation of OA peak with other constituents along with TLC studies. For the TLC study, analytical precoated TLC plate (Merck, 1 mm thick, silica gel 60 F254) was used. The plate was pre washed with methanol and dried before use. Spot of standard OA in methanol, water extract of cloves in methanol, methanolic extract of cloves previously exhausted with water and methanolic extract of cloves without exhaustion with water were applied on the plate. The plate was developed in a mobile phase, petroleum ether:ethyl acetate (8.2:1.8). After complete development, the plate was dried for 10 min and sprayed with 10 % (v/v) ethanol solution of sulphuric acid and heated to 120° for 3 min in hot air oven. The visualized spots were documented in UV at 366 nm. For the preparation of standard solutions, 50 mg of OA was dissolved in 50 ml methanol to obtain 1 mg/ml (1000 µg/ml) of stock solution. Further, to study the linearity of standard solution, the serial dilutions were made in the range of 5-80 µg/ml using stock solution. For the quantitative determination of OA, methanolic extract solution of cloves previously exhausted with water (i.e. 20 000 µg/ml) was used to prepare 1000 µg/ml and analyzed. In the present study, λmax for standard OA in methanol was found to be 210.3 nm as shown in fig. 1A. When the UV spectrum of cloves extracted with methanol was studied, we found that, the absorbance peak of OA was neither sharp nor clear and it was merged with the other neighboring peaks as shown in fig.1B). The UV spectrum of dried water extract of cloves dissolved in methanol showed that, it was free from OA but contain other component having λmax 217.6 nm with some absorbance at 210.3 nm too as shown in fig. 2. While, in case of UV spectrum of cloves extracted with methanol previously exhausted with water clearly indicated that, the interfering merged peaks being lost and sharp OA peak could be observed (fig. 1C). In addition, the OA was also confirmed by FT-IR (–OH (3431.2 cm-1), –OH of carboxylic group (2924.2 cm-1), C=C (1692.7 cm-1), and –CH3 (1463.4 cm-1) (fig. 3) and Electrospray Ionization High-Resolution Mass Spectrometry (ESI-HRMS) ([M+Na]+ at m/z 479.349541 and [M+H]+ at m/z 457.366982 (cald. For Oleanoic acid (C30H48O3), 456.3) (fig. 4) studies. It means that, on exhaustion of cloves with water, some polar fraction components of cloves solubilized in it get lost but not the OA and hence we used this solution previously exhausted with water for quantitative determination of OA in the cloves. In the TLC study, Spot C and Spot D represented the presence of OA visualized as pink spot under 366 nm in UV corresponding to the Rf value 0.23 (fig. 5) along with other constituents as different spots of different Rf values. These different spots other than OA are due to complex mixtures of components in the extracts as explained earlier. While OA was not reported corresponding to the spot B most probably because OA is insoluble in water. The said confirmation about complete absence of OA in water extract was made by UV spectroscopy (fig. 2). Hence, the TLC study indicated that, OA was not lost during boiling the clove powder with water. The absorbance values of standard solutions of OA in the range of 5-80 µg/ml were noted down at 210.3 nm (fig. 6 and fig. 7). The plot of concentration of standard OA vs. absorbance was found to be linear (fig. 8). According to the linear regressive relation between concentration and absorbance, the calibration curve could be expressed using following equation.
y=0.007x+0.015 (R2=0.999)
Where, x is concentration (µg/ml) of OA; y is corresponding absorbance of OA. By using the above equation, the concentration of OA in 1000 µg/ml of solution of cloves previously exhausted with water corresponding to absorbance 0.156032 was found to be 20.1474 µg/ml. So, the percentage of OA in cloves was calculated as 2.01 %. Concluding the above mentioned study, the quantitative determination of OA in E. caryophyllus (Spreng.) flower buds also called as cloves was carried out. In this study we found that, in UV spectrum, some unwanted constituents of extract formed the interfering merged peak with OA to be quantified. We found that this method is suitable for the quantitative determination of the constituent of the extract by using the technique of fractional separation in which the unwanted interfering constituents were removed and the actual percentage can be calculated. In this study, the percentage of OA in cloves was estimated as 2.01 %.
Acknowledgments:
The authors would like to acknowledge CIF SPPU, Pune for ESI-HRMS, CIF Panjab University, Chandigarh for FT-IR studies and CIF Shri Rawatpura Sarkar Institute of Pharmacy, Durg, India for the provided instrumental facilities and financial support.
Conflict of interests:
The authors declared no conflict of interests.
References
- Fai YM, Tao CC. A review of presence of oleanolic acid in natural products. Nat Prod Med 2009;2:77-290.
- Lu YF, Wan XL, Xu Y, Liu J. Repeated oral administration of oleanolic acid produces cholestatic liver injury in mice. Molecules 2013;18(3):3060-71.
[Crossref] [Google Scholar] [PubMed]
- Liu J. Pharmacology of oleanolic acid and ursolic acid. J Ethnopharmacol 1995;49(2):57-68.
[Crossref] [Google Scholar] [PubMed]
- Sultana N, Ata A. Oleanolic acid and related derivatives as medicinally important compounds. J Enzyme Inhib Med Chem 2008;23(6):739-56.
[Crossref] [Google Scholar] [PubMed]
- Paszel-Jaworska A, Romaniuk A, Rybczynska M. Molecular mechanisms of biological activity of oleanolic acid-A source of inspiration for a new drugs design. Mini Rev Organ Chem 2014;11(3):330-42.
- Shanmugam MK, Dai X, Kumar AP, Tan BK, Sethi G, Bishayee A. Oleanolic acid and its synthetic derivatives for the prevention and therapy of cancer: Preclinical and clinical evidence. Cancer Lett 2014;346(2):206-16.
[Crossref] [Google Scholar] [PubMed]
- Isah MB, Ibrahim MA, Mohammed A, Aliyu AB, Masola B, Coetzer TH. A systematic review of pentacyclic triterpenes and their derivatives as chemotherapeutic agents against tropical parasitic diseases. Parasitology 2016;143(10):1219-31.
[Crossref] [Google Scholar] [PubMed]
- Ayeleso TB, Matumba MG, Mukwevho E. Oleanolic acid and its derivatives: Biological activities and therapeutic potential in chronic diseases. Molecules 2017;22(11):1915.
[Crossref] [Google Scholar] [PubMed]
- Sen A. Prophylactic and therapeutic roles of oleanolic acid and its derivatives in several diseases. World J Clin Cases 2020;8(10):1767-92.
- Xi J, Chang Q, Chan CK, Meng ZY, Wang GN, Sun JB, et al. Formulation development and bioavailability evaluation of a self-nano emulsified drug delivery system of oleanolic acid. AAPS PharmSciTech 2009;10(1):172-82.
[Crossref] [Google Scholar] [PubMed]
- Alvarado HL, Abrego G, Garduño-Ramirez ML, Clares B, Calpena AC, García ML. Design and optimization of oleanolic/ursolic acid-loaded nano platforms for ocular anti-inflammatory applications. Nanomedicine 2015;11(3):521-30.
[Crossref] [Google Scholar] [PubMed]
- Luo Y, Liu Z, Zhang X, Huang J, Yu X, Li J, et al. Effect of a controlled-release drug delivery system made of oleanolic acid formulated into multi vesicular liposomes on hepatocellular carcinoma in vitro and in vivo. Int J Nanomed 2016;11:3111-29.
[Crossref] [Google Scholar] [PubMed]
- Wang Q, Zhu R, Wang M, Xing S, Li L, He Y, et al. Targeted therapy of octreotide-modified oleanolic acid liposomes to somatostatin receptor overexpressing tumor cells. Nanomedicine 2017;12(8):927-40.
[Crossref] [Google Scholar] [PubMed]
- Sarfraz M, Afzal A, Raza SM, Bashir S, Madni A, Khan MW, et al. Liposomal co-delivered oleanolic acid attenuates doxorubicin-induced multi-organ toxicity in hepatocellular carcinoma. Oncotarget 2017;8(29):47136-53.
[Crossref] [Google Scholar] [PubMed]
- An JY, Yang HS, Park NR, Koo TS, Shin B, Lee EH, et al. Development of polymeric micelles of oleanolic acid and evaluation of their clinical efficacy. Nanoscale Res Lett 2020;15:1-4.
- Wang YS, Li GL, Zhu SB, Jing FC, Liu RD, Li SS, et al. A self-assembled nanoparticle platform based on amphiphilic oleanolic acid polypro drug for cancer therapy. Chin J Poly Sci 2020;38:819-29.
- Feng A, Yang S, Sun Y, Zhang L, Bo F, Li L. Development and evaluation of oleanolic acid dosage forms and its derivatives. Biomed Res Int 2020;2020:1308749.
[Crossref] [Google Scholar] [PubMed]
- Huang Q, Wang E, Gu W, Ma W, Zhou Y. Hyaluronan-coated meta-organic framework loaded with cisplatin and oleanolic acid for synergetic chemotherapy of colorectal cancer. J Mater Res 2020;35(22):3106-15.
- Banarase NB, Kaur CD. Economically viable isolation and characterization of oleanolic acid from Eugenia caryophyllus (Spreng.). Kuwait J Sci 2021;48(1):41-50.
- Rangari VD. Pharmacognosy and phytochemistry. Nashik: Career Publications; 2012.
- Evans WC, Evans D, Trease GE, editors. Trease and Evans Pharmacognosy. 16th ed. Edinburgh: Saunders/Elsevier; 2009.
- Kumar KS, Yadav A, Srivastava S, Paswan S, sankar Dutta A. Recent trends in Indian traditional herbs Syzygium aromaticum and its health benefits. J Pharmacogn Phytochem 2012;1(1):13-22.
- Martínez-Herrera A, Pozos-Guillén A, Ruiz-Rodríguez S, Garrocho-Rangel A, Vértiz-Hernández A, Escobar-García DM. Effect of 4-allyl-1-hydroxy-2-methoxybenzene (eugenol) on inflammatory and apoptosis processes in dental pulp fibroblasts. Mediators Inflamm 2016;2016:9371403.
[Crossref] [Google Scholar] [PubMed]
- Chung G, Oh SB. Natural Products. In: Ramawat K, Merillon JM, editors. Eugenol as Local Anesthetic, Berlin, Heidelberg: Springer; 2013. p. 4001.
- Kamatou GP, Vermaak I, Viljoen AM. Eugenol—from the remote Maluku Islands to the international market place: A review of a remarkable and versatile molecule. Molecules 2012;17(6):6953-81.
[Crossref] [Google Scholar] [PubMed]
- Li S, Berger J, Hartland S. UV spectrophotometric determination of theobromine and caffeine in cocoa beans. Anal Chim Acta 1990;232:409-12.
- Khanchi AR, Mahani MK, Hajihosseini M, Maragheh MG, Chaloosi M, Bani F. Simultaneous spectrophotometric determination of caffeine and theobromine in Iranian tea by artificial neural networks and its comparison with PLS. Food Chem 2007;103(3):1062-8.
- Criddle WJ, Ellis GP. Qualitative organic chemical analysis. Boston, MA: Springer; 1967.
- Ibrahim HA. Introductory Chapter: Fractionation. IntechOpen; 2018.
- Waheed I, Ahmad M, Syed NH, Ashraf R. Investigation of phytochemical and antioxidant properties of methanol extract and fractions of Ballota limbata (Lamiaceae). Indian J Pharm Sci 2014;76(3):251.
[Google Scholar] [PubMed]
- Mahoney WC, Hermodson MA. Separation of large denatured peptides by reverse phase high performance liquid chromatography. Trifluoroacetic acid as a peptide solvent. J Biol Chem 1980;255(23):11199-203.
[Crossref] [Google Scholar] [PubMed]
