- *Corresponding Author:
- Damini V, S. H. Kumar
Pharmaceutical Quality Assurance Group,
Department of Pharmaceutics,
JSS College of Pharmacy,
JSS Academy of Higher Education & Research,
Sri Shivarathreeshwara Nagara, Mysuru-570015,
Karnataka,
India
E-mail: hemanthkumar@jssuni.edu.in
| Date of Submission | 14 March 2020 |
| Date of Revision | 26 August 2020 |
| Date of Acceptance | 15 December 2020 |
| Indian J Pharm Sci 2020;82(6):928-944 |
This is an open access article distributed under the terms of the Creative Commons Attribution-NonCommercial-ShareAlike 3.0 License, which allows others to remix, tweak, and build upon the work non-commercially, as long as the author is credited and the new creations are licensed under the identical terms
Abstract
Deviations are the differences which are measured between the expected or normal values and the observed values for a product or process condition from a procedure or a documented standard. Deviations occur almost every day in the pharmaceutical industries, handling of deviations and minimising the recurrence of them has very critical considerations in the quality management system of the pharmaceutical industry. This article explains the procedure for handling of deviations by identifying the deviation, understanding its criticality, conduct root cause analysis and suggesting corrective and preventive action for it. This is explained through various case studies such as out of calibration equipment’s, facility modification, temperature excursions, out of specification during the manufacturing process, with a detailed process about the handling of deviations.
Keywords
Deviations, Root cause, Criticality, Corrective and Preventive Action
“Deviations are the measured differences between the observed and expected or normal values for a product or process condition or a departure from a documented standard or procedure”. A deviation may occur during testing and sampling of finished products and raw materials acceptance and manufacturing. Deviations can also be found out by the complaints given by the customers or comments given by the customer when the company’s standards do not meet the critical quality attributes as per the requirements. For the sake of continuous improvement and compliance to Good Manufacturing Practice (GMP), if any deviation occurs from the official procedures, then it must be documented. Food and Drug Administration (FDA) part 211.192 requires a thorough investigation of any deviation including documentation of conclusions and follow up. Quality Risk Management (QRM) principals employed in the firm should make sure that all the deviations occurred are rectified and recorded [1].
Deviation Handling
Among the crucial elements of the quality management system (QMS), handling the deviations plays an important role to assure the quality of the product by continuously improving the quality of it. As a part of Corrective and Preventive action (CAPA), if the deviation is once detected, then it needs immediate action (i.e., corrections), the root cause analysis should be done and systemic actions need to be implemented (i.e., corrective actions) to prevent non-conformances in the future. Recently, QRM is being used to prevent the risk of deviations in the pharmaceutical industry. International standards like International Conference on Harmonisation (ICH) guideline Q9 (ICH Q9) and World Health Organization (WHO) recommends using QRM system in the pharmaceutical industries. If any deviation occurs, how the personnel reacts to it is the main challenge to a system. This mainly depends on the level of training, qualification, commitment and support from the higher authorities of the company [2].
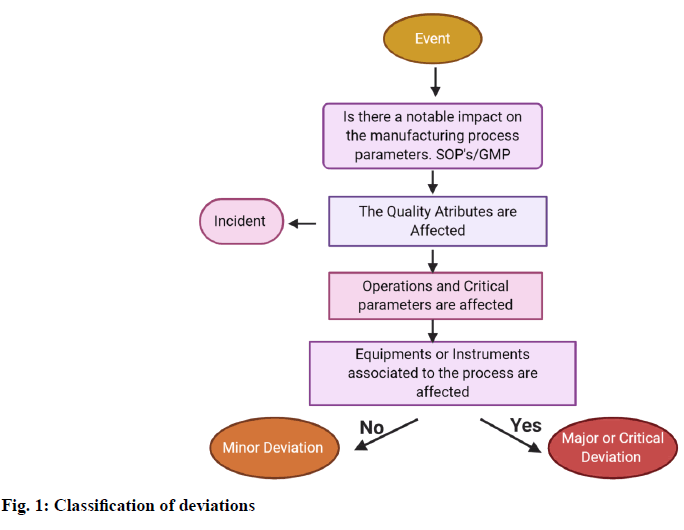
In order to record, classify and investigate the events based on their risk, decision tree will be used so that the person can make proper decisions regarding it. The decision tree explains the simplified assessment of risk which answers the following questions (fig. 1).
Whether the events affect the quality of the product? Do the approved specifications or written procedure which is examined, conflict with a requirement? [2]
Types of Deviations[3]
Deviations are of two types: Planned deviations, unplanned deviations
Planned Deviations:
Any deviation from a standard procedure selected intentionally for a short period to avoid undesirable situation without affecting the safety and quality of the product or procedure.
E.g.: Batch executed with lower input due to nonavailability of raw materials [4].
Unplanned Deviations:
Unplanned deviations are the accidental nonconformance observed after or during the implementation of an activity. Unplanned deviations may occur due to the following reasons: Equipment breakdown, Interruption of Power supply, Site Accidents, Utility Breakdown
Errors during documentation. Deviations may be further categorized into 3 types based on the impact of the deviation on the product quality, safety and validation state of the facility and process [5]: Critical, major, minor
Critical deviation:
The deviation will have a notable impact on the critical attributes of the product.
For Example: Usage of contaminated raw materials and solvents. Integrity failure of high efficiency particulate air filters [5].
Major Deviation:
The deviation will or may have a notable impact on critical attributes of the product. For Example: Critical process and in process parameter failure. Significant variation from standard output range.
Minor Deviation:
The deviation will not have any direct impact on the quality of the product.
For Example: Weights not replaced properly after use. Equipment and measuring device malfunction [5]
Procedure For Haldling Of Deviation
When to raise a deviation:
As soon a deviation occurs it should be immediately reported to Quality assurance (QA) within one working day from the time when the deviation has occurred or as per the Standard operating procedure (SOP).
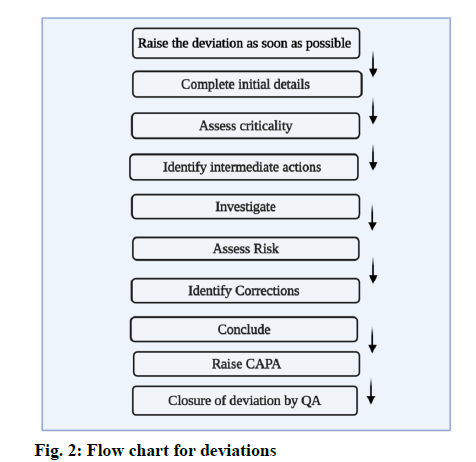
Record the issue in the deviation record, the time of occurrence and name of the department and the person who observed it should be documented. Standard against which the deviation occurred should be recorded [6]. The general flow for handling of deviations in depicted in fig. 2.
Initial details:
All the initial details regarding the deviation should be mentioned. All technical details and critical process parameters should be recorded. Track the progress [6].
Investigating deviations:
Establish what happened, Understand the events, Use investigation tools, Identify the causes and check for any common causes. Check if any other materials, components, batches and equipment are affected? [6]
Root Cause Analysis
Root cause analysis is a systematic process for identifying “root causes” of problems or events and an approach for responding to them. Root cause analysis can be identified and classified as errors caused by Men, Material, Machine, Method and Mother Nature.
Tools for identifying the Root cause
Fishbone analysis [6]:
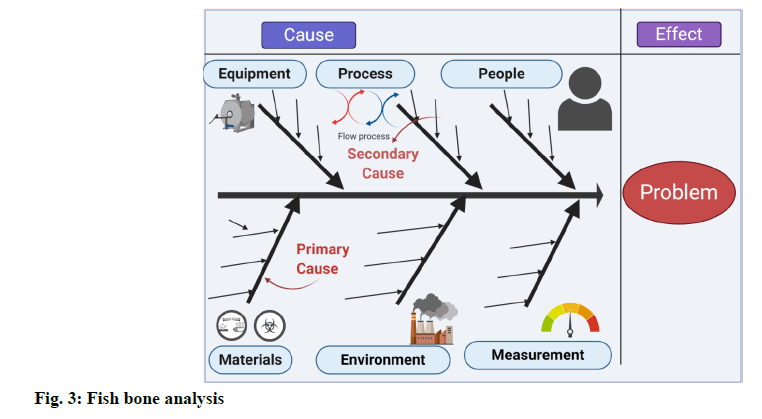
A fishbone diagram, also called a cause and effect diagram, is a visualization tool for categorizing the potential causes of a problem to identify its root causes. A fishbone diagram is useful in product development and troubleshooting processes to focus the conversation. After the group has brainstormed all the possible causes for a problem, the facilitator helps the group to rate the potential causes according to their level of importance and diagram a hierarchy. The design of the diagram looks much like a skeleton of a fish. Fishbone diagrams are typically worked right to left, with each large “bone” of the fish branching out to include smaller bones containing more detail (fig: 3).
5 whys analysis [7]:
5 Why analysis is used as a tool in root cause analysis. It is a set of five questions to find out the base of the problem. Sometimes, it is necessary to find out by asking more than 5 questions. Ask a question ‘why’ repeatedly to know the root of the problem until you find out the correct root cause.
For Example: Why the machine was stopped suddenly? Answer: Due to human error, Why did the human error occur? Answer: Human suddenly pressed the stop button. Why did the human press it? Answer: The label on the button was not visible. Why was the label not clearly?
Answer: Because it was covered with dirt. Why was it covered with dirt? Answer: It was not properly cleaned. Therefore, here we understand that the root cause is no proper cleaning practice [9].
Fault Tree Analysis (FTA) [8]:
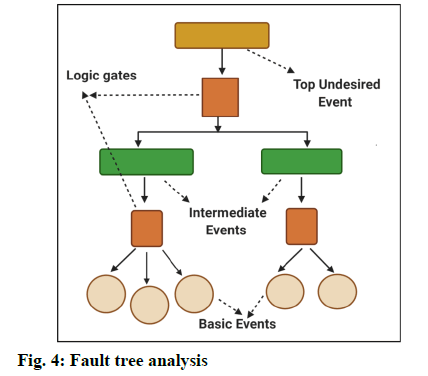
Fault tree analysis is a tool to find out the root cause analysis for the deviations. This helps to evaluate the failure of system one at a time and sometimes, by identifying the casual chain of events, multiple causes can be combined (fig. 4).
The results of these events are represented pictorially in the tree form. FTA is used to investigate the deviations and complaints to understand the root cause and to make improvements so that it does not lead to further problems [9]. Few other tools for identifying the causes are: Pareto charts, brainstorming, flowcharting, change analysis [5]
Closure of the Deviations
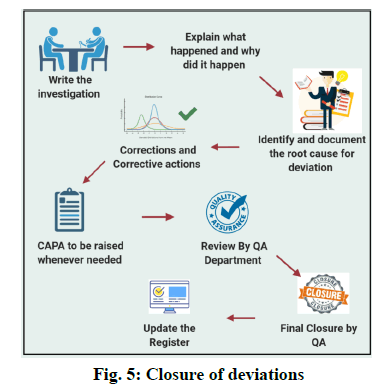
Prepare an investigation report for the occurred deviation and explain what happened and why did it happen. Identify the Root cause for the deviation. Write corrective and preventive action. Finally, Quality Assurance shall review the reports and proceed further for the closure of the deviation. [fig. 5]
Case Studies on Handling of Deviations
CASE STUDY 1: Employment out of Calibration Equipment/Instruments in the manufacturing process [10]
Details of a Deviation-Out of calibration Equipment was employed in the manufacturing process. Type- Unplanned Deviation
Immediate actions taken after identifying Deviation
Whether operations were stopped-No. As it is identified after the production of a few batches. Whether QA personnel was informed-Yes. It was immediately informed to Quality Assurance Personnel. Whether the affected material/batch numbers (part quantity or full quantity) was identified and segregated-Yes.
Root cause analysis
Out of Tolerance:
The first thing to be considered is to check the calibration certificate when out of tolerance occurs. You must understand what went wrong and check the data in the calibration report and check what the reason for out of tolerance is. You must analyse the risks. For example, Weighing balance: Let us say that if the weighing balance reading is not zero before weighing and you will weigh a product then it causes deviation. If you want to weigh 40 g of sample and the weighing balance is showing 0.05 g in the starting and not zero then the product you weighed will not be 40 g. It will be 39.95 g. Hence, it causes a deviation.
When did this happen?
Finally, check when was the measurements shown by the instrument accurately and the due date for calibration and previous calibration date.
Where is the instrument used?
You have to check where the instrument is used, such as production department or warehouse, etc. check whether the logbook is maintained for the instrument and is it maintained properly and entered after every use.
How is it used?
The last step is to identify how the out of tolerance instrument was being used. Determine what all measurements were being made at the location. This information will likely be found in the operator’s work instructions or end users procedures or an engineering specification. The objective of this step is to determine that whether the out of tolerance instrument could have affected any of the products manufactured or the services that are provided by this instrument, in this time frame, in this location, for these measurements. This can be achieved by reviewing the documentation process.
Corrective and preventive action
Corrective action:
Products which are not shipped must be separated instantly for testing. Re-inspection should be done for the products which are stored in the warehouse. If a product is already shipped, then it should be recalled. If a customer utilizes the product as the raw material and has not yet used it for production, then you can test or inspect in their site itself. If there is no proper equipment for testing then you have to recall.
Preventive action:
You have to calibrate the instrument regularly at periodic intervals. Calibration data must contain the following data: Is the calibration within the range? Is it out of calibration? Can calibration be extended for a longer time? [11]. Whenever it’s calibrated, is it within the specified limit?
CASE STUDY 2: Facility modification [12]
Details of a deviation
Type: Planned deviation: The secondary packaging material stored in the warehouse I is shifted to warehouse II due to the flooring modification carried out in warehouse I. During this period, the following will not be followed in the warehouse I: Area cleaning will not be performed as per the SOP and will not be recorded. The temperature monitoring for packaging material storage area will not be done.
Dispensing of packaging material will not be done at the warehouse. The newly received materials which need to be stored in the warehouse I is shifted to warehouse II.
Reason/justification for deviation:
To carry out flooring work at the warehouse I. Area cleaning for the warehouse will be done. Temperature monitoring will be done as per the SOP. Dispensing of the materials will be done as per the SOP in warehouse II. Transfer of all materials from warehouse I to warehouse II will be done in a closed container.
Final disposition of deviation by QA department:
This planned deviation was for storing of secondary packaging materials in warehouse II due to flooring modification in warehouse I. As per this deviation: Training was given to all the personnel involved to execute the deviation.
Before shifting material, the area was cleaned and the temperature was monitored and recorded as per SOP. During this period following was not done in the warehouse I. Area cleaning and temperature monitoring were not done. Impact assessment: Warehouse II was cleaned and the temperature was maintained before the transfer of material from warehouse I. Appropriate conditions were maintained. Materials were shifted and stored with care. After the completion of flooring modification in warehouse I, the area was cleaned and the materials were shifted back from warehouse I to warehouse II in a closed container. The planned deviation is completed.
CASE STUDY 3: Handling out of specifications [13]
Description
During in process reaction monitoring, one of the process impurities was observed in higher levels against the predetermined specification. The details are given below, Obtained result: 0.65 %, Limit: Not More Than 0.50 %.
Investigation details
Selection of investigation tool or method for investigation
Based on the nature of the deviation, the following investigation techniques can be used to identify the root cause. Genchi Genbutsu (Go & See) technique. Brain storming technique. 5-WHY technique. Six-M Framework (Ishikawa diagram/Fish bone diagram) technique. Among all the above techniques, based on the nature of deviation, “Six-M Framework” technique is employed to identify the probable root cause as depicted in fig. 3.
Machine (Equipment)
Reviewed the preventive maintenance records of all the equipment engaged in the said batch manufacturing and noted that all the equipment is meeting the requirement. No abnormalities were noted during preventive maintenance. Calibration status of the entire instrument like gauges, temperature sensors and temperature indicator which are affiliated with respective equipment was reviewed and noted that all the instruments are calibrated and no out of calibrations were reported. Cleaning status of respective equipment was reviewed and noted that entire equipment train was cleaned as per respective cleaning records and line clearance was acquired from Quality Assurance department before batch charging. Based on the above data, it is understood that the Equipment/Instruments involved in batch operations were fit and there are no breakdowns reported during batch execution.
Material (Input materials)
All the input materials used in the said batch were reviewed and noted that all are meeting the predetermined acceptance criteria and are suitable for usage. Key starting material details were reviewed and noted that the obtained source was approved facility and quality of the batch was meeting the specification. Quantity of all the input material was charged as per the approved batch manufacturing record (BMR). No abnormalities were identified with respect to input materials quality and quantity.
Men
All the personnel involved in the batch operations were well aware of the manufacturing process as per the batch manufacturing record. All are well experienced and trained on procedures. All the batch operations were carried out as per the BMR. No abnormalities were noted with respect to operations and testing of the batch.
Method (Process)
All the process parameters were followed as per the BMR. However, during in process reaction monitoring step, the impurity content was obtained 0.66 % which is above the acceptance limit i.e. not more than 0.50 %. As per the BMR, if the initial sample does not complies, it is recommended to repeat the addition of respective reagent with the reaction mass at specified temperatures. Hence, addition was done and 2nd sample was sent to Quality control (QC) to check the impurity level. The obtained result was 0.65 % which is still above the required limit. Upon further discussion with Research and development (R&D), after few hours of maintenance at specified temperature, 3rd sample was sent to QC to check the impurity level and found to be 0.58 % which is still above the limit of not more than 0.50 %. Hence, the reaction monitoring was terminated and proceeded for subsequent operations. To have a better over view on the process operations, comparison was made between pre and post executed batches.
Based on the comparison data, it is identified that the addition of reagent to the heterogeneous reaction mass was done in shorter time period when compared to previous and subsequent batches. As there is no standard instruction in the BMR, operator completed the reagent addition activity in shorter time period. By nature, this is an exothermic reaction, due to fast addition there is a sudden shoot up in the temperature beyond the designed space. As this is a heterogeneous mass, this sudden shoot up in the temperature affected the rate of reaction and led to in process non-conformance even after addition of excess reagent. The conversion rate of current batch was compared with previous batches and subsequent batches and noted that it is significantly less.
Mother Nature (environment)
No contamination occurs with Raw materials in the process.
Measurement
All the input material (solid & liquid) are charged as per the quantities mentioned in the BMR. Testing was carried out as per the approved method of analysis. Hence, there is no abnormalities identified related to measurement.
Root cause
Due to faster addition of reagent to the heterogeneous reaction mass, there is a sudden shoot up in the temperature beyond the designed space. This sudden shoot up affected the conversion rate and led to the in process non-conformance.
Corrective and Preventive action
Correction:
Reaction monitoring was terminated and proceeded for subsequent operations. However, same impurity was monitored during complete analysis of Active Pharmaceutical Ingredient (API) with the same limit. Quality of the batch was reviewed and found meeting the predetermined specification.
Corrective action and Preventive action:
To avoid the recurrence in future batches, the batch manufacturing record of respective API was revised by providing instruction for slower addition of the reagent to the reaction mass at respective operation within the specified time period.
CASE STUDY 4: Handling temperature/Relative Humidity excursions [14,15]
During the review of Supervisory Control and Data Acquisition (SCADA) report, it was noted that there is above 24 h excursion of relative humidity (RH) in powder processing area of manufacturing block clean room area.
Investigation details
Review of data:
Relative humidity was out of limit, where the limit is 60 % and it was found to exceed the specified limit.
From the data given in Table 1, it is noted that the relative humidity was out of acceptable limit. However, temperature was well within the acceptance limits.
| Day | Time | Temperature (º) (Limit: NMT 25º) |
RH (%) (Limit: NMT 60 %) |
|---|---|---|---|
| Monday | 00:00 | 21.3 | 65.5 |
| 01:00 | 22.0 | 62.3 | |
| 02:00 | 23.5 | 66.3 | |
| 03:00 | 24.2 | 67.2 | |
| 04:00 | 20.1 | 66.6 | |
| 05:00 | 23 | 67.3 | |
| 06:00 | 22.2 | 65.1 | |
| 07:00 | 21.2 | 70.3 | |
| 08:00 | 22.5 | 71.5 | |
| 09:00 | 22.7 | 71.2 | |
| 10:00 | 22.0 | 70.5 | |
| 11:00 | 23.4 | 74.2 | |
| Tuesday | 12:00 | 23.1 | 78.2 |
| 13:00 | 23.5 | 74.1 | |
| 14:00 | 23.7 | 75.1 | |
| 15:00 | 23.2 | 73.2 | |
| 16:00 | 23.4 | 73.4 | |
| 17:00 | 24.0 | 71.2 | |
| 18:00 | 24.2 | 78.1 | |
| 19:00 | 24.3 | 77.5 | |
| 20:00 | 24.8 | 75.4 | |
| 21:00 | 24.9 | 72.1 | |
| 22:00 | 24.2 | 76.1 | |
| 23:00 | 24.6 | 73.2 | |
| 00:00 | 24.8 | 70.1 |
Table 1: Relative Humidity Data
Summary of investigation
Based in the occurred discrepancy, probable causes were identified and analysed. Details are listed below.
Temperature of chilled water system:
The data of chilled water temperature to Air Handling Unit (AHU) system checked and found there was no abnormality.
Clean room doors:
Checked the doors open condition and found there were no door gaps and all doors are in closed condition during that period.
Chilled water strainer choke:
There were no chokes found in the chilled water strainer to AHU system.
Chilled water coil choke:
Cleaned the chilled water coil and restarted the AHU system. There was no change in the RH reading.
AHU filter choke:
Checked the AHU filter and there was no blockage in the filters.
AHU drain line choke:
Drain line was checked and found that water was not draining properly. So, the line was replaced immediately.
Working condition of solenoid actuator valve of chilled water and hot water:
Solenoid actuator valve of chilled water and hot water to AHU system was checked and found the hot water solenoid actuator valve was not operating properly. Immediately the solenoid actuator valve issue was attended and resolved. The RH found to be in controlled state after replacing it.
Inference
Based on the above investigation and analysis, it is concluded that the occurred discrepancy in RH is due to the malfunction of hot water solenoid actuator valve of AHU system. The issue was immediately attended and ensured that the RH is under controlled state. Preventive maintenance was also carried out as per the approved schedule and found satisfactory. However, respective clean rooms were idle during this said period of time. Hence, there is no impact on the product quality.
Root cause:
The malfunction of hot water solenoid actuator valve of AHU system is the root cause for inconsistency in the relative humidity.
Corrective and preventive action:
Correction:
The hot water solenoid actuator valve of AHU system was immediately rectified and ensured that RH is under controlled state (NMT 60 %).
Corrective Action and Preventive Action:
The checking of solenoid actuator valve functioning is already a part of preventive maintenance activity and was carried out as per the approved schedule. However, to prevent the recurrence, it is proposed to provide a dedicated chilled water line for AHU’s Booster pump from the chilled water main line to provide constant flow of chilled water.
CASE STUDY 5:
At specified operation, reaction mass was stirred at 38º instead of 40º to 45º.
Investigation details
Review of raw material quality and quantity:
Analytical results of the respective input materials were reviewed and found meeting the predetermined specification. All the raw materials were charged as per the standard quantity provided in the approved Batch Manufacturing Record.
Review of batch manufacturing record
Process parameters:
All the process parameters of respective batch were reviewed from the executed batch manufacturing record and noted that all the process operations were executed as per the BMR. However, at specified operation, the reaction mass was stirred at 38º instead of 40° to 45º. At specified operation, the process solvent used was ‘Dichloromethane’ and the boiling point of dichloromethane was around 39°. Hence, the reaction mass was maintained below 39°.
In process controls:
In process controls are reviewed and found all are meeting the pre-determined in process specification as per the BMR. No abnormalities were identified during reaction monitoring.
Personnel Evaluation:
Concerned personnel involved in the batch manufacturing were inquired with respect to the temperature discrepancy and found no operational deviations occurred. Training records of respective personnel involved for the execution of the batch were reviewed and observed that they are enough experienced and trained on manufacturing process of specific API stage.
Summary of investigation
Based on the above review it is noted that the reaction was maintained below 39° due to the boiling point of the process solvent i.e. Dichloromethane. However, further operations were reviewed and no abnormalities noted and all the in process samples met the specification without any abnormalities.
Root Cause
Due to the boiling point of process solvent i.e. Dichloromethane. Reaction mass was stirred at 38º instead of 40º to 45º.
Impact on other batches
The output and quality of subject batch were reviewed and found to be well within the limits. No abnormalities identified with respect to other process operations. Hence, there is no impact on the subject batch quality due to said discrepancy. However, there were no further manufacturing of said API stage. Hence, there is no impact identified on other batches.
Details of Corrective & Preventive action
Correction:
Reaction mass was maintained at 38º instead of 40º to 45º based on the boiling point of the process solvent.
Corrective and preventive action:
As the occurred deviation is due to process solvent boiling point, it is proposed to revise the batch manufacturing record of said API stage by modifying the temperature at specified operation as 35° to 40° instead of 40º to 45º.
Conclusion
Deviation management plays a key role in maintaining product quality and leading to continuous improvement among the essential elements of a well-established Quality Management System (QMS). A thorough knowledge and experience about handling of deviations, analysing the deviations and implement Corrective and Preventive actions plays a very dynamic role in better and successful functioning of a pharmaceutical industry. Proper analysis of a deviation would provide the pharmaceutical organization, methods and procedures to be established and implemented to reduce the errors and deviations in future, providing better assurance and benefits to the organization.
References
- https://www.pharmaceutical-technology.com/products/deviation-management/
- https://www.who.int/immunization_standards/vaccine_quality/risk_july_2013.pdf
- Difference between Deviation and Incident in Pharmaceutical. Pharma Pathway 2016. http://pharmapathway.com/difference-between-deviation-and-incident-in-pharmaceutical/
- https://www.pharmout.net/wp-content/uploads/2016/07/2015_GMP_Validation_Forum_Deviation-Incident-Non-conformance-Systems.pdf
- Appropriate Handling of Out-of-Calibration Equipment. Quality Digest 2009. https://www.qualitydigest.com/inside/metrology-article/appropriate-handling-out-calibration-equipment.html
- Compliance I. As-Found: Out-of-Tolerance – What to do next? [Internet]. In Compliance Magazine. 2019 [cited 6 August 2019]. Available from: https://incompliancemag.com/article/as-found-out-of-tolerance-what-to-do-next/
- Measuring the performance of quality assurance processes: pharmaceutical industry deviation management case study. Academia 2010. https://www.academia.edu/16285499/Measuring_the_performance_of_quality_assurance_processes_pharmaceutical_industry_deviation_management_case_study
- Reporting Failures and Process Deviations: A Closed-Loop Approach. Pharma Manufacturing 2010. https://www.pharmamanufacturing.com/articles/2010/051/
- https://web.njit.edu/~armenant/PhEn602-102/PhEn602-Spring09-Notes2.pdf
- https://learnaboutgmp.com/good-manufacturing-practices-cgmp/guide-to-fda-approval-process-and-importance-of-equipment-calibration/
- Poddar SK, Sifat AE, Haque S, Nahid NA, Chowdhury S, Mehedi I. Nicotinamide mononucleotide: exploration of diverse therapeutic applications of a potential molecule. Biomolecules 2019;9(1):34.
- http://www.jpma.or.jp/information/ich/explanation/pdf/05_ich100715.pdf
- https://www.ema.europa.eu/en/documents/presentation/eu-gmp-requirements-quality-systems-bernd-boedecker_en.pdf
- https://www.fda.gov/media/71553/download
- https://www.gmpsop.com/sample/QMS-035-Deviation-Report-System-sample.pdf
