- *Corresponding Author:
- A. K. Das
Clinical Research and Pharmacovigilance, Micro Labs Limited, Bangalore?560 068, India
E?mail: das.akhila@gmail.com
| Date of Submission | 26 March 2015 |
| Date of Revision | 17 November 2014 |
| Date of Acceptance | 11 October 2013 |
| Indian J Pharm Sci 2015;77(2):190-195 |
Abstract
The bioequivalence of two different tablet formulations containing losartan potassium 100 mg was determined in healthy volunteers after a single oral dose in a randomized crossover study. Test and reference products were administered to 60 volunteers with 240 ml water after overnight fasting. Plasma concentrations of losartan and its active carboxylic acid metabolite were monitored over a period of 36 h after drug administration by validated LC/MS/MS analytical method. The pharmacokinetic parameters C max , AUC 0-t , AUC 0-͵, AUC 0-t /AUC 0-͵, t max , K el and t� were determined from plasma concentration time profile of both formulations for losartan and its active metabolite losartan carboxylic acid and were found to be in good agreement. The carboxylic acid metabolite was considered for profiling purpose only. The analysis of variance did not show any significant difference between the two formulations and 90% confidence intervals for the ratio of C max (84.89-104.09%), AUC 0-t (95.84-102.84%) and AUC 0-͵ (96.43-103.25%) values for losartan between the test and reference products were within the 80-125% interval, satisfying the bioequivalence criteria of the US FDA guidelines. These results indicate that the test and the reference products of losartan potassium are bioequivalent and, thus, may be prescribed interchangeably.
Keywords
Losartan Potassium, angiotensin, hypertension, bioequivalence, ANOVA
Hypertension is a chronic medical condition in which the blood pressure in the arteries remains above the normal recommended range. It leads to the development of cerebrovascular disease, ischemic heart disease, cardiac and renal failure. Following treatment of hypertension, 40% reduction in the risk of stroke and 15% reduction in the risk of myocardial infarction is achieved [1].
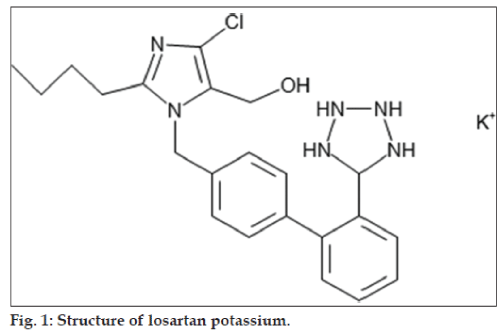
Losartan potassium (LP), C22H22ClKN6O (fig. 1), is an angiotensin II receptor (type AT1) antagonist. It is a non‑peptide molecule, chemically described as 2‑butyl‑4‑chloro‑1‑ [p‑(o‑1H‑tetrazol‑5‑ylphenyl) benzyl] imidazole‑5‑methanol monopotassium [2]. Angiotensin II is a potent vasoconstrictor, the primary vasoactive hormone of the renin‑angiotensin system and plays an important role in the pathophysiology of hypertension. Aldosterone secretion by the adrenal cortex is also stimulated by angiotensin II. Losartan is a reversible, competitive inhibitor of the AT1 receptor. Losartan and its principal active metabolite losartan carboxylic acid (LCA) block the vasoconstrictor and aldosterone‑secreting effects of angiotensin II by selectively blocking the binding of angiotensin II to the AT1 receptors present in many tissues (like vascular smooth muscle, adrenal gland). Both losartan and its metabolite LCA do not show any partial agonist activity at the AT1 receptors and have much greater affinity (about 1000‑fold) for the AT1 receptors than the AT2 receptors. LCA is more potent (10 to 40 times) by weight than losartan and is a reversible, noncompetitive inhibitor of the AT1 receptor. Losartan and LCA do not inhibit ACE (kininase II, angiotensin converting enzyme that converts angiotensin I to angiotensin II and degrades bradykinin). They do not bind to or block other hormone receptors or ion channels involved in cardiovascular regulation [2].
It is observed in clinical trials that losartan effectively lowers blood pressure as the other first line antihypertensive drugs [3]. Usually, LP is preferred in the management of essential hypertension because of lower incidence of side effects like cough. It is readily absorbed and via cytochrome P‑450 system it undergoes rapid hepatic metabolism to form an active metabolite, EXP‑3174 [4]. The active metabolite contributes to a great extent to its antihypertensive effect, which lasts over 24 h after once‑daily administration [5]. Its oral bioavailability is only 33%, while the remaining amount is excreted unchanged in faeces. This is due to its poor absorption in lower gastrointestinal tract and short elimination half‑life of 1.5‑2 h [6]. Angiotensin II receptor antagonists show improved safety profile than those of ACE inhibitors and there is growing supporting evidence for that [7].
FDA has defined bioequivalence as the absence of a significant difference in the rate and extent to which the active moiety in the drug products becomes available at the site action when administered at the same molar dose and under similar conditions [8]. The rising cost of medicines increases the overall cost of health care. Generic equivalents of branded or innovator drugs lower the cost of medication [9]. This saved about $8.8 billion or about 11% of expenditures on drugs for adults, in the United States each year at the same time providing quality [10]. In a study more than 50% of respondents were comfortable accepting a generic medication for a branded medication and didn’t mind when their pharmacist switched their prescriptions to a generic medication, while 30.5% disagreed to accept generic medication. About two‑thirds of prescriptions in the United States was generic drugs that provided 13% reduction in medication costs [11]. Due to increased demand, it is advisable that the pharmaceutical quality, safety, and efficacy of generics ought to be compared with the corresponding comparator product. “Orange Book” published by the FDA contains a list of approved drug products with therapeutic equivalents [12]. “In vivo equivalence” or “bioequivalence” studies are carried out to assess the “interchangeability” between the innovator and generic products [9].
The primary objective of this study is to demonstrate bioequivalence between the test product, losartan potassium tablets 100 mg of Micro Labs Ltd., India and the reference product, Cozaar® 100 mg of Merck and Co., INC., USA, under fasting condition in normal, healthy, adult, male and female human subjects, in a randomized crossover study.
Materials and Methods
Investigational medicinal products were procured from Micro Labs Ltd., Bangalore, India, which included the test product, losartan potassium tablets 100 mg of Micro Labs Ltd., India and the reference product, Cozaar® 100 mg of losartan potassium tablets of Merck and Co., INC., USA.
Ethics
The study was conducted with prior approval from the Institutional Ethics Committee (Protocol No: ARL/08/229, Approval Date: 17 Nov 2008) and according to the current version of the declaration of Helsinki (Ethical Principles for Medical Research Involving Human Subjects, Revised by World Medical Association General Assembly Tokyo, 2004), current ICH GCP guidelines, Indian Council of Medical Research (ICMR) guidelines and Central Drugs Standard Control Organization (CDSCO) guidelines. The informed consent form was obtained from each subject for his or her participation in the study.
Subjects
Sixty healthy volunteers (52 male and 8 female) with age (26.38±5.05 years), weight (58.25±7.48 kg) and height (164.02±7.25 cm) satisfying the inclusion and exclusion criteria were enrolled in the study, out of which 58 subjects completed the study. Prior to participation in the study all the volunteers underwent physical examination and general medical checkup. Pathological investigation was performed on blood and urine samples. ECG was taken for all volunteers. The volunteers were found to be healthy and with no history of cardiovascular, renal, hepatic, ophthalmic, pulmonary, neurological, metabolic, haematological, gastrointestinal, endocrine, immunological or psychiatric diseases. Subjects had no history of drug hypersensitivity and were not under any drug treatment. They were instructed to abstain from taking any medication one week prior to and during the study period.
Study design
The study was a randomized, open label, two‑sequence, two‑treatment, two‑period, crossover, single dose, bioequivalence study. The study was conducted in two periods separated by a wash out period of 7 days. All subjects were screened for the inclusion/exclusion criteria. These examinations included demographic data (age, height, weight), clinical history, physical examination including vital signs, 12 lead ECG, haemogram, biochemistry, serology (HIV, hepatitis B and hepatitis C), breath alcohol test and urine analysis. For female volunteers, in addition to the above tests, urine pregnancy test was done at the time of screening. Urine screen for drug of abuse was done before check‑in for each study period. Breath alcohol test was carried out before check‑in and before each ambulatory blood sample collection for each study period. For female volunteers, in addition to the above tests, serum ß‑HCG test was done before check‑in for each study period.
Randomization
The randomization for this two treatment, two period, two sequence cross‑over bioequivalence study was generated by the biostatistician using the PROC PLAN programme on statistical software SAS® 9.1.3. All the subjects were divided into blocks of equal size. Thus, random allocation of drug products was balanced over the period and sequence. In each period, subjects were administered either the test or the reference product, according to the randomization schedule. The analyst concerned, was blinded to the sequence of administration of test and reference product to the individual subjects.
Drug administration
Single oral dose of test or reference product was administered as per the randomization schedule with about 240 ml of water at ambient temperature in sitting position after an overnight fasting of at least 10.00 h. Compliance for dosing was assessed by a thorough check of the oral cavity by using a tongue depressor and torch immediately after dosing. Water was not accessible to the subjects 01.00 hour pre‑dose and post‑dose except about 240 ml of water given during drug administration in each study period. Subjects remained seated for the first 02.00 h post‑dose except for any procedural reason in each study period. Standardized meal was given to the subjects during check‑in night (in such way to maintain at least 10.00 h pre‑dose fasting) and at around 04.00, 09.00 and 13.00 h post‑dose in each study period.
Blood sample collection and processing
A total of 29 blood samples (6 ml each) were collected in vacutainers containing sodium heparin as anticoagulant through an indwelling cannula at pre‑dose (within 1 h prior to dosing), and at 0.16, 0.33, 0.50, 0.75, 1.00, 1.25, 1.50, 1.75, 2.00, 2.33, 2.67, 3.00, 3.33, 3.67, 4.00, 4.33, 4.67, 5.00, 5.50, 6.00, 7.00, 8.00, 10.00, 12.00, 16.00, 20.00, 24.00 and 36.00 h post‑dose within ±2 min of scheduled sampling time. Before every blood sample collection 0.2 ml of blood present in the intravenous cannula was discarded during the use of intravenous cannula. Also after every blood sample collection, 0.2 ml of heparinised saline (by mixing 1 ml of 5000 IU of heparin with 500 ml of normal saline) was injected into the intravenous cannula. After collection, blood samples were centrifuged immediately to separate plasma. Blood samples were centrifuged at 5±3°, at 3500 rpm for 10 min. Plasma was separated and placed in suitable labeled vials in two aliquots one as analytical sample and the other as control sample. All plasma samples were stored upright below −50° until the analysis of the samples.
Assessment of safety
The principal investigator monitored safety data throughout the course of the study. A qualified medical officer experienced in conducting bioequivalence study was available during housing in the clinical center. Subjects were monitored throughout the study period for occurrence of adverse events. Subjects experiencing any adverse event were followed up until their resolution. Subjects who at least received one dose of the study medication were included in the safety analysis.
Analytical method
The analysts were blinded to the sequence of administration of test and reference products to the individual subjects. The plasma samples were stored in labeled vials, which were not identified by product details. Losartan, its metabolite LCA and internal standard were extracted from human plasma by solid phase extraction. A total of 3359 plasma samples were analyzed for the content of Losartan and its metabolite, LCA by a validated LC/MS/MS method. The method of analysis was validated according to international guidelines.
The standard curves were linear in the measured range from 15.373 ng/ml to 2506.103 ng/ml for losartan and 15.234 ng/ml to 2483.464 for LCA. Overall precision (expressed as % CV) of calibration standards were better than or equal to 6.80%, 5.66%, respectively and accuracy (expressed as % nominal) ranged from 95.89‑102.08%, 94.23‑103.40%, respectively for all concentrations. The validated lower limit of quantification was 15.373 and 15.234 ng/ml, respectively for the determination of losartan and LCA in human plasma.
For losartan and LCA the overall precision (expressed as % CV) of quality control samples ranged from 4.99‑6.12%, 5.88‑7.23%, respectively and accuracy (expressed as % nominal) ranged from 97.63‑101.82%, 96.36‑98.27%, respectively for all concentrations.
Pharmacokinetic and statistical analysis
Al1 the statistical analysis was performed using SAS® 9.1.3. The plasma concentrations at each sampling time points were tabulated for individual subject and product combination, together with descriptive statistics. All the below limit of quantitation (BLQ) values were considered as zero for the computation of pharmacokinetic parameters and statistical calculations. MS (missing sample) and MSV (missing sample values) were given an arbitrary code as 999999 in calculation of pharmacokinetic parameters using SAS. The mean plasma concentration of losartan and LCA versus time profiles for each product was presented graphically on both the scales i.e. on the untransformed and log‑transformed data. The actual blood sampling time point were considered for the calculation of pharmacokinetic parameters Cmax, AUC0‑t and AUC0‑∞, using SAS® 9.1.3.
ANOVA was performed (at P=0.05) on the log‑transformed pharmacokinetic parameters Cmax, AUC0‑t and AUC0‑∞ for losartan. The analysis of variance model included sequence, subjects nested within sequence, period and treatment as factors. Each analysis of variance also included calculation of least‑square means, adjusted differences between formulation means and the standard error associated with these differences. The significance of the sequence effect was tested using the subjects nested within the sequence as the error term. The 90% confidence intervals for the difference between treatments, geometric means (GM) were calculated for log‑transformed Cmax, AUC0‑t and AUC0‑∞. The confidence interval was expressed as a percentage relative to the least square mean (LSM) of the reference treatments. The geometric least square mean ratios of the test and reference product of losartan and its 90% confidence interval on the log‑transformed pharmacokinetic parameters Cmax, AUC0‑t and AUC0‑∞ were computed and bioequivalence was concluded if the confidence interval lie within the acceptable range of 80‑125%.
The pharmacokinetic parameters were determined from the plasma concentration‑time data using non compartmental model in SAS® 9.1.3. The maximum plasma concentration Cmax, and the time of its occurrence tmax, was compiled from the concentration‑time data. The AUCo‑t was measured to the last quantifiable concentration, using trapezoidal rule and was extrapolated to infinity according to the equation: AUC0‑∞=AUC0‑t+Ct/Kel, where, AUC0‑∞ is the area under the plasma concentration‑time curve from time ‘0’ to ‘infinite’, Ct is the last measurable drug concentration and Kel is the elimination rate constant. The analysis of LCA was considered for profiling purpose only.
Results and Discussion
From 60 subjects enrolled into the study, 58 completed it and their results were analyzed and used for pharmacokinetic and statistical analysis. One subject was withdrawn from the study in Period‑I after 3.00 h blood sample collection due to occurrence of adverse events of vomiting. Another subject did not report on the enrolment day of Period‑II due to personal reason.
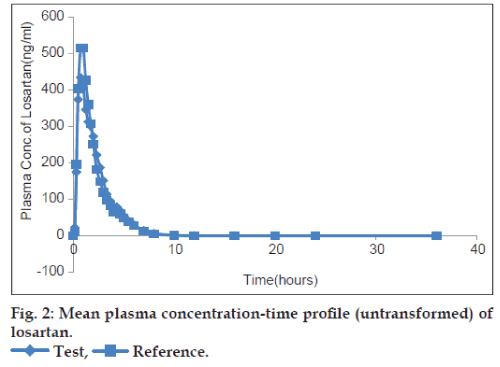
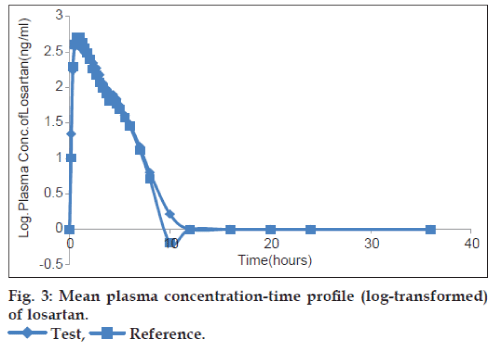
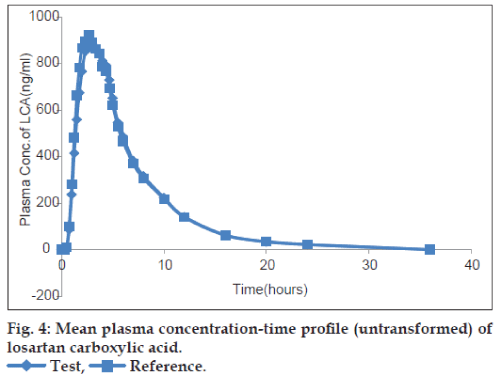
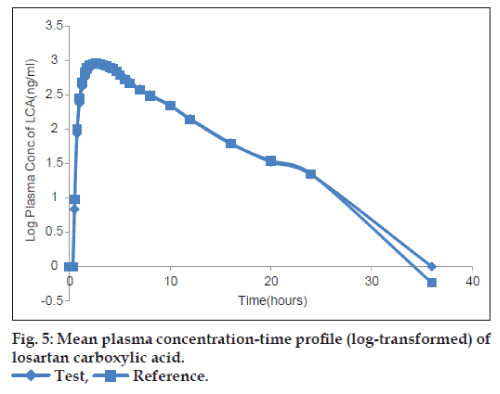
The plots of the mean plasma concentration‑time profile over 36 h sampling period after drug administration are presented in figs. 2‑5 for both untransformed and log‑transformed data for losartan and LCA. The plasma concentrations of losartan and LCA did not differ significantly after administration of both formulations, i.e. test and reference tablet of losartan potassium. The pharmacokinetic parameters and statistical evaluation of losartan are summarized in Table 1. No significant differences in pharmacokinetic parameters were observed between the test and reference formulations. The mean AUC0‑t/AUC0‑∞ ratio of losartan for the test and reference products were 95.38% and 95.83%, respectively and of LCA were 96.31% and 95.89%, respectively.
| Parameter (unit) | Losartan (Mean±SD) | LCA (Mean±SD) | ||
|---|---|---|---|---|
| Test | Reference | Test | Reference | |
| Cmax (ng/ml) | 759.71±395.54 | 799.31±403.25 | 1118.29±425.22 | 1100.65±475.34 |
| tmax (h) | 1.36±0.81 | 1.12±0.62 | 2.89±1.05 | 2.68±0.98 |
| AUC0-t (ng.h/ml) | 1053.93±348.30 | 1067.71±356.07 | 5997.21±1935.87 | 6046.17±2070.81 |
| AUC0-∞ (ng.h/ml) | 1101.57±352.21 | 1111.05±362.76 | 6155.87±1958.13 | 6225.71±2069.52 |
| AUC0-t/AUC0-∞(%) | 95.38±2.37 | 95.83±1.90 | 96.31±8.51 | 95.89±9.94 |
| kel | 0.48±0.17 | 0.51±0.16 | 0.17±0.03 | 0.15±0.04 |
| t1/2 (h) | 10.68±0.82 | 10.50±0.53 | 4.33±1.32 | 5.22±3.65 |
LCA is Losartan carboxylic acid, SD is standard deviation for n=58 observations. AUC: area under the curve
Table 1: Pharmacokinetic parameters of losartan and losartan carboxylic acid.
The 90% confidence intervals for the intra‑individual ratios (test/reference) for AUC0‑t, AUC0‑∞ and Cmax of losartan are presented in Table 2. In accordance with the study protocol, the hypothesis of bioequivalence of the formulations was accepted if the 90% confidence interval of the ratio of geometric means of test to reference product was within the acceptance range of 80‑125% for log‑transformed Cmax, AUC0‑t and AUC0‑∞ for losartan. No median difference was registered concerning tmax of both products. The multivariate analysis accomplished through ANOVA for the assessment of sequence, period and treatment effects for log‑transformed pharmacokinetic parameters AUC0‑t, AUC0‑∞ and Cmax of Losartan is represented in Table 3. It reveals the absence of any of these effects in the present study, indicating that the crossover design was properly performed.
| PK parameters | Geometric mean | T/R (%) | 90% CI | Power | ISCV (%) | ||
|---|---|---|---|---|---|---|---|
| Test | Reference | Lower | Upper | ||||
| Cmax (ng/ml) | 665.23 | 707.68 | 94.00 | 84.89 | 104.09 | 94.83 | 33.72 |
| AUC0-t (ng.h/ml) | 998.71 | 1005.97 | 99.28 | 95.84 | 102.84 | 100 | 11.36 |
| AUC0-∞ (ng.h/ml) | 1047.46 | 1049.74 | 99.78 | 96.43 | 103.25 | 100 | 11.01 |
Geometric mean has been taken as the antilog (exponential) of the least square mean of the log-transformed data. T/R: Test/reference, CI: confidence interval,AUC: area under the curve, ISCV: intra-system coefficients of variation
Table 2: 90% ci of the log-transformed cmax, auc0-t and auc0-∞ for losartan.
| Variation | P value | ||
|---|---|---|---|
| source | Log Cmax | Log AUC0-t | Log AUC0-∞ |
| Sequence | 0.6503 | 0.6401 | 0.6810 |
| Period | 0.3749 | 0.8270 | 0.9545 |
| Treatment | 0.3147 | 0.7321 | 0.9154 |
Table 3: Anova pvalue for log-transformedparameters of losartan
Both formulations of losartan potassium were well tolerated and the adverse events were usually mild to moderate and transient. A total of 17 adverse events were reported in both the study periods. A1l the adverse events were expected and definitely related to the study drug, were mild to moderate in severity and were resolved within the clinical phase of the study. No serious adverse events were observed during both the periods of the study. The laboratory values observed out of reference range were evaluated on the basis of clinical correlation.
Statistical comparison of AUC0‑t, AUC0‑∞ and Cmax clearly indicated that there was no significant difference between the test product, losartan potassium tablets 100 mg and the reference product, Cozaar® 100 mg tablets in terms of rate and extent of absorption under fasting condition. The 90% confidence intervals for the mean ratio (T/R) of AUC0‑t, AUC0‑∞ and Cmax were entirely within the FDA acceptance range. Based on the pharmacokinetic and statistical results of this study, we can conclude that the two products are bioequivalent, and can be considered interchangeable in medical practice.
Acknowledgements
We thank the Accutest Research Lab (I) Pvt. Ltd., Ahmedabad, India for providing their facilities for the conduct of this study.
References
- Whitworth JA, World Health Organization, International Society of Hypertension Writing Group. WHO/ISH Statement on management of Hypertension. J Hypertens 2003;21:1983-92.
- Losartan Potassium Tablet Prescribing information. Lupin Pharmaceuticals, Inc. Revised: 02/2011 Available from: http://www.dailymed.nlm.nih.gov/dailymed/lookup.cfm?setid=e5886220-43b7-46e1-9034-5242ba245bd1).[Last revised on 2011 Feb 28].
- Michael W. Clinical Safety and Tolerability of Losartan. Clin Ther 1977;4:604-16.
- Aghera NJ, Shah SD, Vadalia KR. Formulation and Evaluation of Sublingual Tablets of Losartan Potassium. Asian Pacific J Tropical Disease 2012;2:S130-5.
- Koytcheva R, Ozalpb Y, Erenmemisogluc A, Van der Meerd MJ, Alpanb RS. Combination of Losartan and Hydrochlorothiazide: In vivo Bioequivalence. Arzneimittelforschung 2004;54:611-7.
- Samyuktha M, Vasanth PM, Suresh K, Ramesh T, Ramesh M. Formulation and Evaluation of Gastroretentive Floating Tablets of Losartan Potassium. Int J Biopharm 2013;4:18-26.
- Dickstein K. The Role of Losartan in the Management of Patients with Heart Failure. Clin Ther 2001;9:1456-77.
- USFDA- Guidance for Industry: Bioavailability and Bioequivalence Studies for Orally Administered Drug Products-General Considerations 2003.
- Midha KK, McKay G. Bioequivalence; Its History, Practice, and Future. AAPS J 2009;11:664-70.
- Haas JS, Phillips KA, Gerstenberger EP, Seger AC. Potential Savings from Substituting Generic Drugs for Brand-Name Drugs:Medical Expenditure Panel Survey, 1997-2000. Ann Intern Med 2005;142:891-7.
- Shrank WH, Cox ER, Fischer MA, Mehta J, Choudhry NK. Patients’ Perceptions of Generic Medications. Health Aff (Millwood) 2009;28:546-56.
- Orange Book. Available from: http://www.accessdata.fda.gov/scripts/cder/ob/default.cfm. [Last accessed on 2013 Mar 14].
