- Corresponding Author:
- Alice Varghese
Shobhaben Pratapbhai Patel, School of Pharmacy and Technology Management, SVKM’s NMIMS, Vile Parle (W), Mumbai−400 056, India
E−mail: alicevarghese02@gmail.com
| Date of Submission | 30 October 2013 |
| Date of Revision | 27 January 2014 |
| Date of Acceptance | 01 Febraury 2014 |
| Indian J Pharm Sci 2014;76(2):138-147 |
Abstract
Terminalia arjuna Wight and Arn. (Combretaceae) is a tree having an extensive medicinal potential in cardiovascular disorders. Triterpenoids are mainly responsible for cardiovascular properties. Aqueous, hydroalcoholic and alcoholic extract of T. arjuna, arjunic acid and arjungenin were examined for their potential to inhibit CYP1A enzyme in rat and human liver microsomes. IC 50 values of aqueous, hydroalcoholic and alcoholic extract of T. arjuna was found to be 11.4, 28.9 and 44.6 μg/ml in rat liver microsomes while 30.0, 29.7 and 39.0 μg/ml in human liver microsomes, respectively for CYP1A. However IC 50 values of arjunic acid and arjungenin for both rat liver microsomes and human liver microsomes were found to be >50 μM. Arjunic acid and arjungenin did not show inhibition of CYP1A enzyme up to concentrations of 50 μM. These in vitro data indicate that Terminalia arjuna extracts contain constituents that can potently inhibit the activity of CYP1A, which could in turn lead to undesirable pharmacokinetic drug-herb interactions in vivo. Based on the in vitro data, interaction potential of the aqueous extract of Terminalia arjuna orally in rats was investigated. A probe substrate, phenacetin, was used to index the activity of CYP1A. In vivo pharmacokinetic study of coadministration of aqueous extract of Terminalia arjuna and phenacetin, revealed that the aqueous extract did not lead to any significant change in the pharmacokinetic parameters of phenacetin as compared with control group. Though there was no in vivo-in vitro correlation, drug interactions could arise with drugs having a narrow therapeutic range and extensively cleared by CYP1A enzyme, which could lead to undesirable side effects.
Keywords
Terminalia arjuna, CYP1A interaction, liver microsomes, drug–herb interaction.
Terminalia arjunaWight and Arn. (Combretaceae) is a tree with a wide varied pharmacological activity like hypercholesterolemic, hypolipidemic, anticoagulant, antihypertensive, antithrombotic, antiviral, antifungal and antibacterial agent[1,2]. Terminalia’s active constituents include tannins, cardenolide, triterpenoid saponins (arjunic acid (AA), arjunolic acid, arjungenin (AG), arjun glycosides), flavonoids (arjunone, arjunolone, luteolin), gallic acid, ellagic acid, oligomeric proanthocyanidins, phytosterols, calcium, magnesium, zinc and copper[3].
The most versatile enzyme system involved in the metabolism of xenobiotics is cytochrome P450 (CYP). Inhibition of these enzymes often results in unexpected and sometimes severe adverse drug interactions, as the metabolic clearance of coadministered drugs can be altered dramatically[4]. Inhibition of CYP enzymes can also be affected by natural products. CYP family consists of a number of isoforms, which includes 3A, 2C, 2D, 2E and 1A. Out of all, CYP1A2 constitutes 13% of the total CYP content in the liver and plays an important role in the metabolic clearance of approximately 5% of currently marketed drugs. Human CYP1A2, a member of the CYP mixed function oxidase system, is one of the important enzymes involved in the metabolism of xenobiotics in the body. The actions of human CYP1A2 may partly account for the carcinogenic effects of burned foods and cigarette smoke. Burning these substances alters amino acids and carbohydrates, producing heterocyclic amines. Many studies have reported inhibition data on CYP1A2 by many different herbs. For example, St John’s wort, the components of Ginkgo biloba and flavonoids extracted from plants could decrease the activation of CYP1A2[5,6].
The objective of the present study was to evaluate the CYP1A inhibition potential of aqueous, hydroalcoholic and alcoholic extract of T. arjuna bark, AA and AG (triterpenoids) in rat liver microsomes (RLM) and human liver microsomes (HLM).
Materials and Methods
All the solvents, chemicals and reagents used were of analytical grade and purchased locally. Phenacetin, paracetamol and diclofenac were purchased from Sigma−Aldrich Ltd. Nicotinamide adenine dinucleotide phosphate reduced tetrasodium salt (NADPH) was purchased from SRL Labs Pvt. Ltd. HPLC grade acetonitrile was purchased from Thermo Fischer Scientific India Pvt. Ltd. AA and AG were purchased from Natural Remedies, Bangalore, India. HLM was purchased from Invitrogen Services. HPLC system consisted of a Shimadzu LC 2010, with an autosampler, PDA detector using LC Solutions® software.
Preparation of solutions
Fresh bark of T. arjunawas purchased from Zandu Foundation, Gujarat, India. Roots were identified at the Piramal Life Sciences Ltd. and authenticated at the Agharkar Research Institute, Pune with a voucher specimen (S/B 104) deposited for further reference. Collected fresh bark was dried and powdered. Aqueous, hydroalcoholic and alcoholic extracts were prepared individually by cold maceration techniques using water, water:alcohol (1:1) and alcohol, respectively. The alcoholic and hydroalcoholic extract was evaporated to dryness by rotary vacuum evaporator, yielding a brown crystalline powder. The aqueous extract was prepared by lyophilisation, which yielded a whitish brown free−flowing powder. The extracts were stored in desiccators until use. Stock solutions of alcoholic, hydroalcoholic and aqueous extracts of T. arjunawere prepared in alcohol, alcohol:water (1:1) and dimethyl sulfoxide (DMSO), respectively, at a concentration of 20 mg/ml. Stock solutions of AA and AG were also prepared in methanol to yield a solution of concentration 10 mM. Stock solutions of probe substrate, phenacetin was prepared in methanol at concentration 12 and 30 mM, alpha−napthoflavone was used as positive control, which was prepared in methanol at concentration of 6 mM. Phosphate buffer (100 mM) of pH 7.4 was used to make NADPH solution (10 mM).
Estimation of content of arjunic acid and arjungenin by RP-HPLC
Aqueous, hydroalcoholic and alcoholic extracts of T. arjuna were standardised using RP−HPLC. AA and AG stock solutions of 1 mg/ml were prepared individually in methanol. Stock solutions were further diluted to concentrations in the range of 5−100 μg/ml. Accurately, 10 mg of alcoholic extract was sonicated in 1 ml methanol, hydroalcoholic extract was sonicated in 1 ml water:methanol (1:1) and 10 mg of aqueous extract was sonicated with 1 ml water for 10 min. The resulting solutions were filtered through 0.45 μ syringe filter. The resulting solutions were subjected to RP−HPLC analysis. The analysis was repeated two times (n=2) by comparing and interpolating the extract peak area (response) with that of the standard AA and AG from the calibration curve. HPLC method used was a reported method modified to suit our laboratory[7]. Samples were run on a Kromasil C18 column 5 μ (4.6×150 mm) and mobile phase used was (A) 0.01N potassium phosphate buffer (pH adjusted with orthophosphoric acid to 2.5) and (B) HPLC grade acetonitrile and was pumped at a flow rate of 1 ml/min. The gradient program used was time: %/B–0/30; 18/60; 20/85; 22/85; 25/30; 30/30. Detection of AA and AG was accomplished by ultraviolet (UV) absorbance at a wavelength of 205 nm.
CYP1A inhibition assay
RLM were collected inhouse and protein concentration was determined[8], while HLM was purchased from the authentic vendor. RLM and HLM were used for assessing the inhibition potential of aqueous, alcoholic and hydroalcoholic extract of T. arjuna (1−100 μg/ml) and AA and AG (1−50 μM) by estimating phenacetin−o−deethylation activity and the inhibition potential was compared with the positive control α−naphthoflavone (known CYP1A inhibitor in rats and humans). α−Naphthoflavone was incubated at a concentration of 0.1 μM in HLM and 30 μM in RLM, which inhibited phenacetin metabolism by 50%. Briefly, a standard 100 μl incubation mixture contained liver microsomes (1 mg/ml protein concentration), phenacetin [Km value: 60 μM in RLM and 150 μM in HLM] [9] in 0.1 M sodium phosphate buffer pH 7.4 at 37° was incubated for 1 h, in duplicate. The reactions were initiated with NADPH (final concentration 1 mM) and then terminated with 50 μl of internal standard diclofenac (50 μg/ml) in methanol. The samples were centrifuged at 4000 rpm for 10 min at 4° and the supernatant were subjected to RP−HPLC analysis. RP−HPLC method was slightly modified to suit our laboratory conditions[10]. Samples were run on a C18 column and mobile phase used was (A) water and (B) acetonitrile and was pumped at a flow rate of 1 ml/min. The gradient program used was time/%B–0/10; 5/80; 10/95; 12/10; 15/10. Detection of paracetamol, phenacetin and diclofenac was accomplished by UV absorbance at a wavelength of 240 nm. Modulatory effects of aqueous, alcoholic and hydroalcoholic extract of T. arjuna, AA and AG were evaluated by incubation of RLM and HLM, phenacetin with or without herbal compounds. Solutions of different concentration of the aqueous, alcoholic and hydroalcoholic extract of T. arjuna, AA and AG were prepared in methanol. Negative control incubations with methanol and positive control incubations with α−naphthoflavone were run simultaneously. In all the incubations, organic content was not more than 1% v/v. The formation of paracetamol was subsequently quantified using RP−HPLC. Retention times for paracetamol, diclofenac and phenacetin were 5.7, 7.7 and 9.1 min, respectively. Percent inhibition produced by aqueous, alcoholic and hydroalcoholic extracts of T. arjuna, AA and AG to inhibit deethylation of phenacetin was calculated using the formula, % inhibition =(AR control−AR sample)/AR control×100, where AR control is the area ratio of paracetamol/diclofenac in negative control (solvent), AR sample is the area ratio of paracetamol/diclofenac in presence of aqueous, methanol and hydromethanol extracts of T. arjuna/AABased on in vitro studies, in vivo study and AG. IC50< values were calculated using GraphPad Prism®.
In vivo pharmacokinetic study design
Male Wistar rats were randomly divided into four groups of n=6. The effect of T. arjuna extract on pharmacokinetics (PKs) of phenacetin was evaluated at two doses of phenacetin (100 and 200 mg/kg). Group I: Animals were orally administered 0.5% sodium carboxymethyl cellulose for 7 days; Group II: Animals were orally administered aqueous extract of T. arjunafor 7 days at a dose of 250 mg/kg[11] (aqueous extract suspended in 0.5% sodium carboxymethyl cellulose); Group III: Animals were orally administered 0.5% sodium carboxymethyl cellulose for 7 days; Group IV: Animals were orally administered aqueous extract of T. arjunafor 7 days at a dose of 250 mg/kg (aqueous extract suspended in 0.5% sodium carboxymethyl cellulose).
Twenty−four hours after the last dose, animals of Group I and II were administered with a single oral dose of phenacetin (100 mg/kg suspended in 0.5% sodium carboxymethyl cellulose), while animals of Group III and IV were administered with a single oral dose of phenacetin (200 mg/kg). Groups I and III served as control groups for group II and IV, respectively. Whole blood samples (500 μl) were withdrawn from the retro orbital sinus at 0, 0.083, 0.25, 0.5, 1, 2, 4, 6 and 24 h after phenacetin administration. Disodium ethylenediaminetetraacetic acid (EDTA) was used as the anticoagulant. The blood samples were centrifuged at 4000 rpm for 10 min at 4° and plasma was separated and stored at −20° until RP−HPLC analysis was carried out.
Plasma sample preparation and analysis
A plasma sample (100 μl) was spiked with 10 μl of diclofenac (internal standard). Samples were then vortex−mixed for 1−2 min and extracted with 1 ml ethyl acetate after vortex−mixing for 5 min. Liquid–liquid extraction technique using ethyl acetate for extraction was followed, since ethyl acetate gave maximum percent recovery of phenacetin, as compared with the other solvents tried. The recovery efficiency of phenacetin from rat plasma samples using ethyl acetate was found to be 87.5±11.2%. After centrifugation at 4000 rpm at 4° for 10 min, the upper organic layer was separated and evaporated to dryness at 30° in a nitrogen evaporator under a gentle stream of nitrogen. The residue was reconstituted with 100 μl mobile phase (water:acetonitrile in the ratio 1:1), centrifuged and the supernatant was subjected to RP−HPLC analysis with Injection volume of 50 μl.
Results
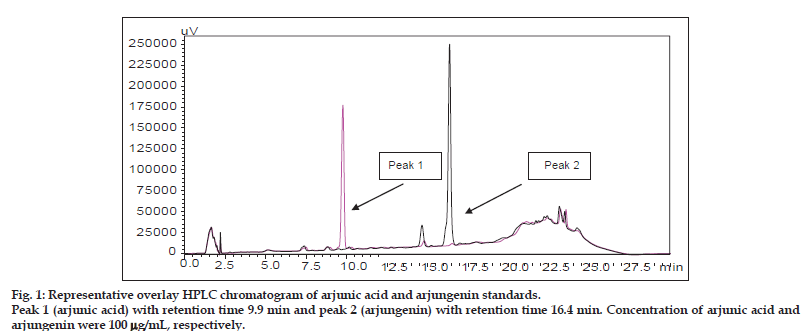
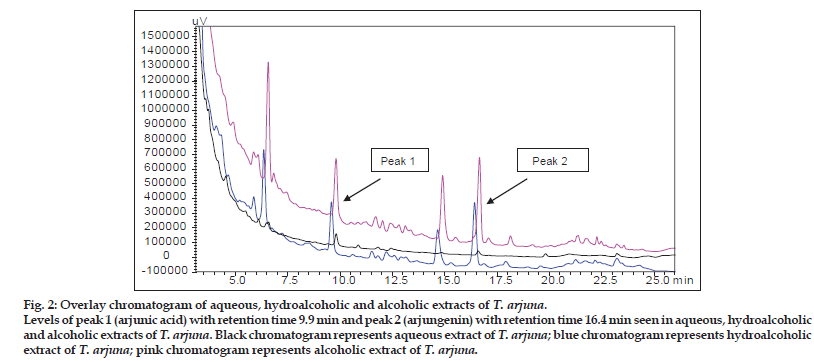
Percent content of arjunic acid and arjungenin in aqueous, alcoholic and hydroalcoholic extracts: Linearity of the calibration curves of AA and AG was tested by linear regression analysis and found to be linear in the concentration range 5−100 μg/ ml with good correlation between concentration and peak area with a correlation coefficient (r2) of more than 0.99. The peaks of AA and AG in the extracts were identified by comparing retention times of reference AA and AG. The amount of AA in alcoholic, hydroalcoholic and aqueous extracts was estimated to be about 0.4442±0.005, 0.2910±0.0063 and 0.0262±0.002% w/w, respectively. The amount of AG in alcoholic, hydroalcoholic and aqueous extracts was estimated to be about 0.4400±0.017, 0.2985±0.003 and 0.089±0.0005% w/w, respectively. Figs. 1 and 2 represent the HPLC chromatogram of standard, AA and AG and overlay chromatogram of standards present in aqueous, hydroalcoholic and alcoholic extracts of T. arjuna. AA is freely soluble in methanol and insoluble in water, whereas AG is freely soluble in methanol and insoluble in hexane. AA and AG are triterpenoid saponins, which make them nonpolar in nature, thus explaining the difference in its levels in alcoholic, hydroalcoholic and aqueous extracts. Water being the most polar solvent, showed least extraction of the nonpolar triterpenoid saponins.
| IC50< values (µg/ml) | ||
|---|---|---|
| Test sample | RLM | HLM |
| Aqueous extract | 11.4±7.43 | 30.0±0.05 |
| Hydroalcoholic extract | 28.9±5.98 | 29.7±1.48 |
| Alcoholic extract | 44.6±9.9 | 39.0±2.10 |
,p>Table 1: IC 50< values of extracts of t. Arjuna for cyp1a enzyme in rlm and hlm
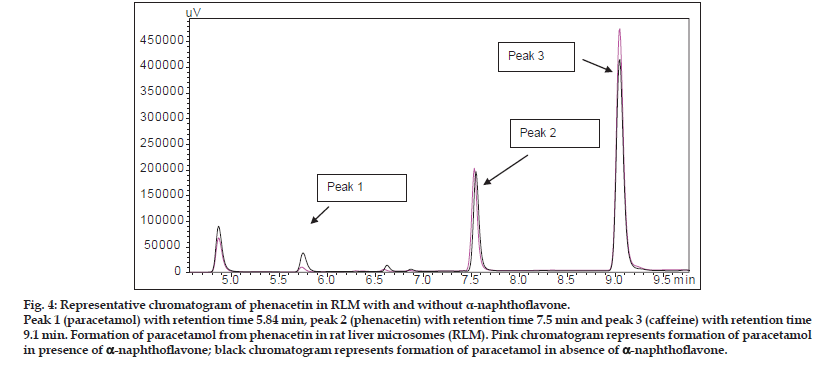
Peak 1 (paracetamol) with retention time 5.84 min, peak 2 (phenacetin) with retention time 7.5 min and peak 3 (caffeine) with retention time 9.1 min. Formation of paracetamol from phenacetin in rat liver microsomes (RLM). Pink chromatogram represents formation of paracetamol in presence of a-naphthoflavone; black chromatogram represents formation of paracetamol in absence of a-naphthoflavone.
| Test sample | RLM | HLM |
|---|---|---|
| Arjunic acid | >50 | >50 |
| Arjungenin | >50 | >50 |
Table 2: Ic50 Values Of Arjunic Acid And Arjungenin For Cyp1a Enzyme In Rlm And Hlm.
In vitro CYP1A inhibition assay
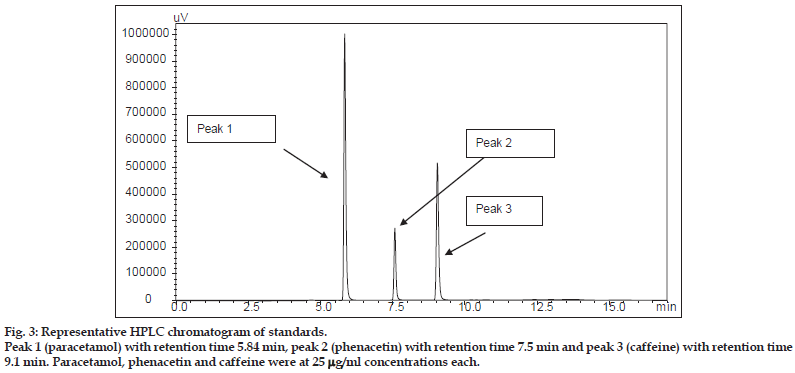
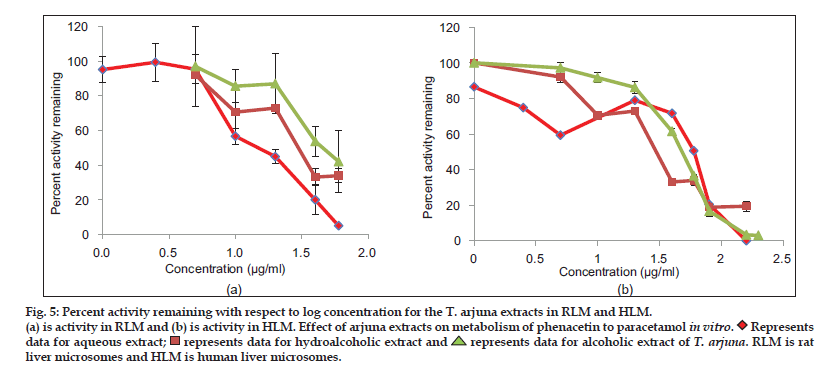
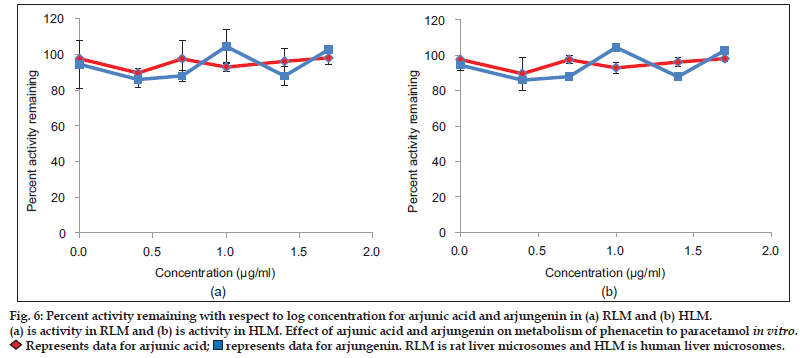
Aqueous, hydroalcoholic and alcoholic extracts of Terminalia arjuna (1−100 μg/ml) and AA and AG (1−50 μM) were evaluated for the CYP1A inhibitory activity in both RLM and HLM (n=2). Figs. 3 and 4 show a representative chromatogram of paracetamol, phenacetin and diclofenac (IS) standards and sample spiked in microsomes, respectively. The IC50 values of aqueous, hydroalcoholic and alcoholic extract of T. arjuna, AA and AG individually, in RLM and HLM are summarised in Tables 1 and 2, respectively. The data is also graphically represented in (figs. 5 and 6). IC50< values of aqueous, hydroalcoholic and alcoholic extract of T. arjunawas found to be 11.4, 28.9 and 44.6 μg/ml in RLM while 30.0, 29.7 and 39.0 μg/ml in HLM, respectively for CYP1A. Results indicate that with increasing concentrations of extracts there was a significant inhibition of phenacetin metabolism to paracetamol in both RLM and HLM, indicating that the constituents in the extracts inhibit CYP1A enzyme in RLM and HLM in a concentration−dependent manner. Difference in IC50< values is due the difference in phytoconstituents and levels of the phytoconstituents in the herbal extracts. However, IC50< values of AA and AG for both RLM and HLM were found to be >50 μM, respectively. IC50< values <100 μg/ml for herbal extracts and <10 μM for active constituents are considered to be potent inhibitors of CYP enzymes[9]. Results indicate that there is a significant inhibition of CYP1A in RLM and HLM by all the three crude extracts of Terminalia arjuna.
(a) is activity in RLM and (b) is activity in HLM. Effect of arjuna extracts on metabolism of phenacetin to paracetamol in vitro.
 Represents
data for aqueous extract;
 represents data for hydroalcoholic extract and
 represents data for alcoholic extract of T. arjuna. RLM is rat
liver microsomes and HLM is human liver microsomes.
(a) is activity in RLM and (b) is activity in HLM. Effect of arjunic acid and arjungenin on metabolism of phenacetin to paracetamol in vitro.
 Represents data for arjunic acid;
 represents data for arjungenin. RLM is rat liver microsomes and HLM is human liver microsomes.
| Parameter | Phenacetin (100 mg/kg) | Phenacetin (200 mg/kg) | ||
|---|---|---|---|---|
| Vehicle treated | Aqueous extract treated | Vehicle treated | Aqueous extract treated | |
| ke (h−1) | 0.33±0.05 | 0.27±0.07 | 0.28±0.06 | 0.38±0.14 |
| t1/2 (h) | 2.07±0.34 | 2.56±0.85 | 2.43±0.61 | 1.81±0.94 |
| Cmax | 31.23±3.9 | 37.94±10.1 | 44.6±2.80 | 43.22±8.33 |
| (µg/ml) | ||||
| tmax (h) | 0.5±0.0 | 0.4±0.14 | 0.6±0.22 | 0.9±0.20 |
| AUC0-24h (µg/hml) | 155.55±26.24 | 185.61±83.61 | 240.02±13.44 | 234.54±88.04 |
Table 3: Pharmacokinetic Parameters Of Phenacetin For Each Group.
In vivo pharmacokinetic interaction study
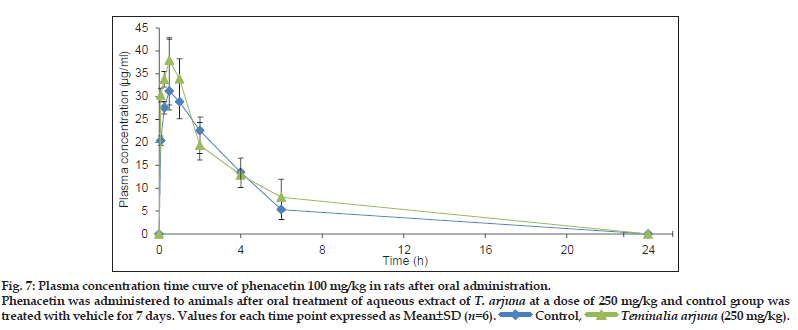
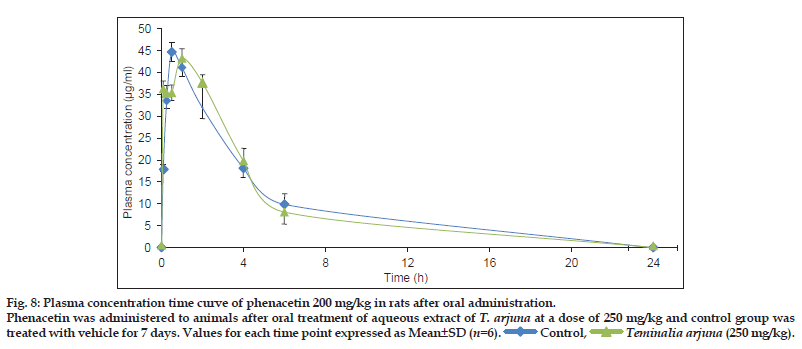
Based on in vitro studies, in vivo study in rats was performed to evaluate the interaction potential of aqueous extract of T. arjuna on CYP1A in rats. This was achieved by comparing the PK parameters (area under curve (AUC), peak plasma concentration (Cmax), apparent elimination half life (tmax), apparent elimination rate constant (ke) and half−life (t1/2)] of CYP1A specific probe substrate, phenacetin, at a dose of 100 and 200 mg/kg, p.o.[12] when administered alone and after oral administration of aqueous extract of T. arjunaat dose of 250 mg/kg, p.o. for 7 days. PK parameters for each group were calculated by Winnonlin software® are summarised in Table 3. PK parameters of phenacetin in rats treated and untreated with aqueous extract ofT. arjuna were not significantly different. Plasma concentration time profile of phenacetin (100 and 200 mg/kg) in rats treated and untreated with aqueous extract of T. arjuna is shown in (figs. 7 and 8). Hence the in vivo PK study indicates no CYP1A interaction of aqueous extract of T. arjuna in male Wistar rats.
Discussion
Terminalia arjuna (ROXB.) (Wight and Arnot) is an Indian medicinal plant belonging to the family Combretaceae and is known to be useful in a variety of diseases, including the clinical condition matching congestive heart failure since 500 BC[13]. Many important biologically active chemical compounds have been isolated from T. arjuna. These include triterpenoids (arjunolic acid, AA, AG, arjunoglucoside), tannins (ellagic acid, gallic acid), flavonoids (leucocyanidin, luteolin) and minerals (magnesium, calcium, zinc and copper)[14]. It has been extensively studied in animal models to demonstrate cardioprotective properties, ranging from positive inotropic, hypolipidemic, coronary vasodilatory and antioxidant effects to induction of stress protein in heart. A number of clinical studies have also reported its beneficial effects in patients of chronic stable angina, endothelial dysfunction, heart failure and even ischemic mitral regurgitation[15]. Various extracts (water, hydroalcohol and alcohol) of the stem bark of T. arjuna and active compounds present in these extracts have been investigated in many experimental studies and has been reported to exhibit blood pressure (BP)−lowering effects[16], direct cardioprotective effects in terms of induction of myocardial heat shock protein[17], antioxidant activities[18], antiplatelet effects[19], hypolipidemic[20] and antiatherogenic effects[21].
Phenacetin was administered to animals after oral treatment of aqueous extract of T. arjuna at a dose of 250 mg/kg and control group was
treated with vehicle for 7 days. Values for each time point expressed as Mean±SD (n=6).
 Control,
  Teminalia arjuna (250 mg/kg).
Phenacetin was administered to animals after oral treatment of aqueous extract of T. arjuna at a dose of 250 mg/kg and control group was
treated with vehicle for 7 days. Values for each time point expressed as Mean±SD (n=6).
 Control,
  Teminalia arjuna (250 mg/kg).
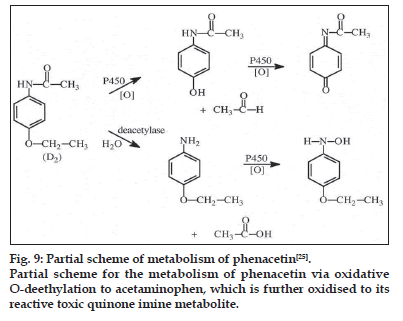
The use of herbs as alternative and complementary therapy has increased worldwide. Patients taking herbs together with prescribed Western medication are at a potential risk of herb–drug interactions. Some patients self−medicate with several different herbs and herbal preparations without their doctor’s recommendation[22]. However, until now there has been no requirement to evaluate the potential for drug interactions, adverse effects, toxicity or even death from using dietary supplements by dietary supplement manufacturers. Therefore, the risk of herb–drug interactions is increasing[23]. CYP1 family members, CYP1A1, CYP1A2 and CYP1B1, which are under the transcriptional regulation of the AhR receptor, are known for their induction by and catalysis of the ubiquitous polyaromatic hydrocarbons present in cigarette smoke, industrial dyes and agricultural pesticides. Expressed in different amounts in the liver (CYP1A2) and extrahepatic 11 organs (CYP1A1 and CYP1B1) these enzymes in particular CYP1A1 and CYP1B1 catalyse critical conversions to form the ultimate carcinogen[24]. Phenacetin is a recommended probe substrate for CYP1A for in vitro and in vivo interaction studies. Phenacetin has been found to be almost exclusively metabolised by CYP1A2 to its metabolite paracetamol (fig. 9)[25]. An understanding of CYP1A regulation is important for determining and assessing chemical carcinogenesis.
Treatment of cardiovascular diseases requires more than one drug and is usually life−long. If T. arjuna has to be established in the treatment of any of these conditions, it has to be as an adjunct therapy. In recent years, there have been many reports of many herbs altering the PK and pharmacodynamic profiles of coadministered drugs[26]. In this context, it is important to understand what kind of interactions are possible with T. arjuna with other most commonly prescribed drugs for heart ailments. It will help in mitigating negative interactions and may also help enable synergistic interactions.
Partial scheme for the metabolism of phenacetin via oxidative O-deethylation to acetaminophen, which is further oxidised to its reactive toxic quinone imine metabolite.
In our present study, we evaluated the inhibitory effect of alcoholic, hydroalcoholic and aqueous extracts of T. arjuna and triterpenoids, AA and AG, on CYP1A activity in RLM and HLM. Rats are widely used animal models in discovery for early assessment of metabolism and PKs. Because of the ease of handling, relatively low cost, smaller amount of material required and a low interanimal variability, investigation of drug interaction potential of discovery compounds is commonly carried in this animal model. The species−specific isoforms of CYP1A, −2C, −2D and −3A show appreciable interspecies differences in terms of catalytic activity[27,28]. To focus on species variation of CYP1A activity of the extracts and triterpenoids, they were evaluated in RLM and HLM.
Due to the extensive use of alcoholic, hydroalcoholic and aqueous extracts of T. arjuna and the difference in levels of triterpenoids, all the extracts were chosen to evaluate its interaction potential with CYP1A enzyme in RLM and HLM. AA and AG were chosen as representative triterpenoids for evaluation with CYP1A enzyme.
Our results suggested that alcoholic, hydroalcoholic and aqueous extracts of T. arjuna showed a potent inhibition of CYP1A enzyme in RLM and HLM with IC50 values less than 50 μg/ml. There was a concentration−dependent inhibition of the metabolism of phenacetin to paracetamol in presence of extracts of T. arjuna in both RLM and HLM. However, AA and AG, did not show any inhibition of CYP1A enzyme in RLM and HLM up to concentrations of 50 μM. There was no concentration−dependent inhibition of the metabolism of phenacetin to paracetamol in presence of AA and AG in both RLM and HLM. There was no significant difference in the effect of extracts and triterpenoids on the CYP1A enzyme in RLM and HLM, indicating no difference in activities in different species. Differences in IC50< values indicate that presence of certain phytoconstituents at particular levels could be responsible for the difference in values. The triterpenoids saponins, AA and AG, in the pure isolated form did not show any effect, indicating they would also not be responsible for the CYP1A inhibitory effect seen by the extracts. The phytoconstituents responsible for the effects have to be further studies. Also, mode of inhibition and inhibition constant values of the extracts still needs to be investigated.
To provide an in vitro–in vivo correlation and since the aqueous extract showed more inhibition than the other extracts and it is reported to be used therapeutically, its in vivo interaction potential with CYP1A enzyme in rats was investigated. PK parameters of phenacetin in the group of animals treated for a week with aqueous extract of T. arjuna and vehicle treated group was not significantly different. This indicates aqueous extract of T. arjuna did not affect the clearance of phenacetin significantly in rats. Our studies suggest that aqueous, hydroalcoholic and alcoholic extracts showed potent in vitro inhibition of CYP1A enzyme in RLM and HLM. This indicates potential of the extracts to lead to undesirable herb–drug interactions. The in vivo PK study in rats using phenacetin as a probe substrate, indicated no effect in vivo by the aqueous extract of T. arjuna on the clearance of phenacetin. However, this does not rule out the possibility of undesirable herb–drug interactions and caution should be exercised when drugs that are CYP1A substrates with narrow therapeutic indices such as theophylline[5] are co–administered with T. arjuna.
Acknowledgements
The authors would like to thank Department of Biotechnology, New Delhi, India for providing financial support through project grant (DBT Project no: BT/ PR14460/PBD/17/703/2010) for the present research work. The authors would like to thank Dean of SPP-SPTM, NMIMS, Mumbai for providing support and necessary facilities. The authors also would like to acknowledge Dr. Naik of Piramal Life Sciences for his assistance in identifying the plant.
References
- Jain S, Yadav PP, Gill V, Vasudeva N, Singla N. Terminaliaarjuna a sacred medicinal plant: Phytochemical and pharmacological profile. Phytochem Rev 2009;8:491-502.
- Nadkarni AK. TerminaliaArjuna. Indian Mater Med 1976;1:1198-202.
- Kapoor LD. Handbook of Ayurvedic Medicinal Plants. Boca Raton, FL: CRC Press; 1990. p. 319-20.
- Ponnusankar S, Pandit S, Babu R, Bandyopadhyay A, Mukherjee PK. Cytochrome P450 inhibitory potential of Triphala-A Rasayana from Ayurveda. J Ethnopharmacol 2011;133:120-5.
- Hu L, Xu W, Zhang X, Su J, Liu X, Li H, et al. In vitro and in vivo evaluations of Cytochrome P450 1A2 interactions with nuciferine. J Pharm Pharmacol 2010;62:658-62.
- Guengerich PF. Cytochrome P450 Enzymes. Am Sci 1993;8i:440-7.
- Subash CV, Chotten LJ, Madan MP, Ramesh BD. Microwave extraction and rapid isolation of arjunic acid from Terminaliaarjuna (Roxb. ex DC.) stem bark and quantification of arjunic acid and arjunolic acid using HPLC-PDA technique. J Sep Sci 2012;35:1627-33.
- Savai J, Varghese A, Pandita N. Lack of the cytochrome P450 3A interaction of methanolic extract of Withaniasomnifera, Withaferin A, Withanolide A and Withanoside IV. J Pharm Negat Results 2013;4:26-32.
- Guidance for Industry- Drug Interaction Studies- Study Design, Data Analysis, and Implications for Dosing and Labeling. Clinical Pharmacology 2006.available at http://www.fda.gov/OHRMS/ DOCKETS/98fr/06d-0344-gdl0001.pdf [Last accessed on 2014 Feb 27].
- Chmielewska A, Konieczna J, Plenis A, Lamparczyk H. Quantitative determination of pentoxifylline in human plasma. ActaChromatogr 2006;16:70-9.
- Kumar S, Enjamoori R, Jaiswal A, Ray R, Seth S, Maulik SK. Catecholamine-induced myocardial fibrosis and oxidative stress is attenuated by Terminaliaarjuna (Roxb.). J Pharm Pharmacol 2005;61:1529-36.
- Miroslaw M, Katarzyna ZS, Marta J, Monika M. In vivo effect of diallylsulfide and cimetidine on phenacetin metabolism and bioavailability in rat.ActaBiochim Pol 2002;49:249-56.
- Bharani A, Ganguly A, Bhargava K. Salutary effect of Terminaliaarjuna in patients with severe refractory heart failure. Int J Cardiol 1995;49:191-9.
- Maulik S, Talwar K. Therapeutic potential of terminaliaArjuna in cardiovascular disorders. Am J Cardiovasc Drugs 2012;12:157-63.
- Maulik S, Katiyar K. TerminaliaArjuna in cardiovascular diseases: Making the transition from traditional to modern medicine in India. CurrPharmaBiotechnol 2010;11:855-60.
- Takahashi S, Tanaka H, Hano Y, Nomura T, Shigenobu K. Hypotensive effects in rats of hydrophilic extract from Terminaliaarjuna containing tannin-related compounds. Phytother Res 1997;11:424-7.
- Dwivedi S, Somani P, Chansouria J, Udupa K. Cardioprotective effects of certain indigenous drugs in myocardial ischemia in rabbits. Indian J ExpBiol 1988;26:969-75.
- Pawar R, Bhutani KK. Effect of oleananetriterpenoids from TerminaliaArjuna: A cardioprotective drug on the process of respiratory oxyburst. Phytomedicine 2005;12:391-3.
- Sumitra M, Manikandan P, Kumar A. Experimental myocardial necrosis in rats: Role of arjunolic acid on platelet aggregation, coagulation and antioxidant status. Mol Cell Biochem 2001;224:135-42.
- Khanna K, Chander C, Kapoor K. TerminaliaArjuna: An Ayurvediccardiotonic regulates lipid metabolism in hyperlipidemic rats. Phytother Res 1996;10:663-6.
- Subramaniam S, Ramachandran S, Uthrapathi S, Dubey G. Antihyperlipidemic and antioxidant potential of different fractions of TerminaliaarjunaRoxb. bark against PX- 407 induced hyperlipidemia. Indian J ExpBiol 2011;49:282-8.
- Kelly JP, Kaufman DW, Kelley K, Rosenberg L, Anderson TE, Mitchell AA. Recent trends in use of herbal and other natural products. Arch Intern Med 2005;165:281-6.
- Fasinu P, Bouic P, Rosenkranz B. A overview of the evidence and mechanisms of herb-drug interactions. Front Pharmacol 2012;3:1-19.
- Badal S, Williams SA, Huang G, Francis S, Vendantam P, Dunbar O, et al. Cytochrome P450 1 enzyme inhibition and anticancer potential of chromene amides from Amyris plumier. Fitoterapia 2011;82:230-6.
- Nelson S, Trager W. The use of deuterium isotope effects to probe the active site properties, mechanism of cytochrome p450-catalyzed reactions, and mechanisms of metabolically dependent toxicity. Drug MetabDispos 2003;31:1481-97
- Tachjian A, Maria V, Jahangir A. Use of herbal products and potential interactions in patients with cardiovascular diseases. J Am CollCardiol 2010;55:515-25.
- Marcella M, Geny G, Kanter R. Species differences between mouse, rat, dog, monkey and human CYP-mediated drug metabolism, inhibition and induction. Expert Opin Drug MetabToxicol 2006;2:875-94.
- Mandlekar V, Rose V. Cornelius U. Sleczka B, Caporuscio C, Wang J, et al. Development of an in vivo rat screen model to predict pharmacokinetic interactions of CYP3A4 substrates. Xenobiotica 2006;37:923-42.
